Trend Cycle Probability Analyzer
- Indicators
-
Evgenii Petrov
 FX & Macro Trader with 13+ years of experience in financial analysis and trading.
My primary focus is discretionary EUR/USD trading, with an emphasis on macroeconomic analysis, market structure, risk management and disciplined exposure management. - Version: 1.16
Trend Cycle Analysis Indicator for MetaTrader 5
I use this indicator in my own trading on a live account. You can review my trading history, open and closed trades, and account statistics on MQL5 Signals.
📊 My live trading account: https://www.mql5.com/ru/signals/2385035?source=Site+Signals+My
Indicator Description
Trend Cycle Analyzer is an analytical indicator for MetaTrader 5 designed to study trend cycles using two Simple Moving Averages: SMA 50 and SMA 200.
The indicator analyzes not only the direction of a cycle, but also its duration, the maximum distance between the moving averages, and the extreme slope value of SMA 200. These characteristics are compared with historical cycles, allowing you to examine the current market structure in the context of previous observations.
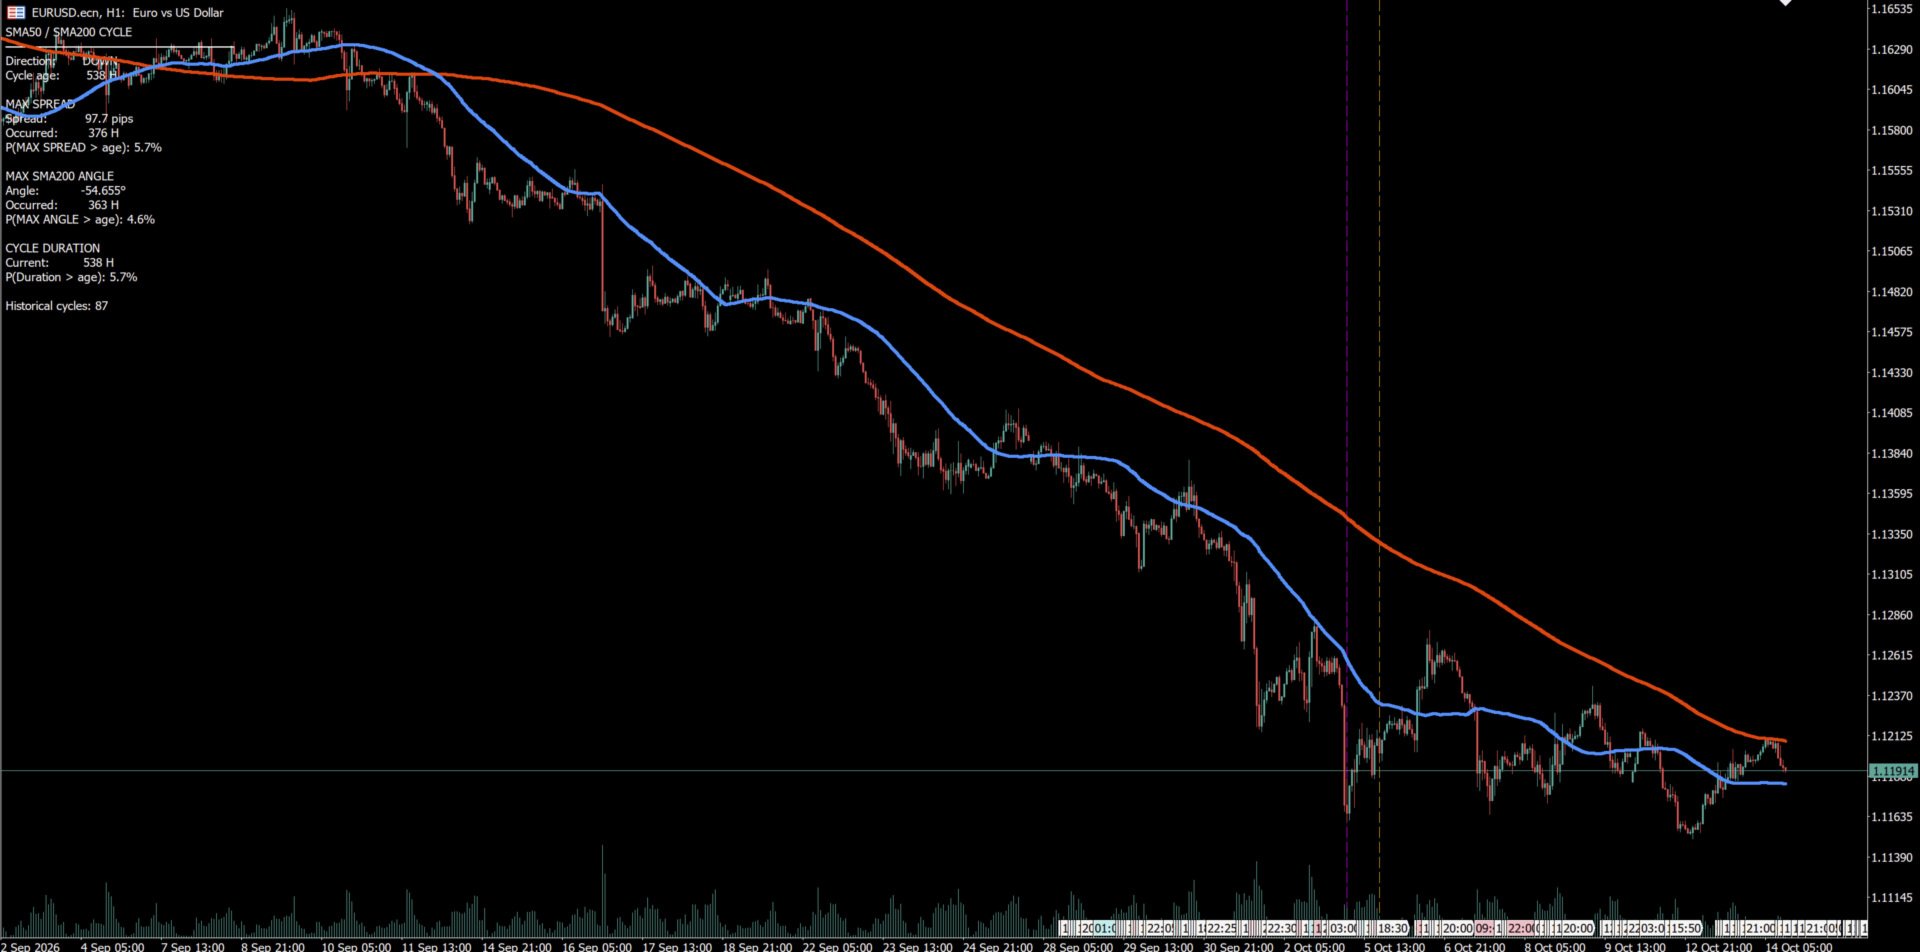
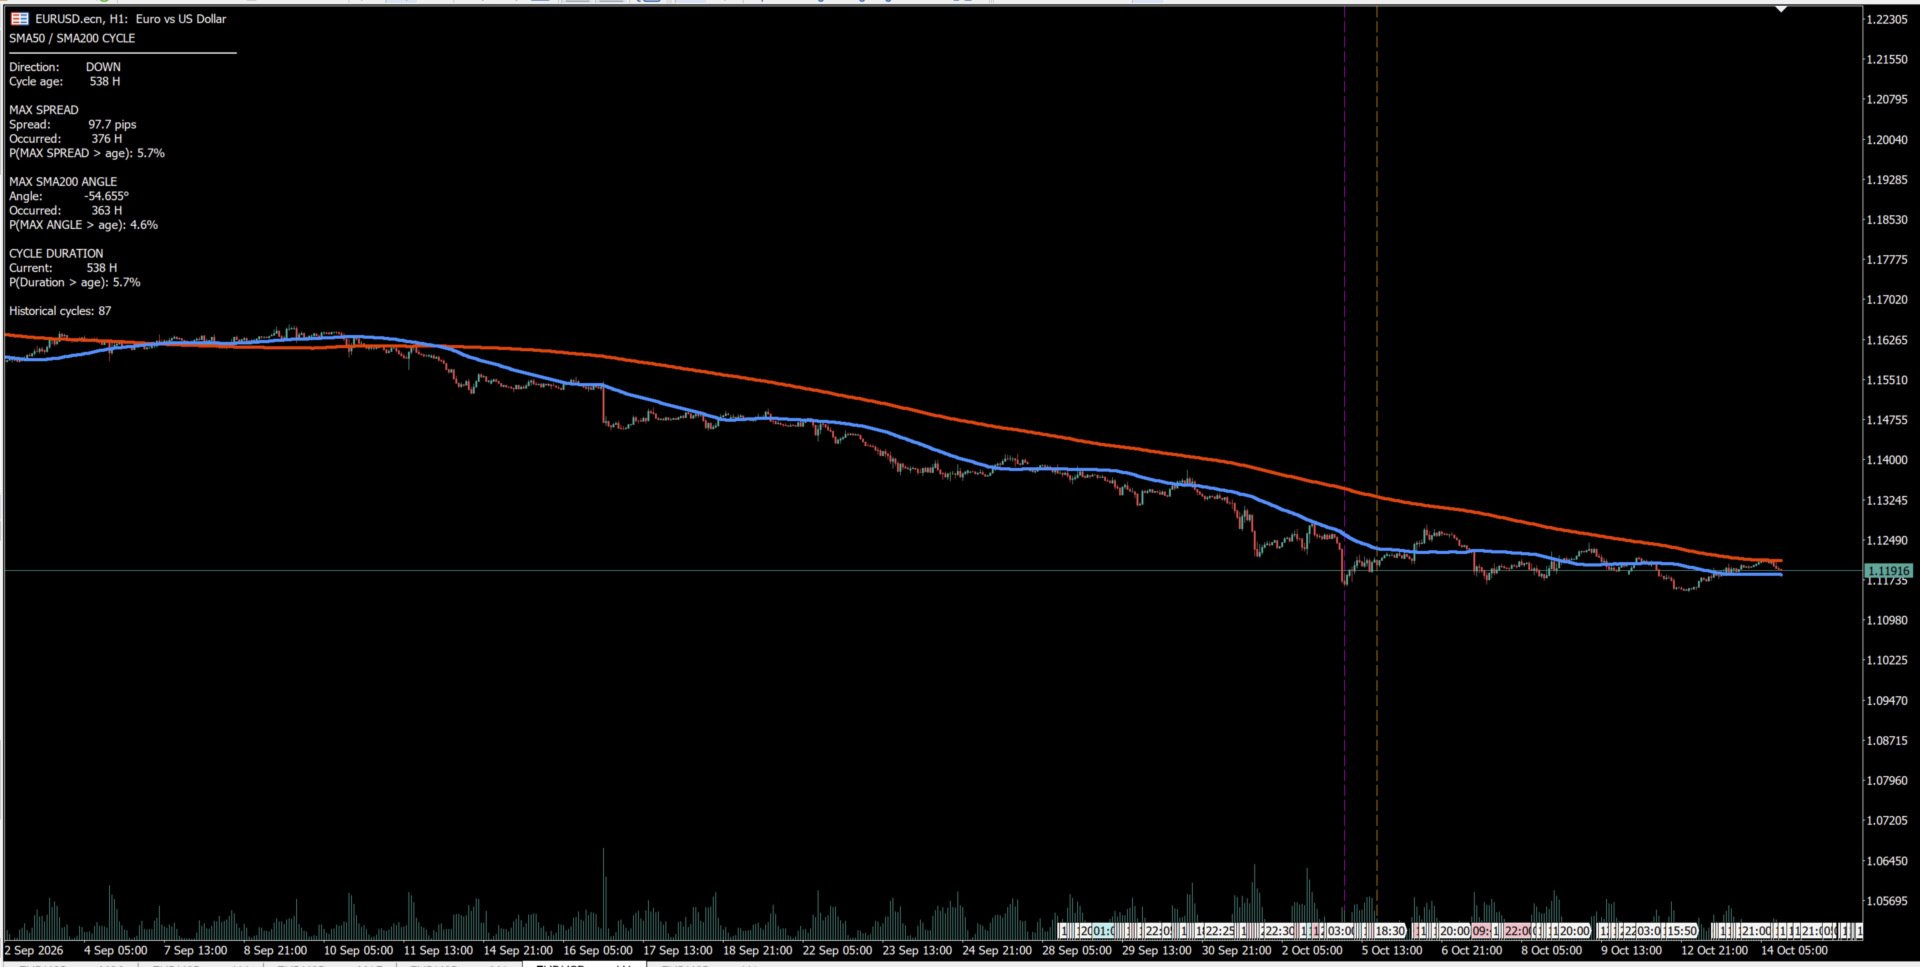
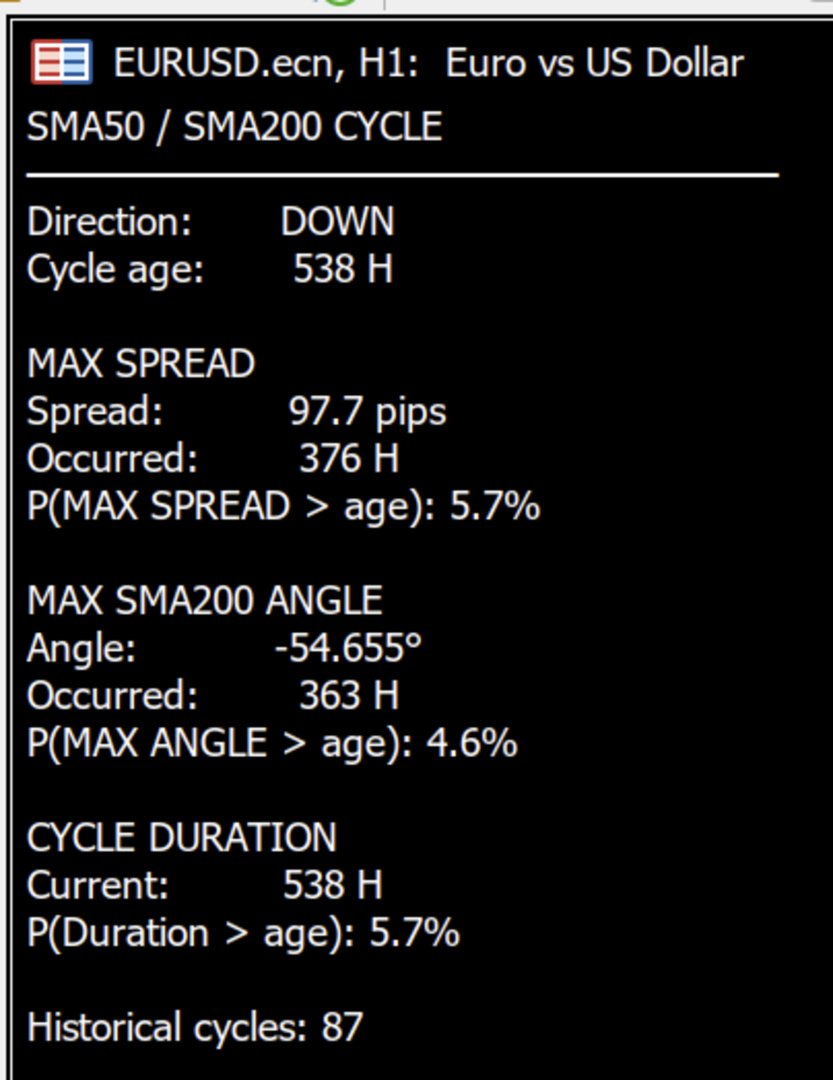
All key information is displayed in a compact on-chart panel. The indicator can also mark the bars where the maximum distance between the moving averages and the extreme SMA 200 slope value occurred, using vertical lines.
Trend Cycle Analyzer is designed for traders who want to do more than observe the relative positions of moving averages. It helps measure trend-cycle characteristics and compare them with historical data.
The indicator works exclusively on the H1 timeframe. It is intended for market analysis and does not automatically open or close trades.
Main Features
1. Trend Cycle Direction
The indicator compares SMA 50 and SMA 200:
- UP — SMA 50 is above SMA 200.
- DOWN — SMA 50 is below SMA 200.
A change in the relative positions of the moving averages defines the boundary between cycles.
2. Cycle Age
Displays the number of hourly bars elapsed since the beginning of the current cycle.
3. Maximum SMA Spread Analysis
Tracks the maximum absolute distance between SMA 50 and SMA 200 within each cycle. The indicator displays the maximum distance and the number of bars from the cycle start until it occurred.
4. SMA 200 Slope Analysis
Calculates changes in SMA 200 between consecutive hourly bars and tracks its extreme slope value relative to the direction of the cycle.
5. Historical Cycle Comparison
The panel displays statistics showing the percentage of included historical cycles in which:
- The cycle lasted longer than the current cycle's age.
- The maximum SMA spread occurred later.
- The extreme SMA 200 slope value occurred later.
6. Vertical Chart Lines
You can enable or disable two vertical lines:
- The line marking the maximum SMA spread.
- The line marking the extreme SMA 200 slope value.
The line color, style, and width can be configured.
7. Information Panel Settings
You can configure:
- The panel's horizontal and vertical position.
- Panel width and height.
- Background and text colors.
- Font size.
8. Historical Analysis Settings
You can set the minimum duration required for a completed cycle to be included in historical statistics and limit the number of H1 bars used for analysis.
The default minimum historical cycle duration is 200 bars. A value of 0 for the history lookback means that no additional history limit is applied, subject to the indicator's data requirements.
User Guide
1. Installation and Setup
Install Trend Cycle Analyzer in MetaTrader 5 and attach it to the chart of the financial instrument you want to analyze.
The indicator is designed exclusively for the H1 timeframe. The information panel is not displayed on other timeframes.
2. Cycle Direction — Direction
Shows the current cycle direction:
- UP — SMA 50 is above SMA 200.
- DOWN — SMA 50 is below SMA 200.
This classification is based on the relative positions of the moving averages. It does not guarantee that price will continue moving in the same direction.
3. Cycle Age — Cycle age
Displays the number of hourly bars since the current cycle began.
For example, 240 H means that the current cycle contains 240 hourly bars.
This value can be compared with the durations of completed historical cycles.
4. Maximum Spread — MAX SPREAD
This section displays three values.
Spread — the maximum absolute distance between SMA 50 and SMA 200 during the current cycle. The value is converted using a fixed scale of 0.0001 .
Occurred — the number of hourly bars from the beginning of the cycle until the maximum spread occurred.
Prob > age — the percentage of historical cycles in which the maximum spread occurred later in the cycle than it did in the current cycle.
For example, 70% means that the maximum spread occurred later in 70% of the included historical cycles.
This value does not mean that price has a 70% probability of continuing in its current direction or reversing.
5. Extreme Slope — MAX SMA200 ANGLE
This section shows the extreme SMA 200 slope value recorded during the current cycle.
Angle — the extreme slope value calculated from changes in SMA 200 between consecutive hourly bars.
Occurred — the number of hourly bars from the beginning of the cycle until the extreme value was recorded.
Prob > age — the percentage of historical cycles in which the extreme slope value occurred later than it did in the current cycle.
The slope calculation uses a fixed scale of 0.0001 . Therefore, this value should not be treated as a universal slope measure that can be directly compared across instruments with substantially different quotation scales.
6. Cycle Duration — CYCLE DURATION
Current — the number of hourly bars in the current cycle.
Prob > age — the proportion of included historical cycles whose duration exceeded the current cycle's age.
For example, 60% means that 60% of the historical cycles in the sample lasted longer than the current cycle has lasted so far.
This is a historical duration comparison, not a forecast of how long the current cycle will continue.
7. Number of Historical Cycles — Historical cycles
Displays the number of completed cycles included in the historical comparison.
Only cycles that meet the minimum historical cycle duration setting are included. The sample size and displayed percentages may change depending on the available history and analysis settings.
Interpret the results cautiously when the historical sample is small.
8. Vertical Lines
When enabled, the indicator marks two events in the current cycle:
- The maximum distance between SMA 50 and SMA 200.
- The extreme SMA 200 slope value.
You can enable or disable the lines and configure their color, style, and width.
These lines are visual analysis aids, not trading signals.
How to Interpret Historical Percentages
Historical percentages answer the following question: How early or late did a particular event occur in the current cycle compared with completed historical cycles?
For example, if the maximum SMA spread occurred on bar 100 of the current cycle and Prob > age is 75% , this means that in 75% of the included historical cycles, the maximum spread occurred after bar 100.
This allows you to compare the current cycle with historical observations. It does not provide the probability of a future reversal, trend continuation, or new maximum.
Consider multiple indicators and market conditions together rather than relying on a single percentage.
Indicator Settings
| Parameter | Description |
|---|---|
| InpFastSMA | Fast moving average period; default: 50 |
| InpSlowSMA | Slow moving average period; default: 200 |
| InpMinHistoricalCycle | Minimum cycle duration for inclusion in historical statistics; default: 200 bars |
| InpHistoryLookback | Limit on the number of historical bars; 0 means no additional limit |
| InpShowMaxSpreadLine | Show or hide the maximum spread line |
| InpShowMaxAngleLine | Show or hide the extreme slope line |
| InpMaxSpreadColor | Color of the maximum spread line |
| InpMaxAngleColor | Color of the extreme slope line |
| InpLineStyle | Vertical line style |
| InpLineWidth | Vertical line width |
| InpPanelBackColor | Panel background color |
| InpPanelTextColor | Panel text color |
| InpPanelX | Horizontal panel position |
| InpPanelY | Vertical panel position |
| InpPanelWidth | Panel width |
| InpPanelHeight | Panel height |
| InpPanelFontSize | Panel font size |
Technical Limitations
- Platform: MetaTrader 5.
- Supported timeframe: H1 only.
- Main analysis tools: two Simple Moving Averages with configurable periods.
- The indicator does not open or close trades.
- Historical percentages describe observations in a sample of completed cycles. They are not forecasts of future market movements.
- The spread conversion and slope calculation use a fixed scale of 0.0001 . Keep this in mind when using the indicator on instruments with different quotation scales.
Trend Cycle Analyzer is a tool for measuring and comparing trend-cycle characteristics. It provides additional information for independent market analysis but does not replace a trading strategy or risk management.