Topdown Trend Dashboard
- Indicators
-
DL TEC SOLUTIONS LTD
 Welcome to my Profile.👨🏻💻
Here you'll find professionally developed Expert Advisors and Indicators designed with stability, efficiency, and ease of use in mind. Every product is carefully developed, thoroughly tested, and regularly updated to provide reliable tools for your daily trading.📊 - Version: 1.10
- Updated: 5 September 2026
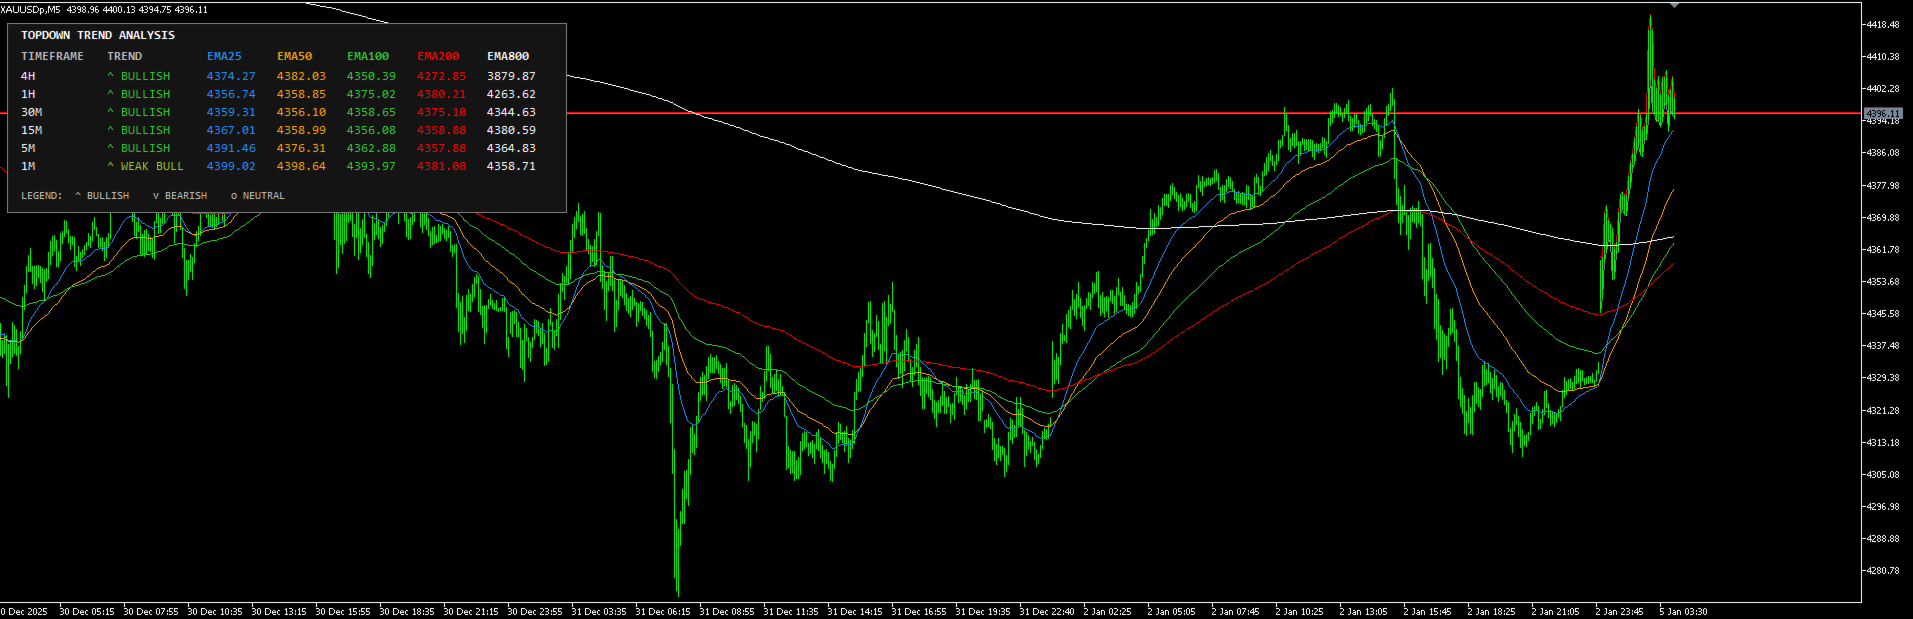
Topdown Trend Dashboard puts real top-down market analysis right on your chart, so you stop flipping between timeframes to figure out the bigger picture. It watches six timeframes at once — 4H, 1H, 30M, 15M, 5M and 1M — and shows you a live, color-coded trend call for each one in a compact panel.
The trend calls come from five EMAs (25, 50, 100, 200 and 800), so you get a read on short-, medium- and long-term momentum that's quick to check but grounded in something real — no repainting, no laggy signal arrows.
Key Features
- Six timeframes checked in real time from a single chart: 4H, 1H, 30M, 15M, 5M, 1M
- Trend engine built on 5 EMAs (25/50/100/200/800) with a majority-vote read per timeframe — Bullish, Weak Bullish, Neutral, Weak Bearish or Bearish
- A real dashboard, not a wall of Comment() text — an object-based panel that stays properly aligned no matter which chart corner you pin it to
- Customize it to fit your setup:
- Any of the 4 chart corners, and it repositions itself automatically if you resize the chart
- X/Y offset, plus a choice of fonts (Consolas, Courier New, Lucida Console, Arial, Tahoma, Calibri, Segoe UI, Verdana) and font size
- Your own color for each EMA, applied to both the chart lines and the dashboard text
- Works on any symbol and any chart timeframe — the six analyzed timeframes don't depend on what chart you're looking at
- Light on resources: no DLLs, no external dependencies, barely touches your CPU
How It Works For each of the six timeframes, the indicator checks where the last closed price sits relative to all five EMAs. Four or five pointing the same way gives you a clean Bullish or Bearish read; a 3-2 split gets marked "Weak"; a dead even split is Neutral. It's a quick way to see whether your timeframes actually agree with each other — which is really the whole point of trading top-down.
Recommended Use Check the dashboard before you enter to confirm your bias — you want your trading timeframe lining up with the higher timeframes above it. This is a confirmation tool, not a signal generator or an EA that trades for you.
Inputs
- Dashboard corner, X/Y offset
- Font and font size
- Colors for EMA 25/50/100/200/800 (used on both the chart and the dashboard)
Notes
- No repainting — everything's calculated off closed candles
- Works with any broker/symbol that has standard MT5 price history
- Needs at least 800 bars on the chart timeframe to initialize (that's what the EMA 800 needs)