CVD Divergencies

CVD Divergencies — Cumulative Volume Delta with Automatic Divergence Detection

See what's really driving price — not just where it's going.

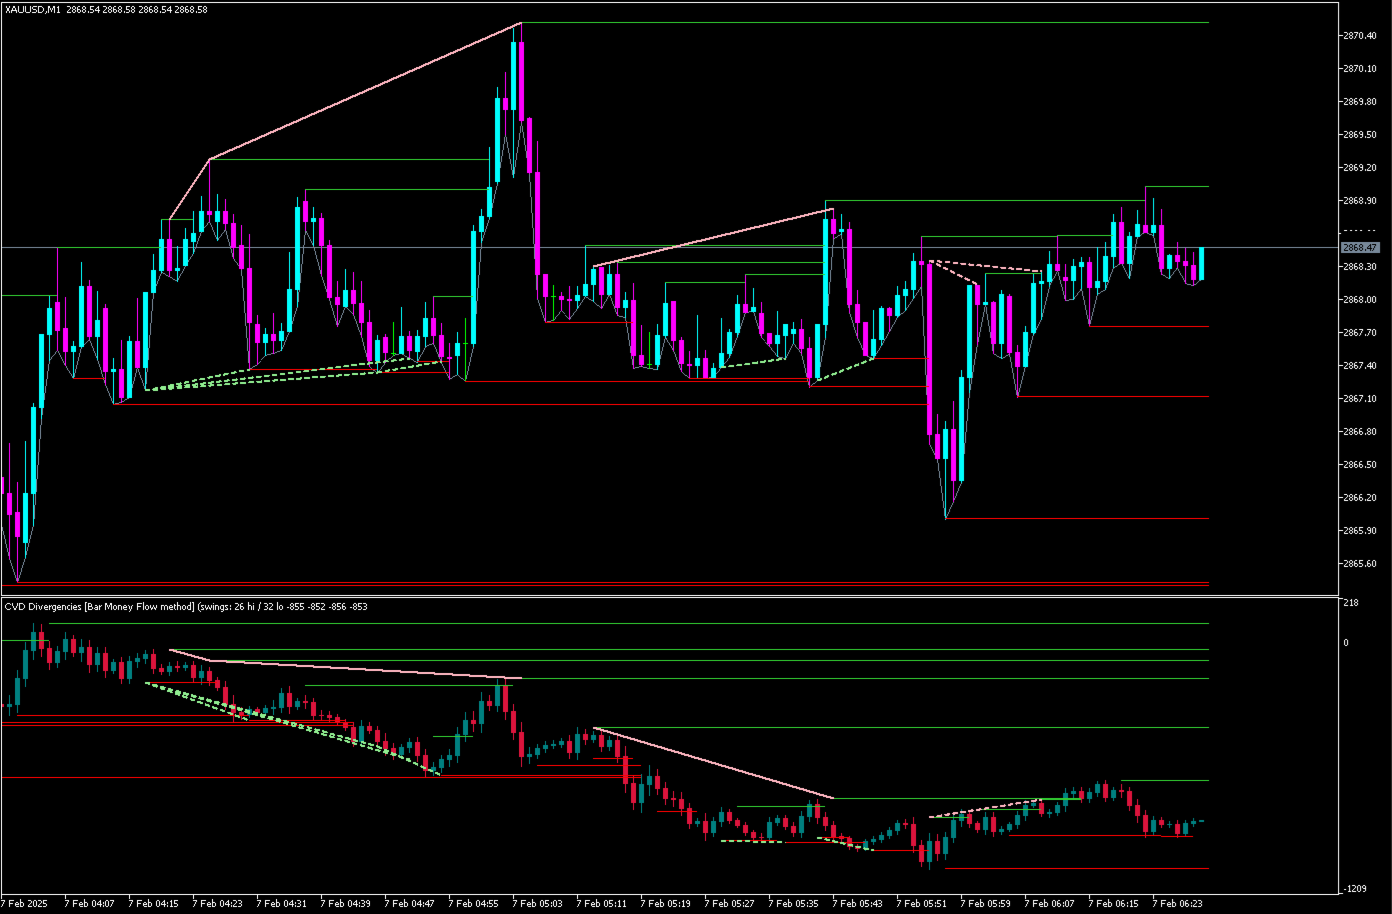
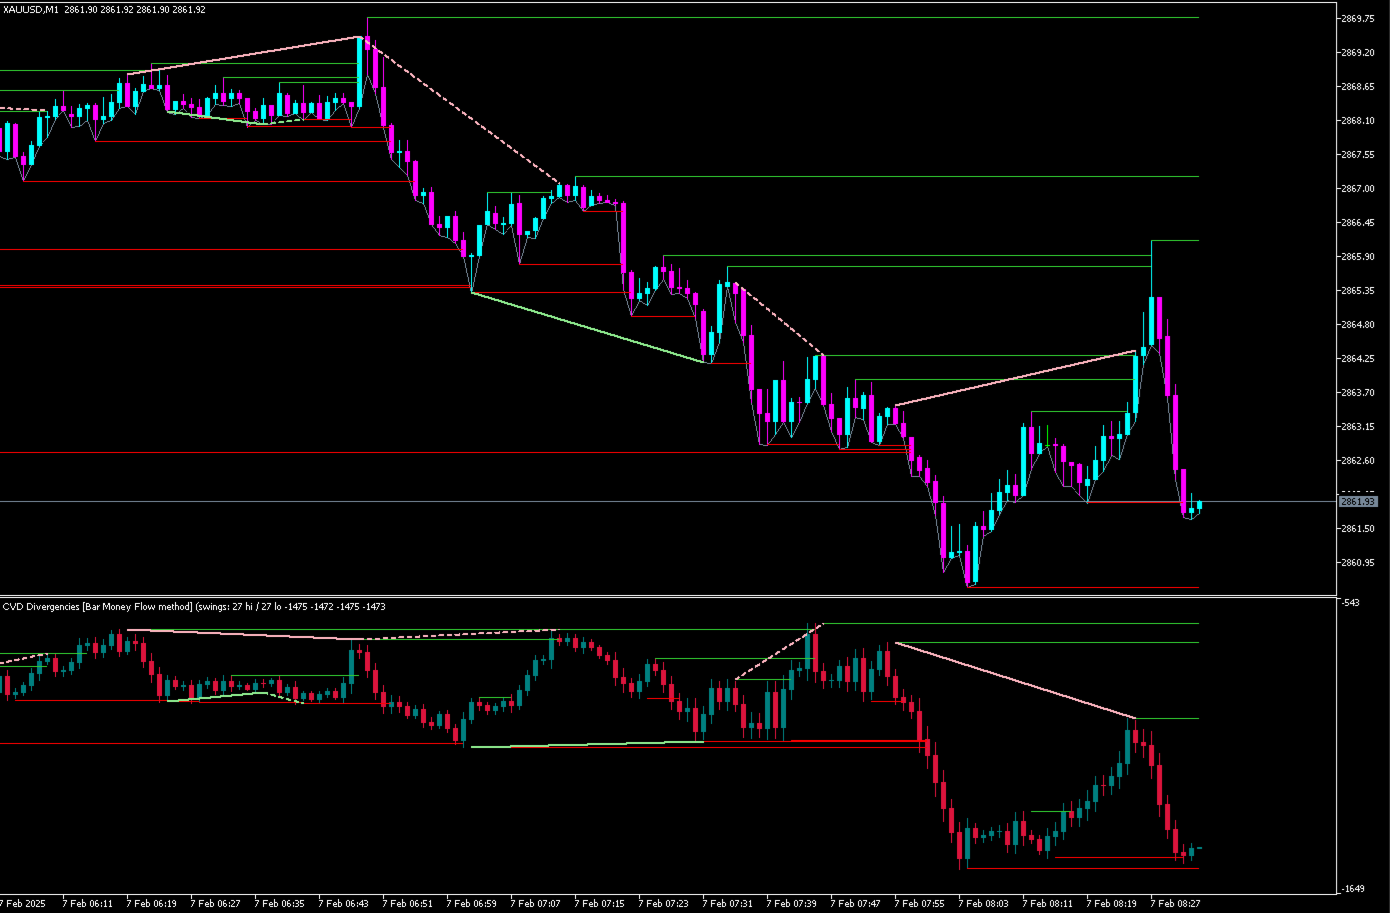
CVD Divergencies plots Cumulative Volume Delta (CVD) as its own candlestick chart and automatically detects and draws divergences between price and CVD in real time — on both the CVD window and directly on your price chart. No manual chart-watching required: when price and underlying order flow disagree, the indicator finds it, draws it, and alerts you.

Key Features

  • CVD Candles — full OHLC candlestick representation of cumulative volume delta, not just a line, so you can read the shape and momentum of order flow the same way you read price
  • 4 calculation methods — choose the approach that best fits your instrument and broker's data (see below)
  • Automatic Regular Divergence detection — classic reversal signal
  • Automatic Hidden Divergence detection — trend-continuation signal
  • Divergence lines on both windows — drawn on the CVD panel and directly on your price chart, so the confluence is immediately visible
  • Configurable swing high/low lines — on both the CVD window and price chart
  • Built-in alerts — popup and terminal push notification the moment a new divergence forms
  • Non-repainting — once a signal is confirmed it never changes or disappears; nothing is redrawn retroactively
  • Deep customization — colors, line styles, thickness, sensitivity, and detection width are all configurable

What is Cumulative Volume Delta?

CVD tracks the running balance of buying pressure versus selling pressure over time. Unlike ordinary volume, which just shows how much activity happened, CVD shows who's winning — buyers or sellers — and by how much. Plotted as its own chart, CVD often moves differently from price itself, and those moments of disagreement are exactly where this indicator focuses.

What Are Divergences?

Regular Divergence — reversal signal. Price makes a new extreme that CVD doesn't confirm, warning that the move's underlying momentum is weaker than price alone suggests.

  • Regular Bullish: price makes a lower low, but CVD makes a higher low
  • Regular Bearish: price makes a higher high, but CVD makes a lower high

Hidden Divergence — continuation signal. The mirror-image pattern, typically appearing during a pullback within an established trend, suggesting the trend is likely to continue.

  • Hidden Bullish: price makes a higher low, but CVD makes a lower low
  • Hidden Bearish: price makes a lower high, but CVD makes a higher high

Both are standard technical-analysis concepts — the same logic used for RSI or MACD divergence — applied here to order flow instead of a momentum oscillator.

Trading with Absorption & Exhaustion

Two of the most useful order-flow concepts you can read directly from these divergences:

Exhaustion happens when price makes a strong move but CVD fails to confirm it — the move is being driven by momentum rather than genuine sustained participation, and it's running low on fuel. This is exactly what Regular Divergence captures:

  • Price makes a new high, but CVD makes a lower high → buying pressure is exhausted, watch for a reversal down
  • Price makes a new low, but CVD makes a higher low → selling pressure is exhausted, watch for a reversal up

Absorption happens when one side is actively "catching" the other's aggressive pressure — building position while preventing price from moving much despite heavy underlying volume. When the absorbed side eventually gives out, price tends to move sharply in the absorber's direction. Watch for CVD to build strong directional momentum in the CVD window while price stays comparatively flat or struggles to keep pace at a key level, even when the price panel looks calm.

For best results, combine divergence signals with:

  • Support & Resistance — a divergence that forms right at a well-established S/R level carries far more weight than one in open space. Wait for price to actually interact with a level before acting on a signal.
  • Volume Profile — absorption at high-volume nodes (areas where the most historical volume has traded) often marks major turning points, since that's where large participants are most likely positioned.
  • VWAP — a divergence forming as price tests VWAP from either side is one of the highest-probability setups in order-flow trading; VWAP tends to act as both a magnet and a decision point for institutional flow.

This indicator doesn't need S/R, Volume Profile, or VWAP built in — simply add your existing indicators for those to the same chart, and use CVD Divergencies as the order-flow confirmation layer on top. A divergence alone is a useful signal; a divergence at a key level is a much stronger one.

Calculation Methods

Method Best for
Bar Money Flow (default) Chaikin-style volume weighting; works well across most instruments and brokers
Sierra Fixed, volume-scaled wick centered on the bar
Tick Rule Uses real tick-by-tick data for maximum precision (requires your broker to provide tick history)
OHLC Path Estimates the intrabar path from candle shape alone

Switch methods anytime from the settings — no need to reload your chart layout.

Recommended Settings

The indicator ships with default settings that have been tested extensively across live market conditions and give a reliable balance of accuracy, responsiveness, and clean charts. For most traders, the defaults are the best starting point — the settings below are there for anyone who wants to fine-tune sensitivity or appearance to their own style.

Settings Guide

CVD Calculation

  • Calculation method — how CVD is derived from price and volume. Bar Money Flow (default) gives the most reliable results across most brokers and instruments.
  • Bars to calculate — how much history the indicator processes on load. Higher values give more visible history at a small cost to load time.
  • Price source — which price feed to use for tick-based calculation (only relevant if using the Tick Rule method).

Swing Lines

  • Show on CVD window / Show on price chart — toggle the horizontal swing high/low lines on either panel independently.
  • Swing sensitivity — how many bars on each side are needed to confirm a swing point. Lower values find more (smaller) swings; higher values find fewer (larger) ones.
  • Bars to scan — how far back the indicator looks when searching for swing points.
  • Colors and thickness — visual styling for the swing lines.

Divergence Detection

  • Show regular / Show hidden — turn each divergence type on or off independently.
  • Wait for confirmation — when enabled, a swing point is only used once confirmed by a few bars afterward, avoiding false signals from price that hasn't settled yet. Recommended to leave on.
  • Minimum swing size — filters out small, noisy swings so only meaningful moves are considered for divergence.
  • Volatility window — how many recent bars are used to judge what counts as a "meaningful" swing, so the filter adapts to current market conditions rather than a single old, outsized move.
  • Minimum / Maximum width — how close together or far apart the two points of a divergence are allowed to be.
  • Line tolerance — how strictly the connecting line must avoid crossing through candles in between; a small tolerance allows for normal market noise.
  • Colors, line thickness, and line styles — visual styling, with regular and hidden divergences distinguishable by both color and line style.

Alerts

  • Enable alerts — master switch for popup/push notifications.
  • Alert on regular / Alert on hidden — choose which divergence types trigger a notification.

Display

  • Show status info — displays the active calculation method along with live swing and divergence counts directly in the indicator's name, for a quick at-a-glance check.

Who Is This For?

  • Day traders and scalpers looking for order-flow confirmation on entries
  • Swing traders identifying high-probability reversal or continuation zones
  • Anyone already using volume/order-flow concepts who wants it automated rather than eyeballed

Notes

Feel free to contact me for any questions, suggestions or issues.

CVD is calculated from your broker's available tick and volume data. Works on any symbol and any timeframe — Forex, indices, commodities, and crypto.

Trading involves substantial risk. This indicator is an analysis tool, not financial advice, and does not guarantee profitable results. Always use proper risk management and test thoroughly on a demo account before live trading.

Prodotti consigliati
The VWAP indicator is our version of the popular Volume-Weighted Average Price indicator. The VWAP is the ratio between the value traded (price multiplied by the number of volume traded) and the total volume traded over a specific time period. As a result, it measures the average price of the instrument much better than the simple moving average. Although there are many ways to use the VWAP, most investors use it to calculate the daily average.  The indicator works in five modes: Moving  - In
MR Volume Profile 5
Sergey Khramchenkov
The "MR Volume Profile 5" indicator is a charting tool that displays trading volume at different price levels rather than time intervals. A key concept in volume profile is the point of control (POC)—the price level with the highest volume traded during the session or time range. While tools like VWAP or OBV provide volume trends, the "MR Volume Profile 5" indicator offers granular detail about where the most market activity occurs at specific price levels. This makes it a more precise tool for
Heiken Ashi Stacked Pro is a chart overlay indicator that combines smooth Heiken Ashi visual trend candles, a real-time bar completion timer, and an on-hover crosshair HUD for instant price and wick-to-body ratio diagnostics. Marketplace Description Overview Heiken Ashi Stacked Pro upgrades standard Heiken Ashi candle visuals with an interactive HUD. Designed for trend followers and price action traders, it filters out market noise using colored candles while supplying precise candle metric read
VolumeDeltaBars
Stanislav Korotky
This indicator is a conventional analytical tool for tick volumes changes. It calculates tick volumes for buys and sells separately, and their delta on every bar, and displays volumes by price clusters (cells) within a specified bar (usually the latest one). The algorithm used internally is the same as in the indicator VolumeDeltaMT5 , but results are shown as cumulative volume delta bars (candlesticks). Analogous indicator for MetaTrader 4 exists - CumulativeDeltaBars . This is a limited substi
Time and Sales Tick
Pablo Filipe Soares De Almeida
Time & Sales Tick Indicator è un indicatore per MetaTrader 5 che mostra i dati dei tick in tempo reale. Visualizza prezzo, volume dei tick e orario direttamente sul grafico. Funzionalità Mostra i dati dei tick, inclusi prezzo, volume e tempo, in un pannello sul grafico. Raggruppa i tick in intervalli definiti dall’utente, con colori distinti (verde per rialzo, rosso per ribasso). Il pannello può essere posizionato in qualsiasi angolo del grafico.
CVD SmoothFlow Pro
Thalles Nascimento De Carvalho
CVD SmoothFlow Pro - Analisi del Volume Illimitata per Qualsiasi Attivo! CVD SmoothFlow Pro è la soluzione definitiva per i trader che cercano un'analisi del volume precisa e illimitata. Utilizzando il calcolo del Cumulative Volume Delta (CVD) con filtraggio avanzato del rumore, la versione Pro offre la flessibilità e la precisione necessarie per operare su qualsiasi strumento finanziario. Cosa offre CVD SmoothFlow Pro? Analisi Chiara : Filtra il rumore di mercato e mette in risalto i movi
English Version Unlock the Power of Volume with Next-Generation Volume Profile This advanced Volume Profile indicator transforms your MetaTrader 5 chart into a powerful volume analysis tool. Unlike standard volume indicators that only show volume over time, this tool displays volume distribution across   price levels , allowing you to pinpoint exactly where the "big money" is trading. Why choose this indicator? Dynamic Price Bins:   Set your own precision (number of rows) to view volume clust

The Volume+ and VSA Signals indicator for MT5 is based on the Volume Spread Analysis (VSA) methodology to provide the signals. The signals are displayed at closing of bars on the main window or subwindow in the form of symbols. The symbols are not repainting.  The indicator produces a signal on an individual bar and this signal is not buy or sell signal. When a minor trend goes in the opposite direction of a major trend, there are sequences of major trend-following signals that give a higher pro
Volume Profile Delta
Juan Eduardo Verdala
Volume Profile Delta — Indicator for MetaTrader 5 Volume Profile Delta is an indicator that displays the difference between buying volume and selling volume recorded on each bar, represented as a histogram at the bottom of the chart. What this indicator does On each bar it calculates the difference between the volume associated with upward movements and the volume associated with downward movements. The result is shown as a bar in the lower histogram, making it possible to observe whether buying
FREE
Tick Volume Moving Averages
Kristmundur Roman Zakharii
Separated tick volume moving averages: This tool makes it is easier to track the volume behind the moves. It will separate tick volume into bullish and bearish volumes with two separate moving averages. Tracking volume versus price in an easy way is now accessable to any trader. It will put you on track with the market makers and those who move the price. Volume is not the only thing which moves the price but its an important factor behind it. Hence it has a predictive power. How tick volume w
Buy/Sell Volume Indicator with Pair Divergence for MT5  version "1.1" Description The Enhanced Buy/Sell Volume Indicator is a custom technical indicator designed for MetaTrader 5 (MT5) to analyze and visualize buy and sell tick volumes in a separate window. It provides traders with insights into market dynamics by highlighting volume dominance, balance, and divergence patterns. The indicator uses tick volume data to estimate buying and selling pressure, offering a detailed view of market sentime
Mirror Chart MT5
Andrej Hermann
5 (1)
The Mirror Chart MT5 is a overlay indicator specifically designed to project a second financial instrument directly onto the main chart window. This tool is invaluable for traders who rely on correlation analysis, as it visualizes the price movements of two different instruments in real time. Unlike traditional overlays, this indicator utilizes intelligent, dynamic centering and scaling logic. It continuously analyzes the visible price range in the current window for both symbols and calculates
FREE
LM Volume Profile MT5 LM Volume Profile MT5 displays the distribution of calculated volume across price levels directly on the MetaTrader 5 chart. The indicator divides the selected price range into configurable price rows and displays the volume distribution as a horizontal histogram. It also calculates the Point of Control, Value Area High, Value Area Low, average profile price, and optional VWAP reference. Four profile modes are available: - Visible Range - Fixed Range - Session - Daily
FREE
Do you use volume in your reading of the market? Certainly many traders use it, and do not imagine operating without it. The Color Histogram Volume Set indicator allows the user to choose the value that he considers interesting to monitor. When you pass this you will have visual confirmation and if you want you will also have the audible alert that is given by the indicator. Of course, there are other ways to try to find a high volume, such as assessing whether the volume is above av
AVVISO IMPORTANTE – LICENZA E ATTIVAZIONE RICHIESTE ==================================================== Istruzioni per l'attivazione: Dopo aver completato l'acquisto, contattaci immediatamente per ricevere la tua chiave di licenza, password o dati di attivazione. Senza questi, il software non funzionerà. Siamo qui per garantire un processo di attivazione senza intoppi e assisterti per qualsiasi domanda. --- Volume Delta Profile V2 Enhanced ================================ Strumento Pr
Mini Chart Indicators
Flavio Javier Jarabeck
The Metatrader 5 has a hidden jewel called Chart Object, mostly unknown to the common users and hidden in a sub-menu within the platform. Called Mini Chart, this object is a miniature instance of a big/normal chart that could be added/attached to any normal chart, this way the Mini Chart will be bound to the main Chart in a very minimalist way saving a precious amount of real state on your screen. If you don't know the Mini Chart, give it a try - see the video and screenshots below. This is a gr
Delta Profile Volume
Teresinha Moraes Correia
Technical Description of the Indicator – Delta Profile for MetaTrader 5 The Delta Profile is an indicator developed for MetaTrader 5 focused on detailed analysis of volume flow within a defined range of candles. It organizes and displays information about the imbalance of positive volumes (associated with upward movements) and negative volumes (associated with downward movements) at different price levels. The result is a clear view of the chart points where the highest concentration of trades o
UPD1 Profile Levels MT5
Vitaliy Kuznetsov
5 (4)
L'indicatore trova i livelli del volume di prezzo massimo e minimo (profilo di mercato) nell'istogramma di lavoro per il numero specificato di barre.   Profilo composito. L'altezza dell'istogramma è completamente automatica e si adatta a qualsiasi strumento e periodo di tempo. Viene utilizzato l'algoritmo dell'autore e non ripete analoghi noti. L'altezza dei due istogrammi è approssimativamente uguale all'altezza media della candela. Smart alert (smart alert) ti aiuta a comunicare il prezzo rela
Volume Candle Indicator
Pablo Filipe Soares De Almeida
Istogramma del Volume Colorato per MetaTrader 5 Questo indicatore mostra il volume come un istogramma in una finestra separata. Le barre sono colorate in base alla direzione della candela: verde per rialzista (chiusura > apertura) e rosso per ribassista (chiusura < apertura). Funzionalità principali Fonte del volume: volume dei tick o volume reale (selezionabile). Linea di media mobile opzionale sopra l’istogramma del volume. Tipi di media supportati: SMA, EMA, SMMA, LWMA. Periodo medio configur
The Accumulation and Distribution indicator is a volume-based indicator that was essentially designed to measure underlying supply and demand. This is accomplished by trying to determine whether traders are actually accumulating (buying) or distributing (selling). This is accomplished by plotting a cumulative total of the money flow volume for each period. This indicator can reveal divergences between volume flow and actual price to primarily affirm a current trend or to anticipate a future reve
AVVISO IMPORTANTE – RICHIESTI LICENZA E ATTIVAZIONE Istruzioni per l’attivazione: Dopo aver completato l’acquisto, contattaci immediatamente per ricevere la tua chiave di licenza, password o i dettagli di attivazione. Senza questi, il software non funzionerà. Siamo qui per garantire un processo di attivazione fluido e assisterti con qualsiasi domanda. Personalizzazione multilingue Per migliorare la tua esperienza di trading, offriamo una personalizzazione completa del software in dive
Here   our more valuable tools SMC Trend Trading   ,  Easy SMC Trading  ,  Institutional SMC Architect Volume Analysis Tools  ,  Volume flow Profile  ,  Market volume profile  , FVG with Volume  , Liquidity Heatmap Profile  ,  Volume Spread Analysis Boom: Take SELL signals only (price spikes up then crashes) Crash: Take BUY signals only (price drops then spikes up) SL goes beyond the line as labeled Interactive Market Watch Panel : A left-side sidebar showing real-time strength indicators (po
Symbol: EURUSD Timeframe: 30 minutes (M30) For other symbols or timeframes, adjust the settings to match the market. Volume Profile POC Breakout builds a volume profile from recent candles, finds the Point of Control (POC) and marks clean breakouts of that level. Each breakout is shown as a complete trade plan with entry, stop loss and three take profit levels, filtered by the higher timeframe trend and rated by a quality score. The indicator does not open trades. It is a visual and analysis to
The Super Arrow Indicator provides non-repainting buy and sell signals with exceptional accuracy. Key Features No repainting – confirmed signals remain fixed Clear visual arrows: green for buy, red for sell Real-time alerts via pop-up, sound, and optional email Clean chart view with no unnecessary clutter Works on all markets: Forex, gold, oil, indices, crypto Adjustable Parameters TimeFrame Default:   "current time frame" Function:   Sets the time frame for indicator calculation Options:   Can
Versione MT4: https://www.mql5.com/en/market/product/157433 Versione MT5: https://www.mql5.com/en/market/product/167286 Volume Imbalance è uno strumento di visualizzazione leggero con Profilo Volume + Squilibrio Delta, progettato per aiutarti a individuare zone di prezzo ad alta attività, pressione direzionale e aree di prezzo "vuote" all'interno di un intervallo di retrospettiva configurabile. A differenza del classico profilo volume che mostra solo il volume totale, questo indicatore suddiv
Il Volume Profile è uno degli strumenti analitici più potenti utilizzati dai trader professionisti e istituzionali. A differenza dei tradizionali indicatori di volume che mostrano solo quando si sono verificate le transazioni nella parte inferiore dello schermo, il Volume Profile mostra esattamente a quali livelli di prezzo sono avvenute tali transazioni. Questo ti offre una chiara visione a raggi X della struttura del mercato, permettendoti di vedere esattamente dove la smart money (denaro inte
Wapv Price and volume
Eduardo Da Costa Custodio Santos
L'indicatore di prezzo e volume WAPV per MT5 fa parte del set di strumenti (Wyckoff Academy Wave Market) e (Wyckoff Academy Price and Volume). L'indicatore di prezzo e volume WAPV per MT5 è stato creato per semplificare la visualizzazione del movimento del volume sul grafico in modo intuitivo. Con esso puoi osservare i momenti di picco del volume e i momenti in cui il mercato non ha interesse professionale Identifica i momenti in cui il mercato si muove per inerzia e non per movimento di "denaro
BoxChart MT5
Evgeny Shevtsov
5 (7)
The market is unfair if only because 10% of participants manage 90% of funds. An ordinary trader has slim changes to stand against these "vultures". This problem can be solved. You just need to be among these 10%, learn to predict their intentions and move with them. Volume is the only preemptive factor that faultlessly works on any timeframe and symbol. First, the volume appears and is accumulated, and only then the price moves. The price moves from one volume to another. Areas of volume accumu
Volume Profile For MT5
Abdelkhabir Yassine Alaoui
Volume Profile VPVR per MT5 Volume Profile VPVR è un indicatore potente e performante per MetaTrader 5, progettato per replicare l'avanzato Volume Profile (Visible Range) direttamente sul grafico. Fornisce una visione approfondita della struttura del mercato, visualizzando le aree in cui si concentra l'attività di trading e aiutando i trader a identificare con precisione i livelli di prezzo chiave. Questo indicatore analizza dinamicamente la distribuzione dei volumi sui diversi livelli di pre
WAPV Box Effort x Result
Eduardo Da Costa Custodio Santos
RISULTATO WA_PV_BOX_EFFORT X per MT5 Il WAPV Box Effort x Result Indicator fa parte del gruppo Package Indicators (Wyckoff Academy Wave Market). L'indicatore WAPV Box Effort x Result Indicator per MT5 ti aiuta a leggere il prezzo e il volume. La sua lettura consiste nell'assistere nell'identificazione dello sforzo x risultato in onde create dal grafico. L'indicatore WAPV Box Effort x Result Indicator per MT5 quando la casella è verde significa che il volume è a favore della domanda e quando la c
Gli utenti di questo prodotto hanno anche acquistato
Trend Sniper X
Sarvarbek Abduvoxobov
4.9 (41)
Trend Sniper X è un indicatore trend-following multi-timeframe per MetaTrader 5 che aiuta i trader a identificare la direzione del trend e i potenziali punti di inversione con chiarezza e precisione. per MT4: https://www.mql5.com/en/market/product/193245 Informazioni sul prezzo: Il prezzo attuale è promozionale ed è soggetto a modifiche con il rilascio di futuri aggiornamenti e nuove funzionalità. Offerta Bonus: Per ricevere GRATIS l'Auto-Trade Assistant EA per questo indicatore, invia un messa
La leggenda ritorna: Entry Points Pro 10. Il rilancio del leggendario indicatore che per 3 anni è rimasto nella Top-3 del MQL5 Market. Centinaia di recensioni entusiaste (589 su due versioni), migliaia di trader lo usano ogni giorno per operare, 31.000+ download della demo   MT4+MT5 . Ho letto ogni vostra recensione degli ultimi cinque anni — e invece di promesse ho inserito nella versione 10 le risposte. Dall'autore che opera sui mercati dal 1999 e tiene all'onestà, alla propria reputazione e a
Neuro Poseidon MT5
Daria Rezueva
4.75 (52)
Neuro Poseidon is a new indicator by Daria Rezueva. It combines precise trading signals with adaptive TP/SL levels - creating best possible trades as a result! Message me and get  Neuro Poseidon Assistant  as a gift to automize your trading process! What makes it stand out? 1. Proven profitability on all assets and timeframes 2. Only confirmed BUY and SELL signals present on the chart 3. Adaptive TP & SL levels generated by the software for each trade 4. Easy to understand - suitable for al
Adaptive Price Action Engine Acquista un indicatore, ricevi l'EA gratis Analisi Auto-Ottimizzata del Trend e dei Pattern Candlestick Multi-Timeframe I mercati cambiano continuamente e non tutti i pattern di Price Action hanno lo stesso valore in ogni condizione di mercato. Adaptive Price Action Engine è progettato per adattarsi alle condizioni di mercato in continua evoluzione, combinando struttura del trend, analisi Multi-Timeframe, pattern Candlestick e ottimizzazione statistica in un unico fr
M1 Sniper MT5
Oleg Rodin
5 (7)
M1 SNIPER   è un sistema di indicatori di trading facile da usare. Si tratta di un indicatore a freccia progettato per l'intervallo temporale M1. L'indicatore può essere utilizzato come sistema autonomo per lo scalping sull'intervallo temporale M1 e come parte del tuo sistema di trading esistente. Sebbene questo sistema di trading sia stato progettato specificamente per il trading sull'intervallo temporale M1, può comunque essere utilizzato anche con altri intervalli temporali. Inizialmente ho p
Gann Made Easy è un sistema di trading Forex professionale e facile da usare che si basa sui migliori principi del trading utilizzando la teoria di mr. WD Gann. L'indicatore fornisce segnali ACQUISTA e VENDI accurati, inclusi i livelli di Stop Loss e Take Profit. Puoi fare trading anche in movimento utilizzando le notifiche PUSH. CONTATTAMI DOPO L'ACQUISTO PER RICEVERE GRATUITAMENTE LE ISTRUZIONI DI TRADING E OTTIMI INDICATORI EXTRA! Probabilmente hai già sentito parlare molte volte dei metodi d
Auto Optimized SpeedAngle è un sistema di vettorizzazione del momento di livello istituzionale che elimina l'overfitting ( curve-fitting ) attraverso l'ottimizzazione continua Walk-Forward (WFO). Invece di affidarsi a input statici che si degradano quando i regimi di mercato cambiano, l'indicatore recalibra dinamicamente i suoi parametri utilizzando la validazione Out-of-Sample (OOS), assicurando che i segnali visualizzati rappresentino reali vantaggi statistici anziché anomalie storiche. Quadro
ARIPoint
Temirlan Kdyrkhan
1 (4)
ARIPoint is a powerful trading companion designed to generate high-probability entry signals with dynamic TP/SL/DP levels based on volatility. Built-in performance tracking shows win/loss stats, PP1/PP2 hits, and success rates all updated live. Key Features: Buy/Sell signals with adaptive volatility bands Real-time TP/SL/DP levels based on ATR Built-in MA Filter with optional ATR/StdDev volatility Performance stats panel (Success, Profit/Loss, PP1/PP2) Alerts via popup, sound, push, or email Cu
Scalper Vault   è un sistema di scalping professionale che ti fornisce tutto il necessario per scalping di successo. Questo indicatore è un sistema di trading completo che può essere utilizzato dai trader di forex e opzioni binarie. L'intervallo di tempo consigliato è M5. Il sistema fornisce segnali di freccia accurati nella direzione della tendenza. Ti fornisce anche i segnali più alti e più bassi e i livelli di mercato di Gann. Gli indicatori forniscono tutti i tipi di avvisi, comprese le noti
Ciao a tutti i trader! Molti investitori individuali utilizzano script web lenti. Un approccio sistematico è essenziale per un trading redditizio. L'indicatore Astro AI non è semplicemente una visualizzazione su un grafico. Si tratta di una sofisticata rete neurale composta da due agenti che operano direttamente all'interno del terminale. Dettagli tecnici del sistema: 1. Agente 1: Analista (Rete neurale grafica – GNN) Il mercato non è costituito da singole barre di prezzo, ma da una rete di
Divergence Bomber
Ihor Otkydach
4.89 (94)
Ogni acquirente dell’indicatore riceverà inoltre gratuitamente: L’utilità esclusiva “Bomber Utility”, che gestisce automaticamente ogni operazione, imposta i livelli di Stop Loss e Take Profit e chiude le posizioni secondo le regole della strategia I file di configurazione (set file) per adattare l’indicatore a diversi asset I set file per configurare il Bomber Utility in tre modalità: “Rischio Minimo”, “Rischio Bilanciato” e “Strategia di Attesa” Una guida video passo-passo per installare, con
PainX GainX Blue Spike Fusion AI Advanced Synthetic Index Spike Detection Indicator for MetaTrader 5 Discover potential spike setups with a clear, organized, and professional trading interface. PainX GainX Blue Spike Fusion AI is a specialized indicator designed for traders who monitor synthetic indices and want a structured way to observe potential price spike opportunities. The indicator combines signal monitoring, market-condition analysis, visual alerts, and event tracking in one convenient
Volatility Master for MetaTrader is a real-time dashboard tool that scans up to  50 symbols  to identify high-volatility , trending markets instantly. With bullish/bearish signals, customizable alerts, and a user-friendly interface, it helps you avoid range-bound conditions and focus on high-probability trades. Clarity leads to confidence. Trade confidently and protect your capital effectively with this powerful dashboard. We don't offer free or bonus indicators in exchange of reviews from you.
Quantum TrendPulse
Bogdan Ion Puscasu
5 (26)
Ecco   Quantum TrendPulse   , lo strumento di trading definitivo che combina la potenza di   SuperTrend   ,   RSI   e   Stocastico   in un unico indicatore completo per massimizzare il tuo potenziale di trading. Progettato per i trader che cercano precisione ed efficienza, questo indicatore ti aiuta a identificare con sicurezza le tendenze di mercato, i cambiamenti di momentum e i punti di entrata e uscita ottimali. Caratteristiche principali: Integrazione SuperTrend:   segui facilmente l'andame


Presentazione       Quantum Breakout PRO   , l'innovativo indicatore MQL5 che sta trasformando il modo in cui scambi le zone di breakout! Sviluppato da un team di trader esperti con un'esperienza di trading di oltre 13 anni,       Quantum Breakout PRO       è progettato per spingere il tuo viaggio di trading a nuovi livelli con la sua strategia innovativa e dinamica della zona di breakout. Quantum Breakout Indicator ti fornirà frecce di segnalazione sulle zone di breakout con 5 zone target di
PZ Divergence Trading MT5
PZ TRADING SLU
3.71 (7)
Unlock hidden profits: accurate divergence trading for all markets Tricky to find and scarce in frequency, divergences are one of the most reliable trading scenarios. This indicator finds and scans for regular and hidden divergences automatically using your favourite oscillator. [ Installation Guide | Update Guide | Troubleshooting | FAQ | All Products  ] Easy to trade Finds regular and hidden divergences Supports many well known oscillators Implements trading signals based on breakouts Displays
Gartley Hunter Multi
Siarhei Vashchylka
5 (12)
Gartley Hunter Multi - An indicator for searching for harmonic patterns simultaneously on dozens of trading instruments and on all possible timeframes. Manual (Be sure to read before purchasing) | Version for MT4 Advantages 1. Patterns: Gartley, Butterfly, Shark, Crab. Bat, Alternate Bat, Deep Crab, Cypher 2. Simultaneous search for patterns on dozens of trading instruments and on all possible timeframes 3. Search for patterns of all possible sizes. From the smallest to the largest 4. All fou
Quantum Direction è un indicatore professionale di trend following progettato per identificare la direzione del mercato, rilevare i cambiamenti iniziali del trend e fornire segnali filtrati di ingresso e uscita. Questo indicatore include gratuitamente Quantum Trade Assistant , uno strumento professionale per la gestione delle operazioni disponibile sul MQL5 Market. Può collegarsi direttamente a Quantum Direction e aprire automaticamente le operazioni quando appare un segnale valido, oppure chiud
M1 Quantum MT5
Hamed Dehgani
4.2 (10)
Segnali di Trading Live con M1 Quantum: Segnale   (Operazione eseguita automaticamente dal Quantum Trade Assistant , incluso gratuitamente con questo prodotto.) Ultime notizie: La versione 1.64 è stata rilasciata. Ora tutte le operazioni hanno uno Stop Loss posizionato dietro le relative zone di Supporto/Resistenza. Anche la funzione Smart Close è stata migliorata per aumentare le prestazioni dell'EA in questa versione. Dal 9 agosto, il segnale live è in esecuzione sulla versione 1.64. Piano pr
La soluzione migliore per ogni principiante o trader esperto! Questo indicatore è uno strumento di trading unico, di alta qualità e conveniente perché abbiamo incorporato una serie di caratteristiche proprietarie e una nuova formula. Con un solo grafico è possibile leggere la forza delle valute per 28 coppie Forex! Immaginate come migliorerà il vostro trading perché sarete in grado di individuare l'esatto punto di innesco di una nuova tendenza o di un'opportunità di scalping? Manuale d'uso:  
La soluzione migliore per ogni principiante o trader esperto! Questo indicatore è uno strumento di trading unico, di alta qualità e conveniente perché abbiamo incorporato una serie di caratteristiche proprietarie e una formula segreta. Con un solo grafico fornisce avvisi per tutte le 28 coppie di valute. Immaginate come migliorerà il vostro trading perché sarete in grado di individuare l'esatto punto di innesco di una nuova tendenza o opportunità di scalping! Costruito su nuovi algoritmi sott
Trend Lines PRO MT5
Roman Podpora
5 (1)
LINEE DI TENDENZA PRO       Aiuta a capire dove il mercato sta realmente cambiando direzione. L'indicatore mostra reali inversioni di tendenza e punti in cui i principali attori rientrano. Vedi  Linee BOS   Cambiamenti di tendenza e livelli chiave su timeframe più ampi, senza impostazioni complesse o rumore inutile. I segnali non vengono ridisegnati e rimangono sul grafico dopo la chiusura della barra. VERSIONE MT 4     -      Svela il suo massimo potenziale se abbinato all'indicatore   RFI LEVE
CRT Pro is a complete Candle Range Theory toolkit for MetaTrader 5. It finds the CRT model on up to three timeframes and adds the tools needed to read it: higher-timeframe candles, structure shifts, fair value gaps, liquidity sweeps, a bias table and SSMT divergence. Every module can be switched on or off. 1. CRT Model A CRT model is built from two candles of the chosen CRT timeframe. C1 is the range candle. C2 is the sweep candle: it takes the high or the low of C1 and closes back inside the
Currency Strength Wizard   è un indicatore molto potente che ti fornisce una soluzione all-in-one per un trading di successo. L'indicatore calcola la potenza di questa o quella coppia forex utilizzando i dati di tutte le valute su più intervalli di tempo. Questi dati sono rappresentati in una forma di indice di valuta facile da usare e linee elettriche di valuta che puoi utilizzare per vedere il potere di questa o quella valuta. Tutto ciò di cui hai bisogno è collegare l'indicatore al grafico ch
ICT PO3 (Power of 3) AMD Protocol Framework Indicator True Time & Structure Integration   |  Non-Repainting | Real-Time  | Multi-Asset  | MT4 Version Available Full Setup Guide & Strategy Playbook: https://www.mql5.com/en/blogs/post/768683 The ICT Power of Three (PO3): The Complete Guide to Accumulation, Manipulation, and Distribution https://www.mql5.com/en/blogs/post/771729 MT4 Version: https://www.mql5.com/en/market/product/171742 Indicator Overview The ICT PO3 AMD Protocol Framework i
RelicusRoad Pro MT5
Relicus LLC
4.96 (25)
Basta andare a intuito nei tuoi trade. Sai quando entrare, dove uscire e da che parte va il mercato, tutto su un solo grafico. RelicusRoad Pro riunisce quasi venti strumenti in un unico indicatore, e attivi quelli che si adattano al tuo modo di operare. Ingressi chiari. Uscite chiare. Un piano su ogni grafico. Ti suona familiare? Compri, e un minuto dopo il prezzo ti va contro. Chiudi troppo presto, poi guardi il movimento proseguire senza di te. Cinque indicatori sul grafico, cinque risposte di
Bill Williams Advanced
Siarhei Vashchylka
5 (11)
Bill Williams Advanced is designed for automatic chart analysis using Bill Williams' "Profitunity" system. The indicator analyzes four timeframes at once. Manual (Be sure to read before purchasing) Advantages 1. Analyzes the chart using Bill Williams' "Profitunity" system. Signals are displayed in a table in the corner of the screen and on the price chart. 2. Finds all known AO and AC signals, as well as zone signals. Equipped with a trend filter based on the Alligator. 3. Finds "Divergence Bar
Advanced Supply Demand MT5
Bernhard Schweigert
4.53 (15)
La migliore soluzione per qualsiasi principiante o trader esperto! Questo indicatore è uno strumento di trading unico, di alta qualità e conveniente perché abbiamo incorporato una serie di funzionalità proprietarie e una nuova formula. Con questo aggiornamento, sarai in grado di mostrare fusi orari doppi. Non solo potrai mostrare una TF più alta, ma anche entrambe, la TF del grafico, PIÙ la TF più alta: SHOWING NESTED ZONES. Tutti i trader di domanda di offerta lo adoreranno. :) Informazioni imp
Boba Analysis Suite Boba Analysis Suite è un indicatore di analisi per MetaTrader 5. Riunisce la struttura del mercato, le zone di prezzo rilevanti e il contesto generale del mercato in un’unica visualizzazione del grafico. Sviluppato sulla base dell’esperienza pratica come trader e formatore di trading, supporta un processo di analisi strutturato: valutare la direzione del mercato, individuare livelli importanti e analizzare congiuntamente più intervalli temporali. Analisi nel contesto del merc
Superhero
Ihor Otkydach
5 (3)
L'indicatore SUPERHERO è un sistema di trading multivaluta progettato secondo un approccio "all-inclusive". L'indicatore analizza autonomamente il mercato e fornisce segnali su quando aprire e chiudere le posizioni. Utilizza ordini Stop Loss e Take Profit. Il rapporto R:R è 1:1. Questo sistema è in grado di inviare notifiche push sul tuo smartphone, consentendoti di effettuare operazioni "in mobilità" senza dover rimanere incollato al PC. È perfetto per le società di trading proprietario. UN OMA
Filtro:
Nessuna recensione
Rispondi alla recensione