CVD Divergencies

CVD Divergencies — Cumulative Volume Delta with Automatic Divergence Detection

See what's really driving price — not just where it's going.

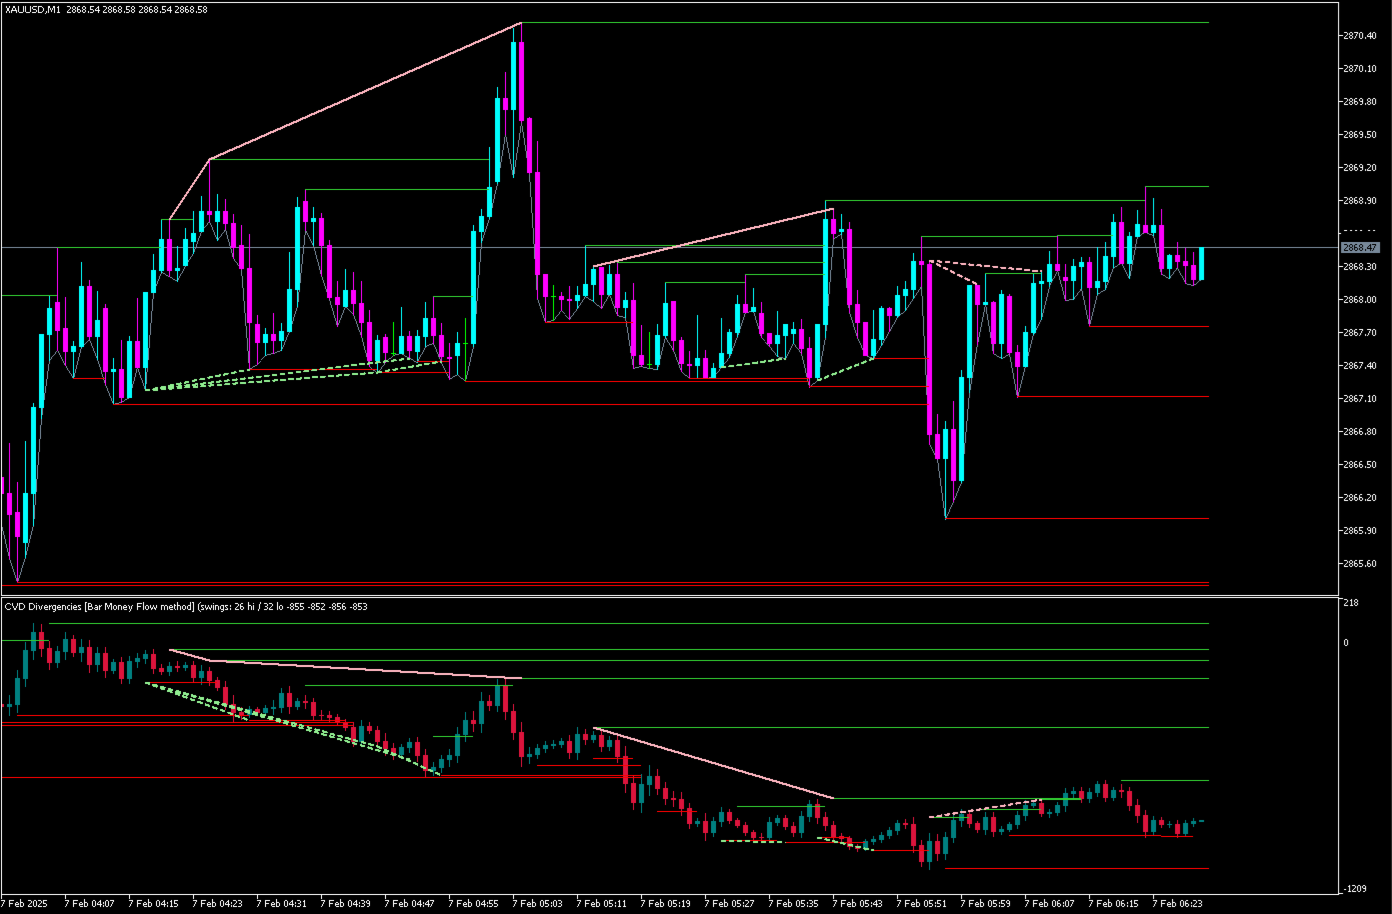
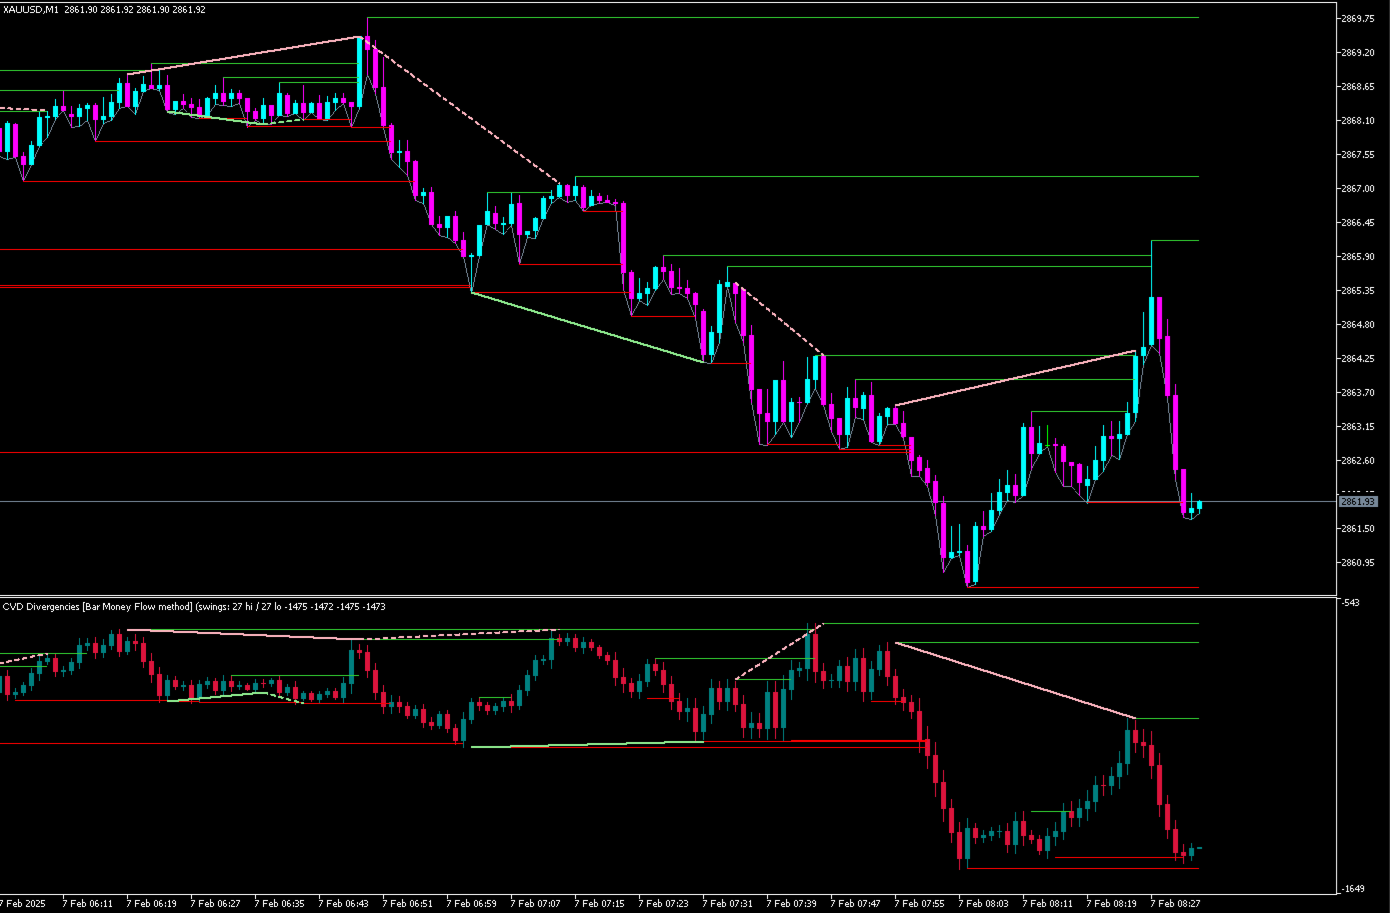
CVD Divergencies plots Cumulative Volume Delta (CVD) as its own candlestick chart and automatically detects and draws divergences between price and CVD in real time — on both the CVD window and directly on your price chart. No manual chart-watching required: when price and underlying order flow disagree, the indicator finds it, draws it, and alerts you.

Key Features

  • CVD Candles — full OHLC candlestick representation of cumulative volume delta, not just a line, so you can read the shape and momentum of order flow the same way you read price
  • 4 calculation methods — choose the approach that best fits your instrument and broker's data (see below)
  • Automatic Regular Divergence detection — classic reversal signal
  • Automatic Hidden Divergence detection — trend-continuation signal
  • Divergence lines on both windows — drawn on the CVD panel and directly on your price chart, so the confluence is immediately visible
  • Configurable swing high/low lines — on both the CVD window and price chart
  • Built-in alerts — popup and terminal push notification the moment a new divergence forms
  • Non-repainting — once a signal is confirmed it never changes or disappears; nothing is redrawn retroactively
  • Deep customization — colors, line styles, thickness, sensitivity, and detection width are all configurable

What is Cumulative Volume Delta?

CVD tracks the running balance of buying pressure versus selling pressure over time. Unlike ordinary volume, which just shows how much activity happened, CVD shows who's winning — buyers or sellers — and by how much. Plotted as its own chart, CVD often moves differently from price itself, and those moments of disagreement are exactly where this indicator focuses.

What Are Divergences?

Regular Divergence — reversal signal. Price makes a new extreme that CVD doesn't confirm, warning that the move's underlying momentum is weaker than price alone suggests.

  • Regular Bullish: price makes a lower low, but CVD makes a higher low
  • Regular Bearish: price makes a higher high, but CVD makes a lower high

Hidden Divergence — continuation signal. The mirror-image pattern, typically appearing during a pullback within an established trend, suggesting the trend is likely to continue.

  • Hidden Bullish: price makes a higher low, but CVD makes a lower low
  • Hidden Bearish: price makes a lower high, but CVD makes a higher high

Both are standard technical-analysis concepts — the same logic used for RSI or MACD divergence — applied here to order flow instead of a momentum oscillator.

Trading with Absorption & Exhaustion

Two of the most useful order-flow concepts you can read directly from these divergences:

Exhaustion happens when price makes a strong move but CVD fails to confirm it — the move is being driven by momentum rather than genuine sustained participation, and it's running low on fuel. This is exactly what Regular Divergence captures:

  • Price makes a new high, but CVD makes a lower high → buying pressure is exhausted, watch for a reversal down
  • Price makes a new low, but CVD makes a higher low → selling pressure is exhausted, watch for a reversal up

Absorption happens when one side is actively "catching" the other's aggressive pressure — building position while preventing price from moving much despite heavy underlying volume. When the absorbed side eventually gives out, price tends to move sharply in the absorber's direction. Watch for CVD to build strong directional momentum in the CVD window while price stays comparatively flat or struggles to keep pace at a key level, even when the price panel looks calm.

For best results, combine divergence signals with:

  • Support & Resistance — a divergence that forms right at a well-established S/R level carries far more weight than one in open space. Wait for price to actually interact with a level before acting on a signal.
  • Volume Profile — absorption at high-volume nodes (areas where the most historical volume has traded) often marks major turning points, since that's where large participants are most likely positioned.
  • VWAP — a divergence forming as price tests VWAP from either side is one of the highest-probability setups in order-flow trading; VWAP tends to act as both a magnet and a decision point for institutional flow.

This indicator doesn't need S/R, Volume Profile, or VWAP built in — simply add your existing indicators for those to the same chart, and use CVD Divergencies as the order-flow confirmation layer on top. A divergence alone is a useful signal; a divergence at a key level is a much stronger one.

Calculation Methods

Method Best for
Bar Money Flow (default) Chaikin-style volume weighting; works well across most instruments and brokers
Sierra Fixed, volume-scaled wick centered on the bar
Tick Rule Uses real tick-by-tick data for maximum precision (requires your broker to provide tick history)
OHLC Path Estimates the intrabar path from candle shape alone

Switch methods anytime from the settings — no need to reload your chart layout.

Recommended Settings

The indicator ships with default settings that have been tested extensively across live market conditions and give a reliable balance of accuracy, responsiveness, and clean charts. For most traders, the defaults are the best starting point — the settings below are there for anyone who wants to fine-tune sensitivity or appearance to their own style.

Settings Guide

CVD Calculation

  • Calculation method — how CVD is derived from price and volume. Bar Money Flow (default) gives the most reliable results across most brokers and instruments.
  • Bars to calculate — how much history the indicator processes on load. Higher values give more visible history at a small cost to load time.
  • Price source — which price feed to use for tick-based calculation (only relevant if using the Tick Rule method).

Swing Lines

  • Show on CVD window / Show on price chart — toggle the horizontal swing high/low lines on either panel independently.
  • Swing sensitivity — how many bars on each side are needed to confirm a swing point. Lower values find more (smaller) swings; higher values find fewer (larger) ones.
  • Bars to scan — how far back the indicator looks when searching for swing points.
  • Colors and thickness — visual styling for the swing lines.

Divergence Detection

  • Show regular / Show hidden — turn each divergence type on or off independently.
  • Wait for confirmation — when enabled, a swing point is only used once confirmed by a few bars afterward, avoiding false signals from price that hasn't settled yet. Recommended to leave on.
  • Minimum swing size — filters out small, noisy swings so only meaningful moves are considered for divergence.
  • Volatility window — how many recent bars are used to judge what counts as a "meaningful" swing, so the filter adapts to current market conditions rather than a single old, outsized move.
  • Minimum / Maximum width — how close together or far apart the two points of a divergence are allowed to be.
  • Line tolerance — how strictly the connecting line must avoid crossing through candles in between; a small tolerance allows for normal market noise.
  • Colors, line thickness, and line styles — visual styling, with regular and hidden divergences distinguishable by both color and line style.

Alerts

  • Enable alerts — master switch for popup/push notifications.
  • Alert on regular / Alert on hidden — choose which divergence types trigger a notification.

Display

  • Show status info — displays the active calculation method along with live swing and divergence counts directly in the indicator's name, for a quick at-a-glance check.

Who Is This For?

  • Day traders and scalpers looking for order-flow confirmation on entries
  • Swing traders identifying high-probability reversal or continuation zones
  • Anyone already using volume/order-flow concepts who wants it automated rather than eyeballed

Notes

Feel free to contact me for any questions, suggestions or issues.

CVD is calculated from your broker's available tick and volume data. Works on any symbol and any timeframe — Forex, indices, commodities, and crypto.

Trading involves substantial risk. This indicator is an analysis tool, not financial advice, and does not guarantee profitable results. Always use proper risk management and test thoroughly on a demo account before live trading.

Produtos recomendados
The VWAP indicator is our version of the popular Volume-Weighted Average Price indicator. The VWAP is the ratio between the value traded (price multiplied by the number of volume traded) and the total volume traded over a specific time period. As a result, it measures the average price of the instrument much better than the simple moving average. Although there are many ways to use the VWAP, most investors use it to calculate the daily average.  The indicator works in five modes: Moving  - In
The "MR Volume Profile 5" indicator is a charting tool that displays trading volume at different price levels rather than time intervals. A key concept in volume profile is the point of control (POC)—the price level with the highest volume traded during the session or time range. While tools like VWAP or OBV provide volume trends, the "MR Volume Profile 5" indicator offers granular detail about where the most market activity occurs at specific price levels. This makes it a more precise tool for
Heiken Ashi Stacked Pro is a chart overlay indicator that combines smooth Heiken Ashi visual trend candles, a real-time bar completion timer, and an on-hover crosshair HUD for instant price and wick-to-body ratio diagnostics. Marketplace Description Overview Heiken Ashi Stacked Pro upgrades standard Heiken Ashi candle visuals with an interactive HUD. Designed for trend followers and price action traders, it filters out market noise using colored candles while supplying precise candle metric read
VolumeDeltaBars
Stanislav Korotky
This indicator is a conventional analytical tool for tick volumes changes. It calculates tick volumes for buys and sells separately, and their delta on every bar, and displays volumes by price clusters (cells) within a specified bar (usually the latest one). The algorithm used internally is the same as in the indicator VolumeDeltaMT5 , but results are shown as cumulative volume delta bars (candlesticks). Analogous indicator for MetaTrader 4 exists - CumulativeDeltaBars . This is a limited substi
Time and Sales Tick
Pablo Filipe Soares De Almeida
O Time & Sales Tick Indicator é um indicador para MetaTrader 5 que exibe informações de ticks em tempo real. Ele mostra preço, volume e horário diretamente no gráfico, permitindo análise precisa da atividade do mercado. Funcionalidades Exibe dados de ticks (preço, volume e hora) em um painel sobre o gráfico. Agrupa os ticks em intervalos definidos pelo usuário, com cores diferentes (verde para alta, vermelho para baixa). O painel pode ser posicionado em qualquer canto do gráfico, com ajuste de t
CVD SmoothFlow Pro
Thalles Nascimento De Carvalho
CVD SmoothFlow Pro - Análise de Volume Ilimitada para Qualquer Ativo! O CVD SmoothFlow Pro é a solução definitiva para traders que buscam uma análise de volume precisa e ilimitada. Utilizando o cálculo de Cumulative Volume Delta (CVD) com filtragem avançada de ruídos, a Versão Pro oferece a flexibilidade e precisão necessárias para operar em qualquer ativo financeiro. O que o CVD SmoothFlow Pro oferece? Análise Clara : Filtra ruídos e destaca movimentos de volume significativos em qualquer
English Version Unlock the Power of Volume with Next-Generation Volume Profile This advanced Volume Profile indicator transforms your MetaTrader 5 chart into a powerful volume analysis tool. Unlike standard volume indicators that only show volume over time, this tool displays volume distribution across   price levels , allowing you to pinpoint exactly where the "big money" is trading. Why choose this indicator? Dynamic Price Bins:   Set your own precision (number of rows) to view volume clust

The Volume+ and VSA Signals indicator for MT5 is based on the Volume Spread Analysis (VSA) methodology to provide the signals. The signals are displayed at closing of bars on the main window or subwindow in the form of symbols. The symbols are not repainting.  The indicator produces a signal on an individual bar and this signal is not buy or sell signal. When a minor trend goes in the opposite direction of a major trend, there are sequences of major trend-following signals that give a higher pro

Volume Profile Delta
Juan Eduardo Verdala
Volume Profile Delta — Indicator for MetaTrader 5 Volume Profile Delta is an indicator that displays the difference between buying volume and selling volume recorded on each bar, represented as a histogram at the bottom of the chart. What this indicator does On each bar it calculates the difference between the volume associated with upward movements and the volume associated with downward movements. The result is shown as a bar in the lower histogram, making it possible to observe whether buying
FREE
Tick Volume Moving Averages
Kristmundur Roman Zakharii
Separated tick volume moving averages: This tool makes it is easier to track the volume behind the moves. It will separate tick volume into bullish and bearish volumes with two separate moving averages. Tracking volume versus price in an easy way is now accessable to any trader. It will put you on track with the market makers and those who move the price. Volume is not the only thing which moves the price but its an important factor behind it. Hence it has a predictive power. How tick volume w
Buy/Sell Volume Indicator with Pair Divergence for MT5  version "1.1" Description The Enhanced Buy/Sell Volume Indicator is a custom technical indicator designed for MetaTrader 5 (MT5) to analyze and visualize buy and sell tick volumes in a separate window. It provides traders with insights into market dynamics by highlighting volume dominance, balance, and divergence patterns. The indicator uses tick volume data to estimate buying and selling pressure, offering a detailed view of market sentime
Mirror Chart MT5
Andrej Hermann
5 (1)
The Mirror Chart MT5 is a overlay indicator specifically designed to project a second financial instrument directly onto the main chart window. This tool is invaluable for traders who rely on correlation analysis, as it visualizes the price movements of two different instruments in real time. Unlike traditional overlays, this indicator utilizes intelligent, dynamic centering and scaling logic. It continuously analyzes the visible price range in the current window for both symbols and calculates
FREE
LM Volume Profile MT5 LM Volume Profile MT5 displays the distribution of calculated volume across price levels directly on the MetaTrader 5 chart. The indicator divides the selected price range into configurable price rows and displays the volume distribution as a horizontal histogram. It also calculates the Point of Control, Value Area High, Value Area Low, average profile price, and optional VWAP reference. Four profile modes are available: - Visible Range - Fixed Range - Session - Daily
FREE
Você utiliza o volume na sua leitura do mercado? Certamente muitos traders usam, e não se imaginam operando sem ele. O indicador Color Histogram Volume Set permite que o usuário escolha o valor que ele considera interessante para monitorar. Ao ultrapassar este você terá a confirmação visual e se quiser terá também o alerta sonoro que é dado pelo indicador. Claro que existem outras maneiras de tentar encontrar um volume elevado, como avaliar se o v olume está acima da média, se é o maior volum
AVISO IMPORTANTE – LICENÇA E ATIVAÇÃO OBRIGATÓRIAS =================================================== Instruções de ativação: Após concluir sua compra, entre em contato conosco imediatamente para receber sua chave de licença, senha ou dados de ativação. Sem eles, o software não funcionará. Estamos aqui para garantir um processo de ativação tranquilo e ajudá-lo com qualquer dúvida. --- Volume Delta Profile V2 Enhanced ================================ Ferramenta Profissional de Análise
Mini Chart Indicators
Flavio Javier Jarabeck
The Metatrader 5 has a hidden jewel called Chart Object, mostly unknown to the common users and hidden in a sub-menu within the platform. Called Mini Chart, this object is a miniature instance of a big/normal chart that could be added/attached to any normal chart, this way the Mini Chart will be bound to the main Chart in a very minimalist way saving a precious amount of real state on your screen. If you don't know the Mini Chart, give it a try - see the video and screenshots below. This is a gr
Delta Profile Volume
Teresinha Moraes Correia
Descrição Técnica do Indicador – Delta Profile para MetaTrader 5 O Delta Profile é um indicador desenvolvido para o MetaTrader 5 com foco em análise detalhada do fluxo de volume dentro de um intervalo definido de candles. Ele organiza e exibe informações sobre o desequilíbrio de volumes positivos (associados a movimentos de alta) e negativos (associados a movimentos de baixa) em diferentes níveis de preço. O resultado é uma visão clara dos pontos do gráfico onde há maior concentração de negócios
UPD1 Profile Levels MT5
Vitaliy Kuznetsov
5 (4)
O indicador localiza os níveis de volume máximo e mínimo de preços (perfil do mercado) no histograma de trabalho para o número especificado de barras.   Perfil composto. A altura do histograma é totalmente automática e se adapta a qualquer instrumento e período de tempo. O algoritmo do autor é usado e não repete análogos conhecidos. A altura dos dois histogramas é aproximadamente igual à altura média da vela. Um alerta inteligente irá ajudá-lo a informar sobre o preço relativo ao nível de volume
Volume Candle Indicator
Pablo Filipe Soares De Almeida
Histograma de Volume Colorido para MetaTrader 5 Este indicador exibe o volume como um histograma em uma janela separada. As barras são coloridas conforme a direção do candle: verde para alta (fechamento > abertura) e vermelho para baixa (fechamento < abertura). Principais Recursos Fonte do volume: volume de ticks ou volume real (selecionável). Linha de média móvel opcional sobre o histograma de volume, ativada via input. Tipos de médias suportadas: SMA, EMA, SMMA, LWMA. Período da média configur
The Accumulation and Distribution indicator is a volume-based indicator that was essentially designed to measure underlying supply and demand. This is accomplished by trying to determine whether traders are actually accumulating (buying) or distributing (selling). This is accomplished by plotting a cumulative total of the money flow volume for each period. This indicator can reveal divergences between volume flow and actual price to primarily affirm a current trend or to anticipate a future reve
AVISO IMPORTANTE – LICENÇA E ATIVAÇÃO NECESSÁRIAS Instruções de Ativação: Ao concluir sua compra, entre em contato conosco imediatamente para receber sua chave de licença, senha ou detalhes de ativação. Sem esses itens, o software não funcionará. Estamos aqui para garantir um processo de ativação tranquilo e ajudá-lo com qualquer dúvida. Personalização Multilíngue Para melhorar sua experiência de negociação, oferecemos personalização completa do software em vários idiomas. Nossa equip
Here   our more valuable tools SMC Trend Trading   ,  Easy SMC Trading  ,  Institutional SMC Architect Volume Analysis Tools  ,  Volume flow Profile  ,  Market volume profile  , FVG with Volume  , Liquidity Heatmap Profile  ,  Volume Spread Analysis Boom: Take SELL signals only (price spikes up then crashes) Crash: Take BUY signals only (price drops then spikes up) SL goes beyond the line as labeled Interactive Market Watch Panel : A left-side sidebar showing real-time strength indicators (po
Symbol: EURUSD Timeframe: 30 minutes (M30) For other symbols or timeframes, adjust the settings to match the market. Volume Profile POC Breakout builds a volume profile from recent candles, finds the Point of Control (POC) and marks clean breakouts of that level. Each breakout is shown as a complete trade plan with entry, stop loss and three take profit levels, filtered by the higher timeframe trend and rated by a quality score. The indicator does not open trades. It is a visual and analysis to
The Super Arrow Indicator provides non-repainting buy and sell signals with exceptional accuracy. Key Features No repainting – confirmed signals remain fixed Clear visual arrows: green for buy, red for sell Real-time alerts via pop-up, sound, and optional email Clean chart view with no unnecessary clutter Works on all markets: Forex, gold, oil, indices, crypto Adjustable Parameters TimeFrame Default:   "current time frame" Function:   Sets the time frame for indicator calculation Options:   Can
Versão MT4: https://www.mql5.com/en/market/product/157433 Versão MT5: https://www.mql5.com/en/market/product/167286 O Volume Imbalance é uma ferramenta de visualização leve de Perfil de Volume + Desequilíbrio Delta, concebida para o ajudar a identificar zonas de preço de alta atividade, pressão direcional e áreas de preço "vazias" dentro de um intervalo de observação configurável. Ao contrário do perfil de volume clássico, que apenas mostra o volume total, este indicador divide cada nível de
O Volume Profile é uma das ferramentas analíticas mais poderosas usadas por traders profissionais e institucionais. Ao contrário dos indicadores de volume tradicionais, que mostram apenas quando as negociações ocorreram na parte inferior da sua tela, o Volume Profile mostra exatamente em quais níveis de preço essas negociações aconteceram. Isso oferece uma visão de raio-X clara da estrutura do mercado, permitindo que você veja exatamente onde o dinheiro inteligente (smart money) e as instituiçõe
Wapv Price and volume
Eduardo Da Costa Custodio Santos
O Indicador WAPV Price and Volume para MT5 faz parte do conjunto de ferramentas do (Wyckoff Academy Wave Market) e ( Wyckoff Academy Price and Volume). O Indicador WAPV Price and Volume para MT5 foi criado para facilitar a visualização da movimentação do volume  no gráfico de forma intuitiva. Com ele você pode observar os momentos de pico de volume e momentos em que o mercado não tem interesse profissional Identificar momentos que o Mercado esta se movimentando por inércia e não por moviment
BoxChart MT5
Evgeny Shevtsov
5 (7)
The market is unfair if only because 10% of participants manage 90% of funds. An ordinary trader has slim changes to stand against these "vultures". This problem can be solved. You just need to be among these 10%, learn to predict their intentions and move with them. Volume is the only preemptive factor that faultlessly works on any timeframe and symbol. First, the volume appears and is accumulated, and only then the price moves. The price moves from one volume to another. Areas of volume accumu
Volume Profile For MT5
Abdelkhabir Yassine Alaoui
Perfil de Volume VPVR para MT5 O Perfil de Volume VPVR é um indicador poderoso e de alto desempenho para MetaTrader 5, projetado para replicar o Perfil de Volume (Faixa Visível) avançado diretamente no seu gráfico. Ele fornece uma visão profunda da estrutura do mercado, visualizando onde a atividade de negociação está concentrada, ajudando os traders a identificar níveis de preço importantes com precisão. Este indicador analisa dinamicamente a distribuição do volume entre os níveis de preço e
WAPV Box Effort x Result
Eduardo Da Costa Custodio Santos
WA_PV_BOX_EFFORT X RESULT para MT5 O Indicador WAPV Box Effort x Result faz parte do grupo de Indicadores do Pacote (Wyckoff Academy Wave Market). O Indicador WAPV Box Effort x Result para MT5 te ajuda na leitura de preço e volume. Sua leitura consiste em auxiliar na identificação de effort x result em ondas criadas pelo gráfico. O Indicador WAPV Box Effort x Result para MT5 quando está com o Box verde significa que o volume está a favor da demanda e quando o box está vermelho  o volume está
Os compradores deste produto também adquirem
Trend Sniper X
Sarvarbek Abduvoxobov
4.9 (41)
Trend Sniper X é um indicador de acompanhamento de tendência para múltiplos tempos gráficos no MetaTrader 5 que ajuda os traders a identificar a direção da tendência e potenciais pontos de reversão com clareza e precisão. para MT4: https://www.mql5.com/en/market/product/193245 Informações sobre o preço: O preço atual é promocional e está sujeito a alterações à medida que novas atualizações e funcionalidades forem lançadas. Oferta Bônus: Para obter o Auto-Trade Assistant EA GRATUITO para este in
A lenda está de volta: Entry Points Pro 10. O relançamento do lendário indicador que se manteve por 3 anos no Top-3 do MQL5 Market. Centenas de avaliações entusiasmadas (589 nas duas versões), milhares de traders operam com ele todos os dias, 31.000+ downloads da versão demo   MT4+MT5 . Li cada avaliação de vocês ao longo de cinco anos — e, em vez de promessas, coloquei as respostas dentro da versão 10. Do autor que está no mercado desde 1999 e valoriza a honestidade, a própria reputação e os se
Neuro Poseidon MT5
Daria Rezueva
4.75 (52)
Neuro Poseidon is a new indicator by Daria Rezueva. It combines precise trading signals with adaptive TP/SL levels - creating best possible trades as a result! Message me and get  Neuro Poseidon Assistant  as a gift to automize your trading process! What makes it stand out? 1. Proven profitability on all assets and timeframes 2. Only confirmed BUY and SELL signals present on the chart 3. Adaptive TP & SL levels generated by the software for each trade 4. Easy to understand - suitable for al
Adaptive Price Action Engine Compre um indicador, ganhe o EA de graça Análise Auto-Otimizada de Tendências e Padrões de Candlestick em Múltiplos Timeframes Os mercados estão em constante mudança, e nem todos os padrões de Price Action têm o mesmo valor em todas as condições de mercado. O Adaptive Price Action Engine foi desenvolvido para se adaptar às mudanças nas condições do mercado, combinando estrutura de tendência, análise Multi-Timeframe, padrões de candlestick e otimização estatística em
Auto Optimized SpeedAngle é um sistema de vetorização de momentum de nível institucional que elimina o sobreajuste ( curve-fitting ) por meio da otimização contínua de avanço ( Walk-Forward Optimization , WFO). Em vez de depender de entradas estáticas que se degradam quando os regimes de mercado mudam, o indicador recalibra dinamicamente seus parâmetros utilizando validação fora de amostra ( Out-of-Sample , OOS), garantindo que os sinais exibidos representem vantagens estatísticas genuínas e não
M1 Sniper MT5
Oleg Rodin
5 (7)
O   M1 SNIPER   é um sistema indicador de negociação fácil de usar. É um indicador de seta projetado para o período M1. O indicador pode ser usado como um sistema independente para scalping no período M1 e pode ser usado como parte do seu sistema de negociação existente. Embora este sistema de negociação tenha sido projetado especificamente para negociação no M1, ele também pode ser usado em outros períodos. Originalmente, desenvolvi este método para negociar XAUUSD e BTCUSD. Mas considero-o úti
Gann Made Easy   é um sistema de negociação Forex profissional e fácil de usar, baseado nos melhores princípios de negociação usando a teoria do sr. W. D. Gann. O indicador fornece sinais precisos de COMPRA e VENDA, incluindo níveis de Stop Loss e Take Profit. Você pode negociar mesmo em movimento usando notificações PUSH. Entre em contato comigo após a compra para receber instruções de negociação e ótimos indicadores extras gratuitamente! Provavelmente você já ouviu muitas vezes sobre os método
ARIPoint
Temirlan Kdyrkhan
1 (4)
ARIPoint is a powerful trading companion designed to generate high-probability entry signals with dynamic TP/SL/DP levels based on volatility. Built-in performance tracking shows win/loss stats, PP1/PP2 hits, and success rates all updated live. Key Features: Buy/Sell signals with adaptive volatility bands Real-time TP/SL/DP levels based on ATR Built-in MA Filter with optional ATR/StdDev volatility Performance stats panel (Success, Profit/Loss, PP1/PP2) Alerts via popup, sound, push, or email Cu
Scalper Vault   é um sistema profissional de escalpelamento que fornece tudo o que você precisa para um escalpelamento bem-sucedido. Este indicador é um sistema de negociação completo que pode ser usado por comerciantes de forex e opções binárias. O período de tempo recomendado é M5. O sistema fornece sinais de seta precisos na direção da tendência. Ele também fornece sinais superiores e inferiores e níveis de mercado Gann. Os indicadores fornecem todos os tipos de alertas, incluindo notificaçõe
Olá, traders! A maioria dos traders de retalho depende de scripts web lentos. Para operar com verdadeira rentabilidade, é necessário um framework institucionalizado. O indicador Astro AI não é uma sobreposição gráfica padrão. Trata-se de uma rede neural compilada contendo dois agentes que são executados diretamente no seu terminal. Eis a tecnologia específica por trás do sistema: 1. Agente 1: Analista (Rede Neural Gráfica - GNN) Os mercados não são barras de preço isoladas; são redes de dad
Divergence Bomber
Ihor Otkydach
4.89 (94)
Cada comprador deste indicador recebe adicionalmente, e de forma gratuita: A ferramenta exclusiva "Bomber Utility", que acompanha automaticamente cada operação, define os níveis de Stop Loss e Take Profit e fecha operações de acordo com as regras da estratégia; Arquivos de configuração (set files) para ajustar o indicador em diferentes ativos; Set files para configurar o Bomber Utility nos modos: "Risco Mínimo", "Risco Balanceado" e "Estratégia de Espera"; Um vídeo tutorial passo a passo que a
Volatility Master for MetaTrader is a real-time dashboard tool that scans up to  50 symbols  to identify high-volatility , trending markets instantly. With bullish/bearish signals, customizable alerts, and a user-friendly interface, it helps you avoid range-bound conditions and focus on high-probability trades. Clarity leads to confidence. Trade confidently and protect your capital effectively with this powerful dashboard. We don't offer free or bonus indicators in exchange of reviews from you.
Quantum TrendPulse
Bogdan Ion Puscasu
5 (26)
Apresentando   Quantum TrendPulse   , a ferramenta de negociação definitiva que combina o poder do   SuperTrend   ,   RSI   e   Stochastic   em um indicador abrangente para maximizar seu potencial de negociação. Projetado para traders que buscam precisão e eficiência, este indicador ajuda você a identificar tendências de mercado, mudanças de momentum e pontos de entrada e saída ideais com confiança. Principais características: Integração SuperTrend:   siga facilmente a tendência predominante do
Apresentando       Quantum Breakout PRO   , o inovador Indicador MQL5 que está transformando a maneira como você negocia Breakout Zones! Desenvolvido por uma equipe de traders experientes com experiência comercial de mais de 13 anos,       Quantum Breakout PRO       foi projetado para impulsionar sua jornada comercial a novos patamares com sua estratégia de zona de fuga inovadora e dinâmica. O Quantum Breakout Indicator lhe dará setas de sinal em zonas de breakout com 5 zonas-alvo de lucro e su
PainX GainX Blue Spike Fusion AI Advanced Synthetic Index Spike Detection Indicator for MetaTrader 5 Discover potential spike setups with a clear, organized, and professional trading interface. PainX GainX Blue Spike Fusion AI is a specialized indicator designed for traders who monitor synthetic indices and want a structured way to observe potential price spike opportunities. The indicator combines signal monitoring, market-condition analysis, visual alerts, and event tracking in one convenient
Difícil de encontrar e com pouca frequência, as divergências são um dos cenários de negociação mais confiáveis. Este indicador localiza e verifica automaticamente divergências ocultas e regulares usando seu oscilador favorito. [ Guia de instalação | Guia de atualização | Solução de problemas | FAQ | Todos os produtos ] Fácil de trocar Encontra divergências regulares e ocultas Suporta muitos osciladores conhecidos Implementa sinais de negociação baseados em fugas Exibe níveis adequados de sto
RelicusRoad Pro MT5
Relicus LLC
4.96 (25)
Pare de chutar suas operações. Saiba quando entrar, onde sair e para que lado o mercado está pendendo, tudo em um único gráfico. O RelicusRoad Pro reúne quase vinte ferramentas em um só indicador, e você liga apenas as que combinam com o seu jeito de operar. Entradas claras. Saídas claras. Um plano em cada gráfico. Parece familiar? Você compra, e o preço vira contra você um minuto depois. Você fecha cedo demais e depois vê o movimento continuar sem você. Cinco indicadores no gráfico, cinco respo
Quantum Direction é um indicador profissional de acompanhamento de tendências, desenvolvido para identificar a direção do mercado, detectar mudanças iniciais de tendência e fornecer sinais filtrados de entrada e saída. Este indicador inclui o Quantum Trade Assistant gratuito, uma ferramenta profissional de gestão de operações disponível no MQL5 Market. Ele pode se conectar diretamente ao Quantum Direction e abrir operações automaticamente quando um sinal válido aparece ou fechar operações quando
OrderFlux – Indicador de Order Flow e Footprint para MetaTrader 5 OrderFlux é um indicador profissional de fluxo de ordens (Order Flow) e footprint para MetaTrader 5. Ele abre cada vela individual e revela o que está acontecendo no seu interior: o volume negociado em cada nível de preço, separado em compradores e vendedores agressivos. A partir destes dados de ticks, um gráfico Footprint completo é construído em tempo real, incluindo Delta, Imbalances, Volume Profile e Market Profile . Um gráfic
M1 Quantum MT5
Hamed Dehgani
4.2 (10)
Sinais de Trading ao Vivo usando o M1 Quantum: Sinal   (Operação executada automaticamente pelo Quantum Trade Assistant , incluído gratuitamente neste produto.) Últimas Notícias : A versão 1.64 foi lançada. Agora, todas as operações têm um Stop Loss colocado atrás das zonas relevantes de Suporte/Resistência. A função Smart Close também foi aprimorada para aumentar o desempenho do EA nesta versão. Desde 9 de agosto, o sinal ao vivo está sendo executado na versão 1.64. Plano de Preços: Preço Atua
CRT Pro is a complete Candle Range Theory toolkit for MetaTrader 5. It finds the CRT model on up to three timeframes and adds the tools needed to read it: higher-timeframe candles, structure shifts, fair value gaps, liquidity sweeps, a bias table and SSMT divergence. Every module can be switched on or off. 1. CRT Model A CRT model is built from two candles of the chosen CRT timeframe. C1 is the range candle. C2 is the sweep candle: it takes the high or the low of C1 and closes back inside the
Currency Strength Wizard   é um indicador muito poderoso que fornece uma solução completa para uma negociação bem-sucedida. O indicador calcula o poder deste ou daquele par forex usando os dados de todas as moedas em vários intervalos de tempo. Esses dados são representados em uma forma de índice de moeda fácil de usar e linhas de energia de moeda que você pode usar para ver o poder desta ou daquela moeda. Tudo o que você precisa é anexar o indicador ao gráfico que deseja negociar e o indicador
ICT PO3 (Power of 3) AMD Protocol Framework Indicator True Time & Structure Integration   |  Non-Repainting | Real-Time  | Multi-Asset  | MT4 Version Available Full Setup Guide & Strategy Playbook: https://www.mql5.com/en/blogs/post/768683 The ICT Power of Three (PO3): The Complete Guide to Accumulation, Manipulation, and Distribution https://www.mql5.com/en/blogs/post/771729 MT4 Version: https://www.mql5.com/en/market/product/171742 Indicator Overview The ICT PO3 AMD Protocol Framework i
Bill Williams Advanced
Siarhei Vashchylka
5 (11)
Bill Williams Advanced is designed for automatic chart analysis using Bill Williams' "Profitunity" system. The indicator analyzes four timeframes at once. Manual (Be sure to read before purchasing) Advantages 1. Analyzes the chart using Bill Williams' "Profitunity" system. Signals are displayed in a table in the corner of the screen and on the price chart. 2. Finds all known AO and AC signals, as well as zone signals. Equipped with a trend filter based on the Alligator. 3. Finds "Divergence Bar
Advanced Supply Demand MT5
Bernhard Schweigert
4.53 (15)
Atualmente com 33% de desconto! A melhor solução para qualquer Trader Novato ou especialista! Este indicador é uma ferramenta de negociação exclusiva, de alta qualidade e acessível porque incorporamos uma série de recursos proprietários e uma nova fórmula. Com esta atualização, você poderá mostrar fusos horários duplos. Você não só será capaz de mostrar um TF mais alto, mas também mostrar ambos, o TF do gráfico, MAIS o TF mais alto: MOSTRANDO ZONAS ANINHADAS. Todos os traders de Oferta e Demanda
Superhero
Ihor Otkydach
5 (3)
O indicador SUPERHERO é um sistema de negociação multimoeda concebido numa base «tudo incluído». O indicador analisa o mercado de forma independente e fornece sinais sobre quando abrir e encerrar posições. Utiliza ordens Stop Loss e Take Profit. O rácio R:R é de 1:1. Este sistema pode enviar notificações push para o seu smartphone, para que possa realizar transações «em qualquer lugar», sem precisar de estar preso a um computador. É perfeito para empresas de negociação por conta própria. UM BÓNU
CGE Trading Suite
Carl Gustav Johan Ekstrom
5 (2)
Institutional-Grade Analytics for MT5 The full analytical edge of a professional trading desk, built into your MT5 chart. Standard retail platforms lack the depth required for professional market analysis. The CGE Trading Suite bridges this gap, transforming MetaTrader 5 into a comprehensive workspace. By integrating 22 proprietary modules into a single, unified chart interface, the suite eliminates fragmented analysis. It provides definitive clarity across market structure, timing, momentum,
SkyHammer Signal Pro Indicador profissional de sinais de tendência sem repaint, com níveis Entry, SL e TP bloqueados SkyHammer Signal Pro é um indicador estruturado de tendência e momentum, desenvolvido para traders que procuram sinais claros, fixos e verificáveis. Funciona melhor em timeframes baixos, como M1 e M5 . O indicador não tenta prever topos ou fundos do mercado. Em vez disso, ele aguarda estrutura de mercado confirmada, direção de tendência, força de momentum, volatilidade saudável e
Manzano Footprint Order Flow
Patricia Manzano Gomez
5 (1)
MANZANO FOOTPRINT ORDER FLOW Footprint, Order Flow and Volume Analysis for MetaTrader 5 Manzano Footprint Order Flow is an analytical indicator for MetaTrader 5 that brings together Footprint charts, Bid x Ask, Delta, Cumulative Delta (CVD), Imbalances, Volume Profile, VWAP, Market Depth and Time & Sales in an interactive environment. It allows traders to examine activity within individual candles, identify volume concentrations, compare buying and selling pressure, and analyse how market partic
Azimuth Pro
Ottaviano De Cicco
5 (7)
Azimuth Pro V2: Estrutura Fractal Sintética e Entradas Confirmadas para MT5 Visão geral Azimuth Pro é um indicador de estrutura swing multinível da Merkava Labs . Quatro camadas de swing aninhadas, VWAP ancorado em swings, detecção de padrões ABC, filtragem estrutural de três timeframes e entradas confirmadas em barra fechada — um gráfico, um fluxo de trabalho dos micro-swings aos macro-ciclos. Este não é um produto de sinais cegos. É um fluxo de trabalho baseado em estrutura para traders que v
Filtro:
Sem comentários
Responder ao comentário