CVD Divergencies
- Indicateurs
- Version: 1.0
- Activations: 5

See what's really driving price — not just where it's going.
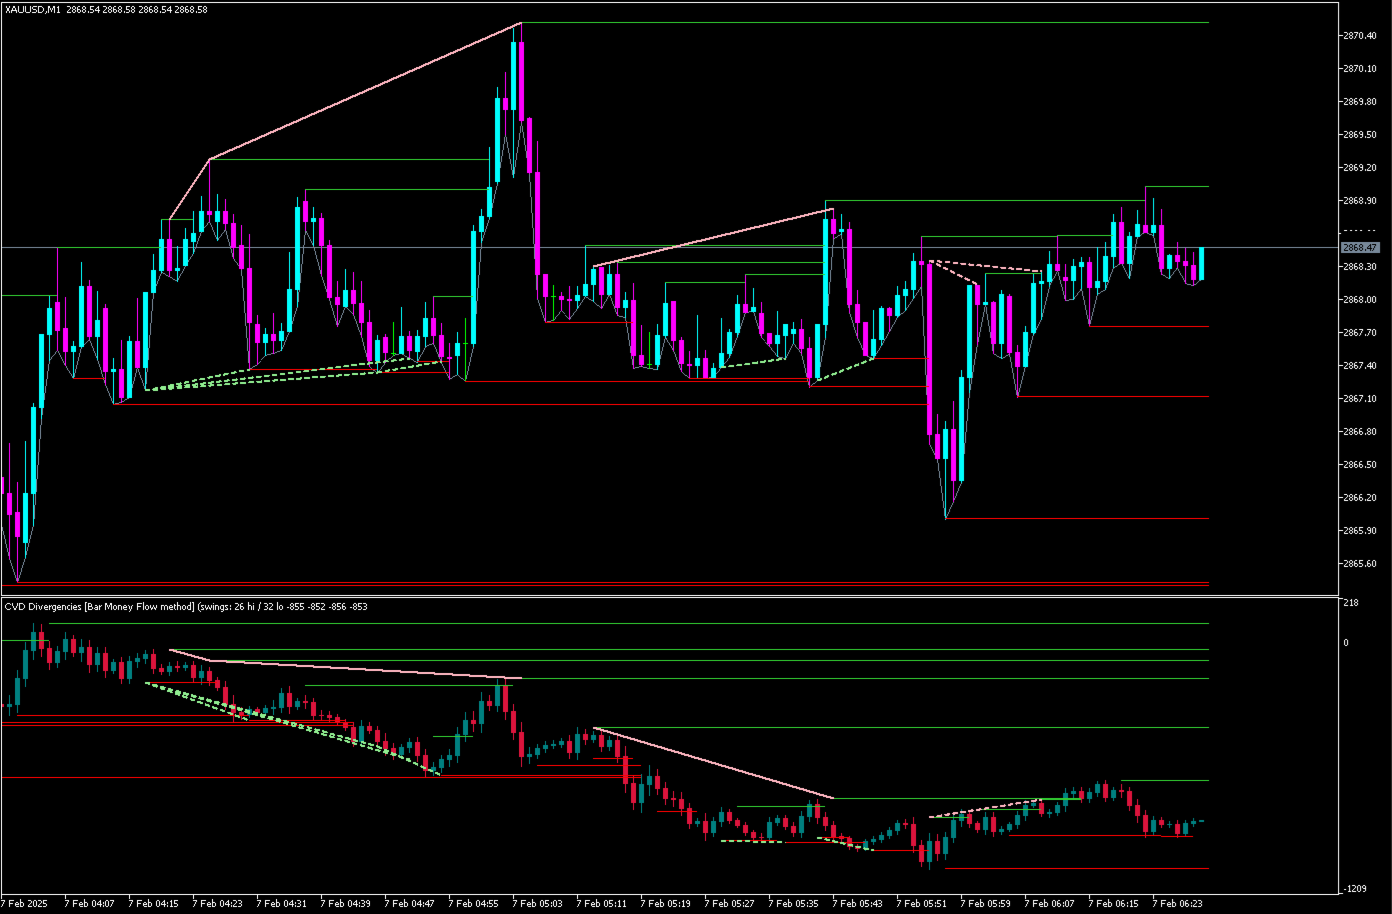
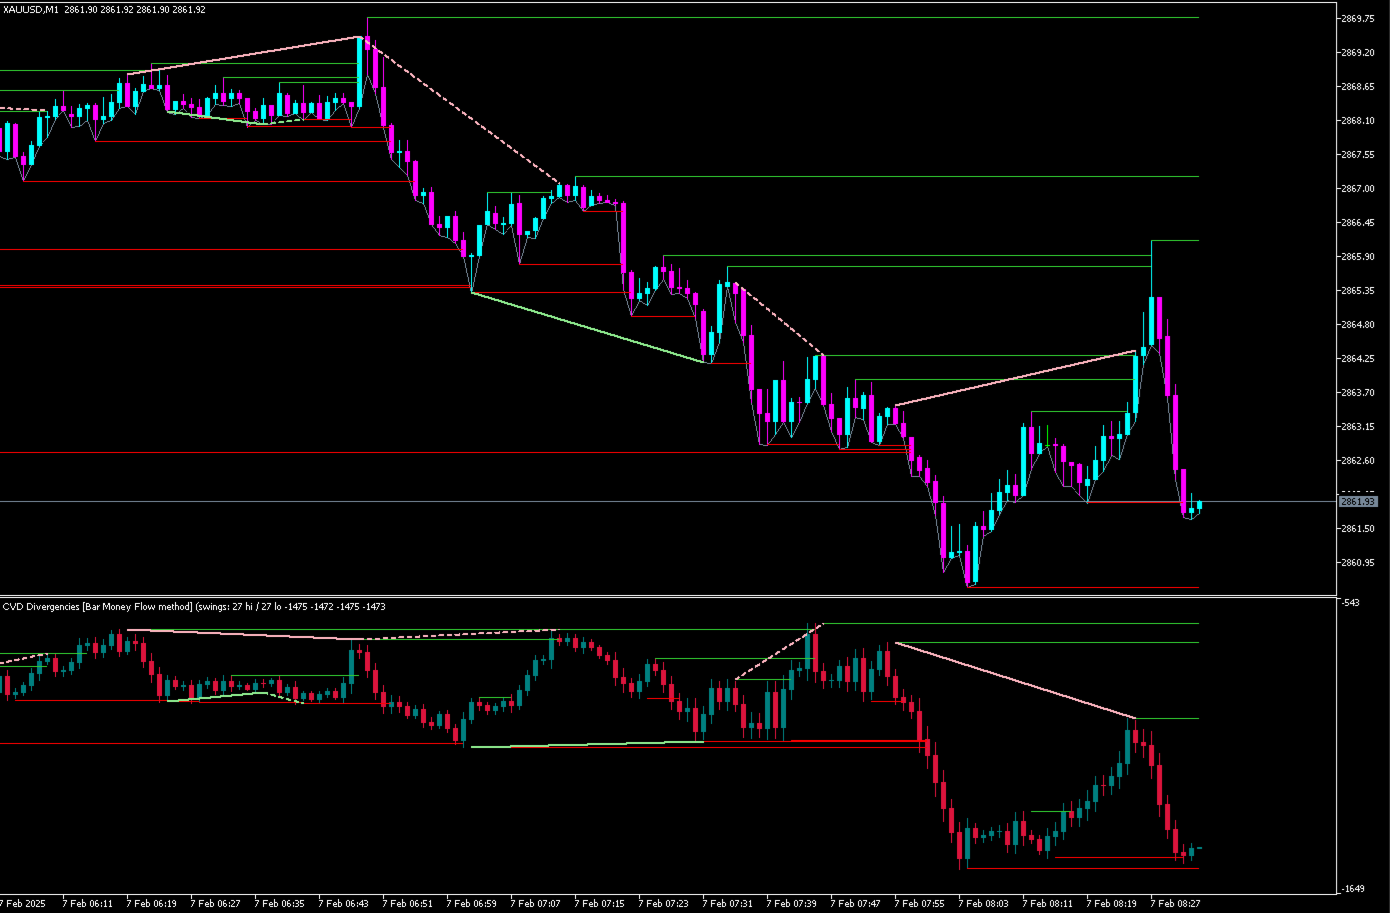
CVD Divergencies plots Cumulative Volume Delta (CVD) as its own candlestick chart and automatically detects and draws divergences between price and CVD in real time — on both the CVD window and directly on your price chart. No manual chart-watching required: when price and underlying order flow disagree, the indicator finds it, draws it, and alerts you.
Key Features
- CVD Candles — full OHLC candlestick representation of cumulative volume delta, not just a line, so you can read the shape and momentum of order flow the same way you read price
- 4 calculation methods — choose the approach that best fits your instrument and broker's data (see below)
- Automatic Regular Divergence detection — classic reversal signal
- Automatic Hidden Divergence detection — trend-continuation signal
- Divergence lines on both windows — drawn on the CVD panel and directly on your price chart, so the confluence is immediately visible
- Configurable swing high/low lines — on both the CVD window and price chart
- Built-in alerts — popup and terminal push notification the moment a new divergence forms
- Non-repainting — once a signal is confirmed it never changes or disappears; nothing is redrawn retroactively
- Deep customization — colors, line styles, thickness, sensitivity, and detection width are all configurable
What is Cumulative Volume Delta?
CVD tracks the running balance of buying pressure versus selling pressure over time. Unlike ordinary volume, which just shows how much activity happened, CVD shows who's winning — buyers or sellers — and by how much. Plotted as its own chart, CVD often moves differently from price itself, and those moments of disagreement are exactly where this indicator focuses.
What Are Divergences?
Regular Divergence — reversal signal. Price makes a new extreme that CVD doesn't confirm, warning that the move's underlying momentum is weaker than price alone suggests.
- Regular Bullish: price makes a lower low, but CVD makes a higher low
- Regular Bearish: price makes a higher high, but CVD makes a lower high
Hidden Divergence — continuation signal. The mirror-image pattern, typically appearing during a pullback within an established trend, suggesting the trend is likely to continue.
- Hidden Bullish: price makes a higher low, but CVD makes a lower low
- Hidden Bearish: price makes a lower high, but CVD makes a higher high
Both are standard technical-analysis concepts — the same logic used for RSI or MACD divergence — applied here to order flow instead of a momentum oscillator.
Trading with Absorption & Exhaustion
Two of the most useful order-flow concepts you can read directly from these divergences:
Exhaustion happens when price makes a strong move but CVD fails to confirm it — the move is being driven by momentum rather than genuine sustained participation, and it's running low on fuel. This is exactly what Regular Divergence captures:
- Price makes a new high, but CVD makes a lower high → buying pressure is exhausted, watch for a reversal down
- Price makes a new low, but CVD makes a higher low → selling pressure is exhausted, watch for a reversal up
Absorption happens when one side is actively "catching" the other's aggressive pressure — building position while preventing price from moving much despite heavy underlying volume. When the absorbed side eventually gives out, price tends to move sharply in the absorber's direction. Watch for CVD to build strong directional momentum in the CVD window while price stays comparatively flat or struggles to keep pace at a key level, even when the price panel looks calm.
For best results, combine divergence signals with:
- Support & Resistance — a divergence that forms right at a well-established S/R level carries far more weight than one in open space. Wait for price to actually interact with a level before acting on a signal.
- Volume Profile — absorption at high-volume nodes (areas where the most historical volume has traded) often marks major turning points, since that's where large participants are most likely positioned.
- VWAP — a divergence forming as price tests VWAP from either side is one of the highest-probability setups in order-flow trading; VWAP tends to act as both a magnet and a decision point for institutional flow.
This indicator doesn't need S/R, Volume Profile, or VWAP built in — simply add your existing indicators for those to the same chart, and use CVD Divergencies as the order-flow confirmation layer on top. A divergence alone is a useful signal; a divergence at a key level is a much stronger one.
Calculation Methods
| Method | Best for |
|---|---|
| Bar Money Flow (default) | Chaikin-style volume weighting; works well across most instruments and brokers |
| Sierra | Fixed, volume-scaled wick centered on the bar |
| Tick Rule | Uses real tick-by-tick data for maximum precision (requires your broker to provide tick history) |
| OHLC Path | Estimates the intrabar path from candle shape alone |
Switch methods anytime from the settings — no need to reload your chart layout.
Recommended Settings
The indicator ships with default settings that have been tested extensively across live market conditions and give a reliable balance of accuracy, responsiveness, and clean charts. For most traders, the defaults are the best starting point — the settings below are there for anyone who wants to fine-tune sensitivity or appearance to their own style.
Settings Guide
CVD Calculation
- Calculation method — how CVD is derived from price and volume. Bar Money Flow (default) gives the most reliable results across most brokers and instruments.
- Bars to calculate — how much history the indicator processes on load. Higher values give more visible history at a small cost to load time.
- Price source — which price feed to use for tick-based calculation (only relevant if using the Tick Rule method).
Swing Lines
- Show on CVD window / Show on price chart — toggle the horizontal swing high/low lines on either panel independently.
- Swing sensitivity — how many bars on each side are needed to confirm a swing point. Lower values find more (smaller) swings; higher values find fewer (larger) ones.
- Bars to scan — how far back the indicator looks when searching for swing points.
- Colors and thickness — visual styling for the swing lines.
Divergence Detection
- Show regular / Show hidden — turn each divergence type on or off independently.
- Wait for confirmation — when enabled, a swing point is only used once confirmed by a few bars afterward, avoiding false signals from price that hasn't settled yet. Recommended to leave on.
- Minimum swing size — filters out small, noisy swings so only meaningful moves are considered for divergence.
- Volatility window — how many recent bars are used to judge what counts as a "meaningful" swing, so the filter adapts to current market conditions rather than a single old, outsized move.
- Minimum / Maximum width — how close together or far apart the two points of a divergence are allowed to be.
- Line tolerance — how strictly the connecting line must avoid crossing through candles in between; a small tolerance allows for normal market noise.
- Colors, line thickness, and line styles — visual styling, with regular and hidden divergences distinguishable by both color and line style.
Alerts
- Enable alerts — master switch for popup/push notifications.
- Alert on regular / Alert on hidden — choose which divergence types trigger a notification.
Display
- Show status info — displays the active calculation method along with live swing and divergence counts directly in the indicator's name, for a quick at-a-glance check.
Who Is This For?
- Day traders and scalpers looking for order-flow confirmation on entries
- Swing traders identifying high-probability reversal or continuation zones
- Anyone already using volume/order-flow concepts who wants it automated rather than eyeballed
Notes
Feel free to contact me for any questions, suggestions or issues.
CVD is calculated from your broker's available tick and volume data. Works on any symbol and any timeframe — Forex, indices, commodities, and crypto.
Trading involves substantial risk. This indicator is an analysis tool, not financial advice, and does not guarantee profitable results. Always use proper risk management and test thoroughly on a demo account before live trading.