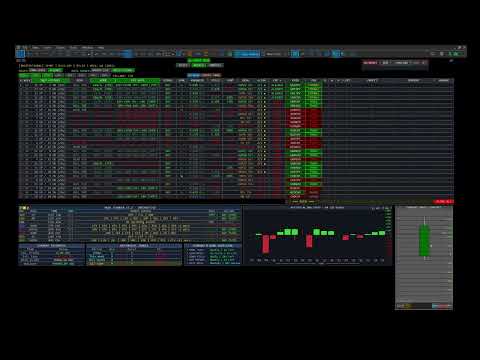
Statistical MT5 scanner dashboard for forex pairs
- Experts
-
Mark Nicole Olarte
 Why Work With Me?
I don't just write code — I build trading solutions that work. With years of hands-on experience in the MetaTrader ecosystem, I specialize in transforming complex trading strategies into fully automated systems that trade for you 24/5.
What I Do Best: - Version: 10.0
- Updated: 29 March 2026
- Activations: 5
Introduction In trading, the past doesn't predict the future. But patterns embedded in time reveal the rhythm of markets waiting to repeat. This guide introduces you to the Eight Pillars of Statistical Edge Trading—a comprehensive framework that transforms historical data into actionable trading intelligence.
At the heart of this system stands Historical Data. Unlike fleeting indicators or lagging signals, historical patterns reveal the seasonal heartbeat of financial markets—patterns that have repeated for decades, influenced by the unchanging cycles of human commerce, institutional behavior, and economic necessity.
Consider the farmer: they know when harvest season is because nature follows predictable cycles of sun and rainfall. Financial markets work the same way. Earnings reports, fiscal budgets, and portfolio rebalancing create seasonal patterns in price movements. This is the fundamental rhythm of money flowing through global markets.
HISTORICAL PATTERN (HIST) - THE MAIN STRATEGYDefault Weight: 30%
The Memory of Markets Historical Pattern Analysis answers one fundamental question: "In a specific week over the past 30 years, how madly did a pair move in one direction?" For example, if EURUSD went up 23 times and down 7 times in Week 15, that is a 77% historical bullish edge. This is an observation of repeating cycles.
Real Seasonal Supply and Demand Agricultural cycles provide the perfect analogy for market patterns:
- Peak Harvest: High supply and stable demand lead to lower prices.
- Off-Season: Low supply and steady demand lead to higher prices.
Financial markets exhibit identical patterns:
- USD in March (Tax Season): High demand for USD as funds are repatriated.
- USD in December (Year-End): High supply as corporations pay dividends and bonuses.
- USD in October (Fiscal Year End): Often bullish due to institutional buying for the new fiscal year.
Who Uses This Strategy?
- Pension Funds and Asset Managers: They must rebalance trillions of dollars at month-end, quarter-end, and year-end.
- Agricultural and Commodity Traders: They understand supply/demand cycles of planting and harvest seasons.
- Central Banks: They operate on fixed fiscal calendars (e.g., Japan in March, UK in April).
- Corporate Treasurers: They convert large amounts of foreign revenue at specific times for quarterly earnings.
- Z-Score Filtering: Measures statistical significance. A pattern with 30 years of data is more reliable than one with only 5 years. We target confidence levels of 90% to 99%.
- Recency Weighting: Newer data (e.g., 2024) is weighted more heavily than older data (e.g., 1994) to ensure the system adapts to modern market conditions.
- Conditional Seasonality: Analyzes patterns in sequences. If the current price action aligns with the historical sequence, the confidence score is boosted.
- Historical Seasonality (30%): The base foundation tracking 30 years of behavior.
- Performance Audit (20%): A rolling 6-month backtest to verify if the pattern is currently working.
- Institutional Data (20%): Tracking the Commitment of Traders (COT) to follow the "Smart Money."
- Consecutive Streaks (20%): Identifying years where a pair moved in the same direction consistently.
- Yield Differentials (15%): Analyzing interest rate spreads and the flow of capital.
- Sentiment Analysis (15%): Using retail sentiment as a contrarian filter.
- News Reaction (15%): Analyzing 10 years of historical reactions to major news events.
- Advanced Statistics (10%): Using standard deviation to filter out market noise.
The One Candle Philosophy Imagine removing the noise of messy indicators and asking: "What does 30 years of data say about this week?" When data, institutions, and yields align, you have a statistical edge.
ENGINEERED FOR CAPITAL PRESERVATIONTrading involves risk, and this Expert Advisor serves as a risk management system through:
- Smart Lot Division: Automatically calculates position sizes based on account balance.
- Hard Stop Losses: Every trade has a defined exit point.
- Statistical Filtering: The system stays flat (no trade) when the probability score is low.
Risk Warning: While this system provides high-probability setups, no system can guarantee profits. Always trade responsibly using provided tools.