Session Map Pro With Key Levels
- Indicators
-
Jason Smith
 The best algorithmic developers aren't just programmers - they're traders who code.
 - Version: 1.64
- Updated: 14 November 2025
- Activations: 5
Session Map Pro with Pip Tracker.Your analytical toolkit automatically plots the critical price levels from previous trading days and overlays visual session markers, giving you an instant "roadmap" of potential support and resistance.
This indicator transforms your chart into a strategic trading battlefield.
Detailed Line Reference Guide (For visual display m1-m5 works best but can be attached to any time frame) Default lookbackDays=5. "Set to 1 for today only and a less cluttered display"
1.Horizontal lines (n) Days)
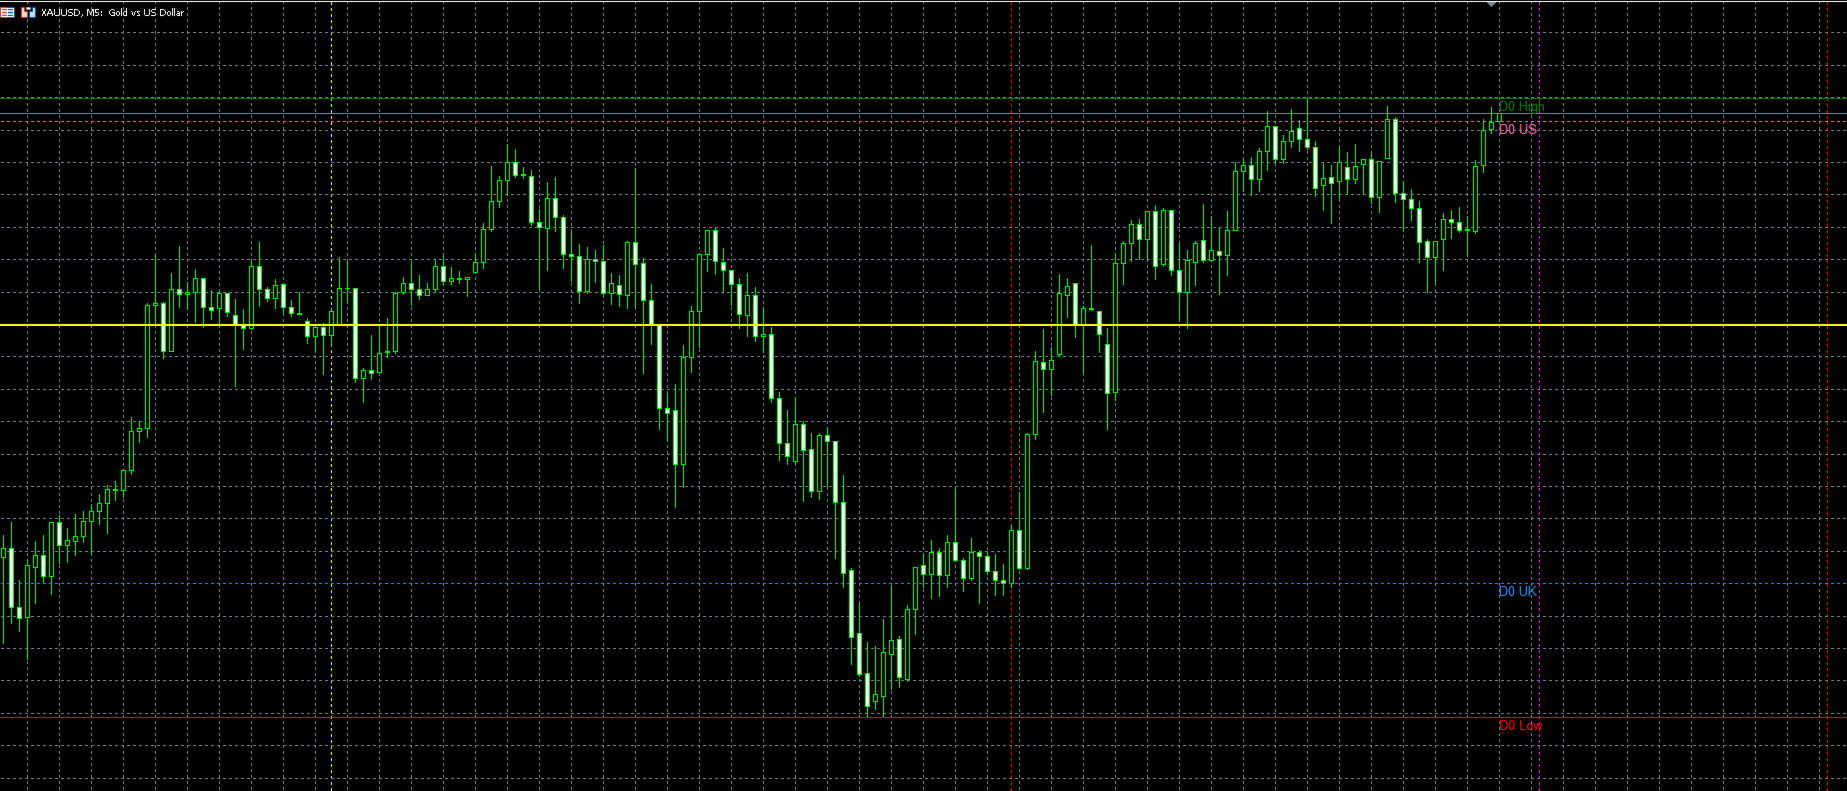
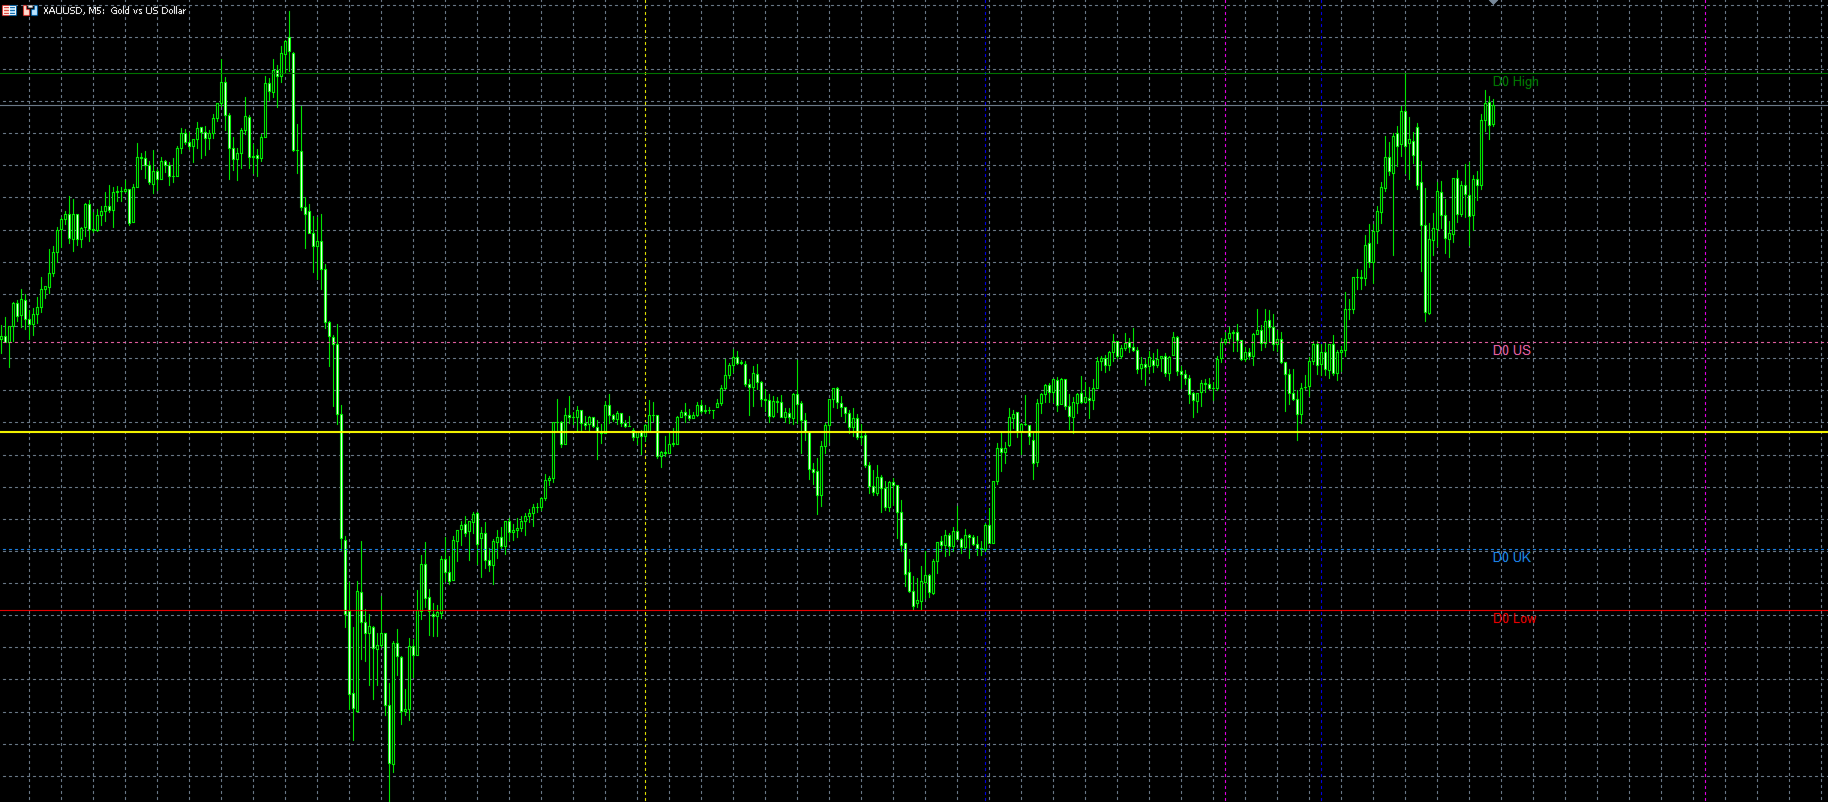
Solid GREEN Line (Daily High):
The highest price reached on a specific previous day.
Acts as a potential resistance zone. Price often reacts when approaching these levels from below. A break above can signal continued strength.
Solid RED Line (Daily Low):
The lowest price reached on a specific previous day.
Acts as a potential support zone. Price often bounces when approaching these levels from above. A break below can signal continued weakness.
Solid Yellow Line (Daily Open):
The opening price of a specific previous day.
A key psychological level and balance point. Price will often be drawn back to retest the open of previous days. It often acts as dynamic support/resistance.
Dotted DODGER BLUE Line (UK Session Open Price):
The exact price of the instrument at the moment the London financial session opened.
A critical level for European session traders. The market's behavior relative to this price often sets the tone for the London session. It's a common level for breakout or mean-reversion strategies.
Dotted MAGENTA Line (US Session Open Price):
The exact price of the instrument at the moment the New York financial session opened.
Perhaps the most important level for day traders. The direction price takes from the US open often defines the trend for the rest of the day. Watch for rejection or acceptance at this level.
2.Vertical session lines (On the Current Day) and passed days
YELLOW dot Line (Asian Session / Daily Start):
Marks the official start of the new trading day (00:00 Server Time).
This is your daily "reset" line. The price action to the right of this line is today's battle. It's the reference point for the day's range.
BLUE dot Lines (UK/London Session):
Mark the open (08:00) and close (17:00) of the London trading session.
London is the most liquid session. Expect increased volatility and strong directional moves between these lines.
The open often creates the first significant momentum of the day.
MAGENTA dot lines (US/New York Session):
Mark the open (13:00) and close (22:00) of the New York trading session.
The NY session often overlaps with London, creating the most volatile period of the day. The US open is a known catalyst for major breakouts and trend developments.
How to Trade with This Indicator
Identify Key Levels:
Before a session opens, look at the corresponding open price line from previous days.
These are your initial targets and reversal zones.
Watch for Confluences:
A trade has a higher probability when multiple levels align. For example, if today's price is approaching both a previous day's high (Green) AND the previous US open price (Pink), that is a very strong resistance cluster.
Understand Session Context:
Use the vertical lines to understand "who is driving the market." A move that starts at the UK open and continues through the US open shows strong, sustained momentum.
In essence, this indicator doesn't give you signals; it gives you context. It answers the questions: What are the important price levels from recent history? And where are we in the trading day?
This allows you to make informed, high-probability trading
Pip Tracker Pro with Enhanced Session Map Technology
Pip Tracker Pro provides professional daily movement tracking that eliminates guesswork from your trading decisions. This sophisticated tool delivers real-time measurement of price movements from the daily open, presenting exact pip distances alongside percentage calculations. The display uses intuitive color coding to instantly communicate whether you are trading above or below the opening price, giving you immediate visual context for every trading decision.
The integrated pip counter transforms how you perceive market movement, showing real-time distance from daily open in precise pip values. This immediate feedback allows traders to gauge momentum strength and potential reversal points with mathematical precision rather than visual estimation.
Beyond basic pip counting, the system offers comprehensive market analysis through multiple lenses. Daily range monitoring combines with ATR-based volatility context to help you understand how current movements compare to historical averages. Session-specific performance tracking separates London and New York activity, while optional weekly and monthly level integration provides broader market perspective for complete multi-timeframe analysis.
Advanced Level Calculation System
The newly enhanced 50% level system introduces sophisticated market structure analysis. HotPink 50% lines mark the critical midpoint between today's open price and both the daily high and low. These levels represent natural equilibrium points where price often finds temporary balance or significant momentum shifts.
Aqua 50% lines provide secondary level refinement, calculating the midpoint between the Hotpink 50% lines and the daily extremes. This creates a layered support and resistance structure that identifies potential reversal zones with greater precision than traditional single-level analysis.
The intelligent signal system automatically assesses market conditions to identify high-probability setups. It detects potential breakout opportunities when trading ranges contract, spots mean reversion possibilities during extended moves, and recognizes normal range-bound conditions. Custom alert thresholds at 30, 60, and 100 pip intervals ensure you never miss significant movements, with sound notifications and mobile integration keeping you informed regardless of your location.
Session Map integration brings comprehensive market session visualization to complete your analytical toolkit. Color-coded vertical lines mark session boundaries with blue for London, magenta for New York, and yellow for Asian sessions, creating immediate visual recognition of market transitions throughout the trading day.
The price level display employs a sophisticated color system where green represents daily highs, red indicates daily lows, and yellow shows opening prices. All lines feature professional styling with customizable widths and patterns, while historical analysis capabilities allow look back from 1 to 20 days with proper labeling and optional forward projection.
Together, these systems create a complete trading analysis environment that combines precise movement tracking with comprehensive session awareness. The integration provides institutional-grade analytical tools within a cohesive, professional interface designed for serious traders who demand clarity and precision in their market analysis.
Your feedback is welcome, and feature requests are encouraged.
Bug report
If you think you've found a bug in Session Map Pro.
Do not rush the process.
- Write a precise description of the context.
- Write a description of the error as precise as possible.
- Attach the logs of the expert tab for the corresponding date.
- Attach the logs from the log tab for the corresponding date