MultiPair RSI Dashboard
- Indicators
- Version: 1.0
- Activations: 5

📊 MultiPair RSI Dashboard
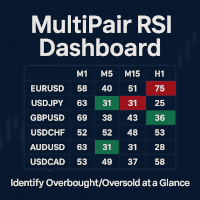
MultiPair RSI Dashboard is a powerful indicator that scans multiple symbols across multiple timeframes and displays live RSI values in a clear table format.
No more switching charts or timeframes – get the full RSI picture of the market at a glance!
✅ Key Features
-
Multi-Pair Monitoring – Track RSI levels for any list of currency pairs, indices, metals, or crypto.
-
Multi-Timeframe View – From M1 to D1, instantly see RSI conditions side by side.
-
Overbought/Oversold Alerts – Cells automatically highlight when RSI crosses your defined thresholds (e.g., >70 red, <30 green).
-
Blinking Alerts – Extreme RSI zones blink to grab your attention.
-
Fully Customizable – Set RSI period, OB/OS levels, refresh interval, table position, and font size.
🎯 Benefits
-
Quickly identify overbought/oversold conditions across the entire market.
-
Save time – no need to flip through multiple charts and timeframes.
-
Ideal for scalpers, day traders, and swing traders.
-
Works on any symbol your broker offers.
🚀 With MultiPair RSI Dashboard, the whole market’s RSI status is just one glance away.