TrendView Ultimate

📌 TrendView Ultimate — A Complete Trading System for Trend Clarity, Profit Insight, and Strategic Entries

TrendView Ultimate is a professional trading system designed to help traders identify trend direction, high-quality entries, and potential exits with clarity, confidence, and measurable performance.

More than just a trend indicator, it offers non-repainting signals, dynamic visual feedback, and a powerful statistics panel with real-time analytics, allowing traders to test, adapt, and validate strategies for any market condition.

✅ Core Features

  • 100% Non-repainting Signals — All signals and trendlines are drawn on closed candles only, once shown, they never disappear
  • Reliable Trend Detection — Displays bullish (green), bearish (red), and optional neutral (yellow) phases through clean, rule-based trendlines
  • Confirmed Trend Entry Signals — Shows arrows at trend reversals, confirmed on candle close, great for spotting early entries without repainting risk
  • Maximum Profit Lines — For each trend, the indicator calculates and displays the maximum profit that could have been achieved, based on your configured lot size, helping you evaluate asset behavior and trend quality
  • Advanced Entry & Exit Signals — Strategic signals within the active trend provide:
    • Additional entries (if you missed the initial one, prefer to scale in, or want a better-priced entry)
    • Early exits (before full trend reversal)
    • These signals are fully configurable for more frequency or more confirmation
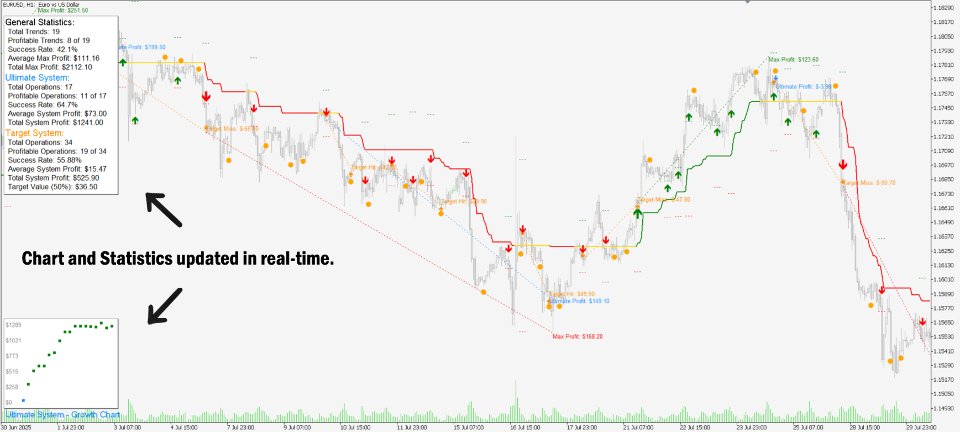
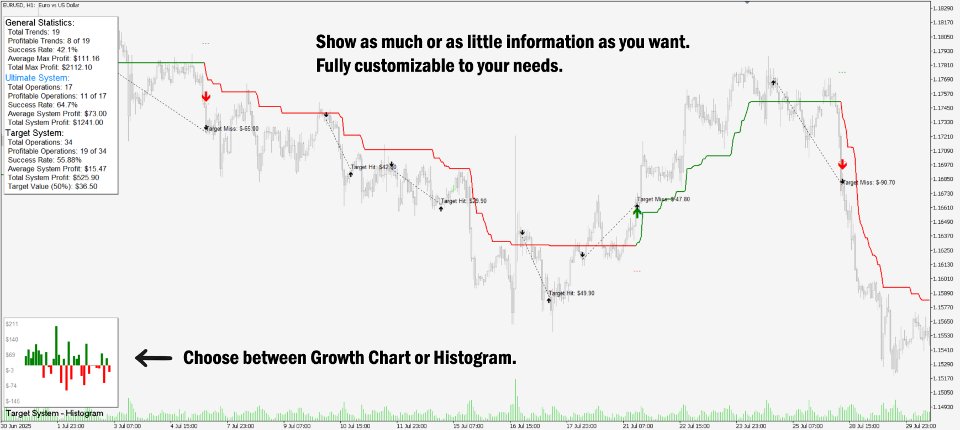
  • Built-in Statistics Panel — Gain insights into trend behavior and performance with real-time stats:
    • Number of bullish and bearish trends
    • Theoretical maximum profit for each trend
    • Win rate and average profit across historical signals

🧠 The Ultimate System — Your Trading Guide and Strategy Tester

A standout feature of TrendView Ultimate, the Ultimate System simulates complete trades (entries + exits) based on parameters you define and updates all statistics and trades in real time.

📊 How it works

  1. You define your entry preferences using the Guide Zone parameters to get better entry prices and avoid price disadvantages
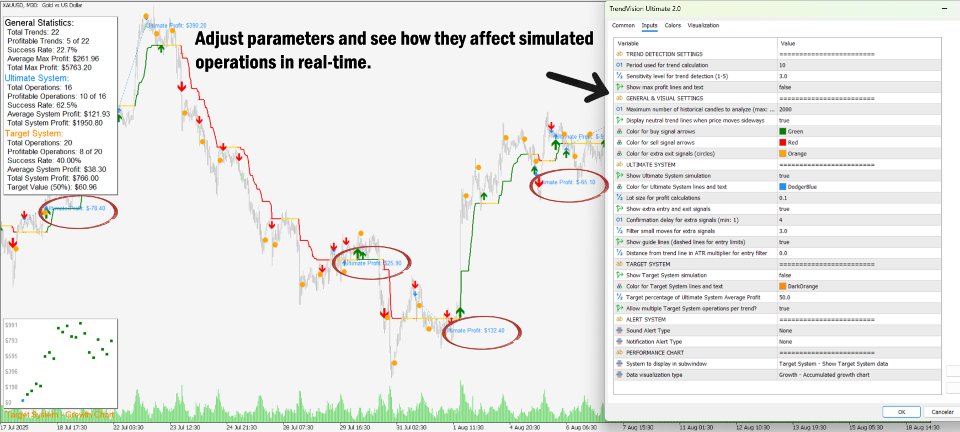
  2. Adjust filter and confirmation parameters - these affect both entry and exit signals, allowing you to fine-tune the system's responsiveness to market conditions
  3. The system filters and selects only those entry and exit signals that match your criteria
  4. For each trade, it evaluates all available signals on each trend and selects the most profitable ones according to your criteria
  5. The result is a complete visual simulation of all valid trades, showing:
    • Entry and exit prices
    • Total profit/loss
    • Win rate, average and max profit
    • Number of trades executed

Everything updates instantly as you adjust parameters, timeframe, or symbol, making it a powerful real-time strategy tester.

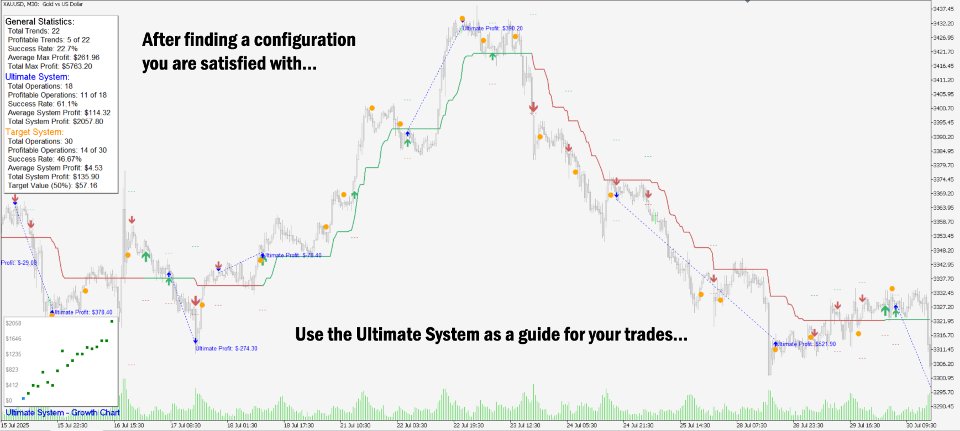
Once you've found a profitable configuration, you can:

  • Use Ultimate System signals as guidance for your trading decisions
  • Execute trades manually while following the system's optimized suggestions
  • Use it as confirmation for your personal strategy
  • Adapt the system's recommendations to your own risk tolerance and trading style

Think of it as a sophisticated trading advisor that gives you the best possible entry/exit suggestions, but you make the final decisions and execute the trades yourself.

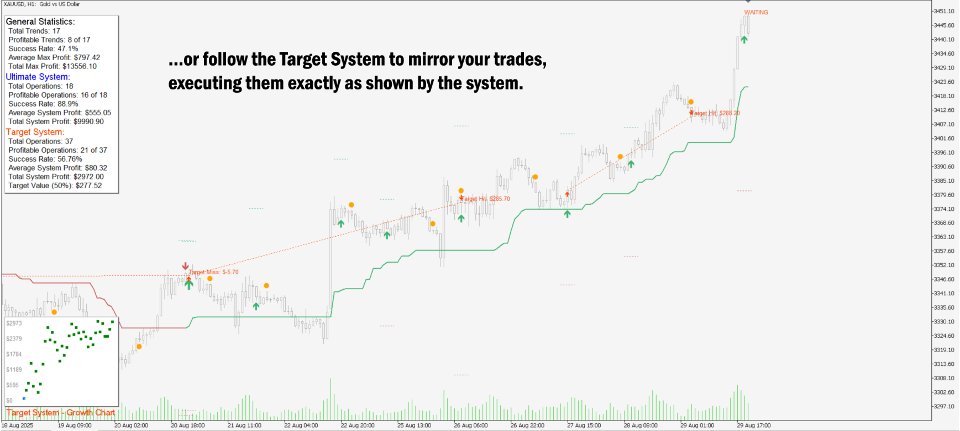
🎯 The Target System — Fixed Signal Trading System

Building upon the Ultimate System, the Target System provides predefined visual signals with fixed entry and exit points that never change after being drawn.

📊How Target System Works

  • Based on the same logic as the Ultimate System
  • Provides fixed visual entry and exit signals that remain constant
  • Entry Signals: One or more fixed entry points per trend (configurable by trader)
  • Exit Signals: Automatic exits when predefined profit targets are reached
  • Target Logic: Uses percentage-based profit targets relative to Ultimate System performance (configurable by trader)
  • Allows you to follow trades in complete synchronization without analysis decisions

Think of it as a reliable trading partner that provides fixed entry/exit signals, allowing you to follow a proven strategy without constant analysis

📌 Key Differences


Ultimate System (Your Guide) Target System (Fixed Signals)
Entries: One fixed entry per trend One or more fixed entries per trend
Exits: Flexible suggestions - you decide when to exit Fixed automatic exits when target is reached
Management: Optimized for SL adjustments and context analysis Automatic system - no analysis required
Flexibility: You control exit timing based on technical analysis Synchronized execution with system signals
Decisions: You decide when to exit analyzing profit, context and technical analysis System automatically decides when to exit

Choose Your Approach:

  • Ultimate System: For active traders who want guidance while maintaining control over exit timing and risk management
  • Target System: For traders who prefer to follow proven visual signals with automatic exit management based on profit targets

💡 Important Note

As TrendView Ultimate is an indicator, it does not execute trades automatically. It provides precise visual signals and alerts showing exact entry and exit points, but you must manually execute all trades in your trading platform.

EA Development: A prototype Expert Advisor (EA) for automatic trade execution is currently under development and will be available in the future.

⚙️ Parameters & Customization

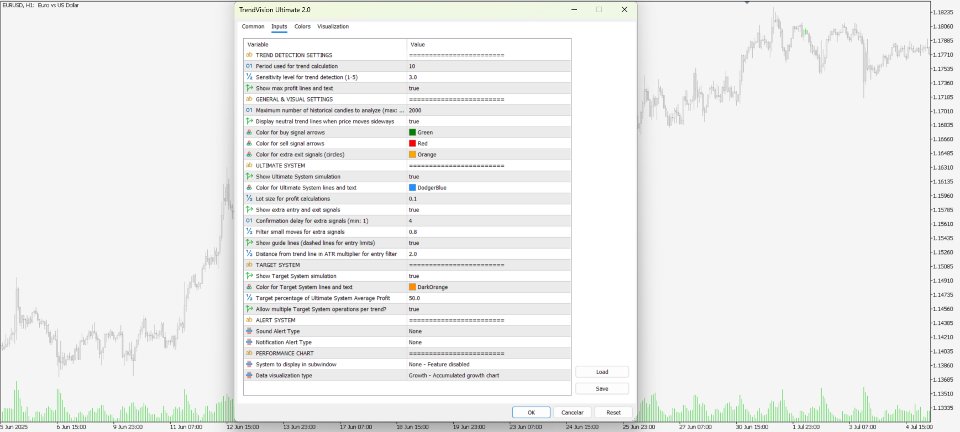
🧭 TREND DETECTION SETTINGS

  • Period used for trend calculation (default: 10)
  • Sensitivity level for trend detection (1–5, default: 3.0)
  • Show max profit lines and text (default: true) — displays maximum profit calculations for each trend

🎨 GENERAL & VISUAL SETTINGS

  • Maximum number of historical candles to analyze (default: 2000) — limits historical data processing for performance
  • Display neutral trend lines when price moves sideways (default: true) — shows yellow lines during consolidation phases
  • Color for buy signal arrows (default: Green) — customizable color for bullish entry signals
  • Color for sell signal arrows (default: Red) — customizable color for bearish entry signals
  • Color for advanced exit signals (circles) (default: Orange) — customizable color for strategic exit signals

🧪 ULTIMATE SYSTEM

  • Show Ultimate System simulation (default: true) — enables/disables the Ultimate System display
  • Color for Ultimate System lines and text (default: DodgerBlue) — customizable color for simulation elements
  • Lot size for profit calculations (default: 0.1) — used for profit/loss calculations in the simulation
  • Show advanced entry and exit signals (default: true) — enables strategic entry/exit opportunities within trends
  • Confirmation delay for advanced signals (default: 4, min: 1) — candles to wait before confirming signals
  • Filter small moves for advanced signals (default: 0.8) — minimum price movement required for signal generation
  • Show guide lines (default: true) — displays dashed lines showing entry price limits
  • Distance from trend line in ATR multiplier for entry filter (default: 2.0) — defines entry price range relative to trend line

"Confirmation delay" and "Filter small moves" parameters significantly affect the frequency and precision of advanced signals. Optimize based on asset and timeframe. Typical values: Delay: 2–6 | Filter: 0.2–4.0+

🎯 TARGET SYSTEM

  • Show Target System simulation (default: true) — enables/disables the Target System display
  • Color for Target System lines and text (default: DarkOrange) — customizable color for Target System elements
  • Target percentage of Ultimate System Average Profit (default: 50.0) — sets profit target as percentage of Ultimate System performance
  • Allow multiple Target System operations per trend (default: true) — enables multiple entries/exits within the same trend

🔔 ALERT SYSTEM

  • Sound Alert Type (default: None) — configurable sound notifications for signals
  • Notification Alert Type (default: None) — configurable push notifications

📊 PERFORMANCE CHART

  • System to display in subwindow (default: None - Feature disabled) — choose which system to visualize in performance charts: "None", "Ultimate System", or "Target System"
  • Data visualization type (default: Growth - Accumulated growth chart) — chart style for performance analysis: Growth or Histogram

🔄 Market Adaptation — Key to Long-Term Success

Market Reality: Markets are constantly evolving and changing behavior. No single parameter configuration will remain profitable indefinitely. This is fundamental market knowledge.

Why TrendView Ultimate Succeeds: The indicator's true strength lies in its adaptability. Successful traders continuously adjust parameters and make small tweaks as market conditions evolve, ensuring the system remains effective across different market phases.

Adaptation Strategy: Use the Ultimate System to test different parameter combinations, then gradually adjust settings based on current market behavior rather than sticking rigidly to past configurations.

👤 Who Is It For?

Ultimate System Users:

  • Active traders who want guidance while maintaining full control
  • Traders seeking to optimize their strategies with professional insights
  • Anyone looking to analyze, test, and validate trading approaches
  • Traders who want to combine visual clarity with real-time performance statistics
  • Professional traders who need a complete framework for strategy development

Target System Users:

  • Traders who prefer to follow a trading system without analysis paralysis
  • Anyone seeking consistent execution without emotional interference
  • Traders who want to mirror successful strategies manually
  • Those who prefer to learn from professional trading approaches
  • Traders who want to eliminate decision-making stress and focus on execution

---

TrendCore Labs — Professional Trading Tools for Modern Traders

Recommended products
RandomChoice
Aleksei Lesnikov
5 (1)
Expert capable of generating profit by opening positions randomly. Shows good results in long-term trading – on timeframes from H12. Features Fully automatic mode is available. Positions are opened randomly. Martingale is applied – if the previous position closed with a loss, the current one is opened with a volume that compensates for that loss. Parameters Mode – Expert's operating mode: Automatic – automated (recommended); Manual – manual. In automatic mode, the Expert does not require any p
FREE
Ultimate Boom and Crash Indicator The Ultimate Boom and Crash Indicator is a cutting-edge tool developed by  Coetsee Digital , designed to identify potential spike opportunities in the market. Crafted for traders focusing on Deriv and Weltrade synthetic markets, this indicator is optimized to operate exclusively on the 3-minute (M3), 5-minute (M5), 15-minute (M15), 30-minute (M30), and 1-hour (H1) timeframes and supports only the following pairs: PainX 1200, PainX 999, PainX 800, PainX 600, Pai
Mac-Binary option Signals is unique mathematical concept to trade iqoptions,binary,rocketoptions specter or any other binary options company 1 min 5 expiry run robot 30min everyday and fill profit and loss ratios inside mt2iq/mt2binary and run or 1min to 5min expiry ...go to setting in mt2iq robot allow otc and digital options. and select risk 500and profit 300$ per day it can stop automatically after profit or loss... If it can close after loss restart and Reset profit and loss button run again
Gann Time–Price Square Cycles (MT5) This indicator applies the concept of time–price balance introduced by W.D. Gann. It detects price swings on the chart and projects Quarter, Half, and Full cycle time intervals forward, marking them with vertical lines. The tool is designed to help traders study the relationship between swing size and elapsed time directly on MT5 charts. Functions Detects swing highs and lows based on pivot depth and minimum swing size. Projects Quarter, Half, and Full harmon
Noize Absorption Index - is the manual trading system that measures the difference of pressure between bears forces and bulls forces. Green line - is a noize free index that showing curent situation. Zero value of index shows totally choppy/flat market.Values above zero level shows how powerfull bullish wave is and values below zero measures bearish forces.Up arrow appears on bearish market when it's ready to reverse, dn arrow appears on weak bullish market, as a result of reverse expectation.
STRICTLY FOR BOOM INDEX ONLY!!!!! Here I bring the Maximum Trend Arrows OT1.0 MT5 indicator. This indicator is made up of a combination of different trend indicators for entries and exits, for entries an orange arrow will paint on the chart below the current market and a red flag for closing of trades and it produces buy arrows only. When the orange arrow appears, it will appear along with it's sound to notify you. The 1H timeframe is recommended, don't use it anywhere else than on the 1H timefr
The SafeProfit Market Profile is the most advanced tracking indicator in the Forex Market. It was developed to track the market profile of each session of the day: Asian, European and American. With this indicator you will operate Intraday smiling ... knowing exactly where the Big Players are positioned and the exact moment where they are going to. The indicator is simple, fast and objective, tracking every movement of the Big Players in price. Get out of the 95% statistic that only loses and us
The Inside Bar e one is a reversal/continuation candle formation, and is one of the most traded candle patterns. Robot F1 allows you to configure different trading strategies, Day Trade or swing trade, based on the Inside Bar as a starting point.  This pattern only requires two candles to perform. Robot F1 uses this extremely efficient pattern to identify trading opportunities. To make operations more effective, it has indicators that can be configured according to your strategy. Among the o
Was: $249  Now: $149   Market Profile defines a number of day types that can help the trader to determine market behaviour. A key feature is the Value Area, representing the range of price action where 70% of trading took place. Understanding the Value Area can give traders valuable insight into market direction and establish the higher odds trade. It is an excellent addition to any system you may be using. Inspired by Jim Dalton’s book “Mind Over Markets”, this indicator is designed to suit the
Welcome to HiperCube Renko Candles Discount code for 25% off at Darwinex Zero: DWZ2328770MGM This indicator provide you a real info of market transform it to Renko Candle Style. Definition Renko charts  are  a type of financial chart that measures and plots price changes, using bricks (or bars) to represent price movements . Unlike traditional candlestick charts,  Renko charts  do not display time-based information, focusing solely on price fluctuations. Features: Indicator in separate windows 
FREE
Lorentzian AI
Michael Prescott Burney
5 (2)
The Lorentzian A.I Indicator System is designed to enhance trading strategies across Crypto, Indices, Forex, and Stocks by utilizing adaptive algorithms and real-time market analysis. It applies Lorentzian Classification to generate buy and sell signals while integrating K-Nearest Neighbors filtration for data normalization and improved signal reliability. Neural network processing incorporates multidimensional signals with time-space calculations to refine trend forecasting. The system continu
FREE
GorMaster Pro
Manuel Damian Ortiz Fernandez
GorMaster_Pro — Sesgo confiable, noticias y técnica en una sola pantalla Visión GorMaster_Pro es una herramienta indispensable para cualquier tipo de trader (scalper, intradía o swing) porque combina información fundamental y técnica para darte una lectura fiel y accionable del mercado. En una sola vista verás: sesgo direccional BUY/SELL/RANGO , ventanas de noticias en tiempo real que congelan la operativa, métricas técnicas clave (ATR_Z, RangeRatio, ADX, SpreadZ), sesiones y alertas . Todo org
Hurst Cycles Diamonds Description This indicator is an alternative version inspired by the pioneering work of David Hickson and the Hurst Cycles Notes indicator developed by Grafton. The main objective is to provide a clear and intuitive view of the Hurst cycles. Credits Original Concept : David Hickson - Hurst Cycles Theory Inspiration : Grafton - Hurst Diamond Notation Pivots Alternative Version : Fillipe dos Santos Main Features Identifies and displays pivots in multiple time cycles Visual t
Trade Performance Information
Andres Mauricio Serrano Quintero
This indicator will help you track performance of your trades, even scalping trades.  You can use it with the Arab, and many other traders.  This indicator displays essential trading account information directly on your chart. It positions itself in one of the four corners of the screen and showcases details such as: Symbol: The symbol of the asset currently displayed on the chart. Profit/Loss: The total profit or loss in dollars for the current symbol. Pips: The total number of pips gained or
FREE
Aroon Precision Trends MT5
Maestri Investment Group Ltd.
Introducing the Aroon Indicator - Your Ultimate Trend Analysis Tool! Are you looking to take your trading game to the next level? Want to identify lucrative entry and exit points in the financial markets with ease? Look no further! The Aroon Indicator is here to revolutionize your trading strategy and help you make informed decisions like never before. Developed by the brilliant mind of Tushar Chande, the Aroon Indicator is a powerful technical analysis tool designed to measure the strength a
Fibaction
Abdelkhalek Orabi
Indicator Name: Fibaction – price action candle Detector Description: Fibo Signal Boxes is a powerful Smart Money Concept (SMC)-inspired indicator that auto-detects price action candles. bullish hammers and shooting stars, then draws precise Fibonacci entry zones and multiple take-profit levels directly on the chart. as for the SL personally i use 40 pips rules  Key Features: Detects bullish hammer and shooting star reversal candles. Automatically draws Fibonacci entry and TP boxes. as
Our   Basic Support and Resistance   indicator is the solution you need to boost your technical analysis. This indicator allows you to project support and resistance levels on the chart /   MT4 Version Features Integration of Fibonacci Levels:  With the option to display Fibonacci levels alongside support and resistance levels, our indicator gives you an even deeper insight into market behavior and possible reversal areas. Performance Optimization:  With the option to update extended lines onl
Multi Timeframe Chart
Bekono Owona Roger Blaise
MTFC (Multi Timeframe Chart) – See 2 Timeframes on ONE Chart! "Trade Smarter, Not Harder – Eliminate Timeframe Switching Forever!" Imagine having the power to see any higher timeframe (M5, M15, H1, H4, D1, MN1, etc.) directly on your current chart.   No more flipping between charts, no more guesswork—just   pure trading clarity   in one place. That’s exactly what the   MTFC Indicator   delivers! 1. The Problem It Solves As traders, we know   context is king . But constantly switching between c
Your Trend Friend
Luigi Nunes Labigalini
5 (1)
The trend is your friend! Look at the color of the indicator and trade on that direction. It does not  repaint. After each candle is closed, that's the color of the trend. You can focus on shorter faster trends or major trends, just test what's most suitable for the symbol and timeframe you trade. Simply change the "Length" parameter and the indicator will automatically adapt. You can also change the color, thickness and style of the lines. Download and give it a try! There are big movements w
WanaScalper
Isaac Wanasolo
1 (1)
A scalping indicator based on mathematical patterns, which on average gives signals with relatively small SL, and also occasionally helps to catch big moves in the markets (more information in the video) This indicator has three main types of notifications: The first type warns of a possible/upcoming signal on the next bar The second type indicates the presence of a ready signal to enter the market/open a position The third type is for SL and TP levels - you will be notified every time price re
Boom and Crash Buy and Sell Trend. Non-repaint. Can be used on all timeframes 1 minute for scalpers. 5 minute to monthly timeframe for swing trading. works on all boom and crash pairs Crash300, Crash500, Crash1000. Boom300, Boom500, Boom1000. Green histogram colour means the trend is up(bullish) Buy signal. Dark orange histogram colour means the trend is down(bearish) Sell signal.
Volume Profile V6
Andrey Kolesnik
4.5 (2)
The volume profile indicator of the market + a smart oscillator. It works on almost all instruments-currency pairs, stocks, futures, cryptocurrency, on real volumes and on tick ones. You can set both the automatic definition of the profile range, for example, for a week or a month, etc., and set the range manually by moving the boundaries (two vertical lines red and blue). It is shown as a histogram. The width of the histogram at this level means, conditionally, the number of transactions condu
The indicator builds current quotes, which can be compared with historical ones and on this basis make a price movement forecast. The indicator has a text field for quick navigation to the desired date. Options: Symbol - selection of the symbol that the indicator will display; SymbolPeriod - selection of the period from which the indicator will take data; IndicatorColor - indicator color; Inverse - true reverses quotes, false - original view; Next are the settings of the text field, in w
Arrow Micro Scalper - an indicator designed for scalping and short-term trading, integrated into any chart and financial instrument (currency, crypto, stocks, metals). In its work, it uses wave analysis and a trend direction filter. It is recommended to use on time frames from M1 to H4. How to work with the indicator. The indicator contains 2 external parameters for changing the settings, the rest are already configured by default. Large arrows indicate a change in trend direction, blue - the
Liquidity Oscillator
Paolo Scopazzo
3 (2)
A powerful oscillator that provide Buy and Sell signals by calculating the investor liquidity. The more liquidity the more buy possibilities. The less liquidity the more sell possibilities. Please download the demo and run a backtest! HOW IT WORKS: The oscillator will put buy and sell arrow on the chart in runtime only . Top value is 95 to 100 -> Investors are ready to buy and you should follow. Bottom value is 5 to 0 -> Investors are ready to sell and you should follow. Alert + sound will appe
PipFinite Breakout EDGE MT5
Karlo Wilson Vendiola
4.81 (93)
The Missing Edge You Need To Catch Breakouts Like A Pro. Follow a step-by-step system that detects the most powerful breakouts! Discover market patterns that generate massive rewards based on a proven and tested strategy. Unlock Your Serious Edge Important information here www.mql5.com/en/blogs/post/723208 The Reliable Expert Advisor Version Automate Breakout EDGE signals using "EA Breakout EDGE" Click Here Have access to the game changing strategy that will take your trading to the next l
Support & Resistance Auto Plot Lines Indicator for MT5 – Perfect for Scalping! Make your trading easier with our Support & Resistance Auto Plot Lines indicator for MT5. This powerful tool automatically detects key support and resistance levels on your chart, helping you make better trading decisions with minimal effort. Why Choose This Indicator? Perfect for Scalping – Quickly identify strong price zones for fast, precise entries and exits. Automatic Level Detection – No need to manually dra
IQ Gold Gann Levels a non-repainting, precision tool designed exclusively for XAUUSD/Gold intraday trading. It uses W.D. Gann’s square root method to plot real-time support and resistance levels, helping traders spot high-probability entries with confidence and clarity. William Delbert Gann (W.D. Gann) was an exceptional market analyst, whose trading technique was based on a complex blend of mathematics, geometry, astrology, and ancient mathematics which proved to be extremely accurate. Download
Atomic Analyst MT5
Issam Kassas
4.14 (21)
First of all Its worth emphasizing here that this Trading Indicator is   Non-Repainting   , Non Redrawing and Non Lagging Indicator   Indicator, Which makes it ideal from both manual and robot trading.  User manual: settings, inputs and strategy . The Atomic Analyst  is a PA Price Action Indicator that uses Strength and Momentum of the price to find a better edge in the market. Equipped with Advanced filters which help remove noises and false signals, and Increase Trading Potential. Using Multi
Introducing the Power Trade Plus indicator designed by a small group of traders with a few years of experience trading the market profitably.  The Power Trade Plus is derived from the Power Trade indicator,  the indicator strive in powerful sniper entries and take profit levels,  with an algorithm that's can determine the markets volatility and Provides entries based on the current market volatility. This indicator is much more effective in stock ,currencies and indices.
Buyers of this product also purchase
How many times have you bought a trading indicator with great back-tests, live account performance proof with fantastic numbers and stats all over the place but after using it, you end up blowing your account? You shouldn't trust a signal by itself, you need to know why it appeared in the first place, and that's what RelicusRoad Pro does best! User Manual + Strategies + Training Videos + Private Group with VIP Access + Mobile Version Available A New Way To Look At The Market RelicusRoad is the
MetaForecast M5
Vahidreza Heidar Gholami
5 (3)
MetaForecast predicts and visualizes the future of any market using different powerful methods. While financial markets are not always predictable, if there are patterns in the past data, MetaForecast can learn and predict the future as accurately as possible. It features a complete implementation of neural networks embedded directly into the indicator, enabling traders to create and train AI models using data from multiple symbols to learn complex patterns. MetaForecast leverages your computer'
TPSpro RFI Levels MT5
Roman Podpora
4.53 (19)
Reversal zones - levels / Active zones of a major player INSTRUCTIONS RUS   /   INSTRUCTIONS   ENG   /   Version MT4 EVERY BUYER OF THIS INDICATOR       GET ADDITIONALLY   FOR FREE   : 3 months       access to trading signals from the service       RFI SIGNALS       — ready-made entry points according to the TPSproSYSTEM algorithm. 3 months       access to training materials with regular updates - immersion in strategy and professional growth. 24/5 support on weekdays and access to a closed tra
Berma Bands
Muhammad Elbermawi
5 (7)
The Berma Bands (BBs) indicator is a valuable tool for traders seeking to identify and capitalize on market trends. By analyzing the relationship between the price and the BBs, traders can discern whether a market is in a trending or ranging phase. Visit the [ Berma Home Blog ] to know more. Berma Bands are composed of three distinct lines: the Upper Berma Band, the Middle Berma Band, and the Lower Berma Band. These lines are plotted around the price, creating a visual representation of the pric
ARIPoint
Temirlan Kdyrkhan
ARIPoint is a powerful trading companion designed to generate high-probability entry signals with dynamic TP/SL/DP levels based on volatility. Built-in performance tracking shows win/loss stats, PP1/PP2 hits, and success rates all updated live. Key Features: Buy/Sell signals with adaptive volatility bands Real-time TP/SL/DP levels based on ATR Built-in MA Filter with optional ATR/StdDev volatility Performance stats panel (Success, Profit/Loss, PP1/PP2) Alerts via popup, sound, push, or email Cu
ARIScalping
Temirlan Kdyrkhan
ARIScalp is a powerful trading companion designed to generate high-probability entry signals with dynamic TP/SL/DP levels based on volatility. Built-in performance tracking shows win/loss stats, PP1/PP2 hits, and success rates all updated live. Key Features: Buy/Sell signals with adaptive volatility bands Real-time TP/SL/DP levels based on ATR Built-in MA Filter with optional ATR/StdDev volatility Performance stats panel (Success, Profit/Loss, PP1/PP2) Alerts via popup, sound, push, or email Cus
Introduction to Chart Pattern MT Chart Pattern MT is a chart pattern scanner to detect the triangle pattern, falling wedge pattern, rising wedge pattern, channel pattern and so on. Chart Pattern MT uses highly sophisticated chart pattern detection algorithm. However, we have designed it in the easy to use with intuitive user interface. Chart Pattern MT will show all the patterns in your chart in the most efficient format for your trading. You do not have to do tedious manual pattern detection an
The " Dynamic Scalper System MT5 " indicator is designed for the scalping method of trading within trend waves. Tested on major currency pairs and gold, compatibility with other trading instruments is possible. Provides signals for short-term opening of positions along the trend with additional price movement support. The principle of the indicator. Large arrows determine the trend direction. An algorithm for generating signals for scalping in the form of small arrows operates within trend wav
Big Player Range
Thalles Nascimento De Carvalho
5 (3)
BigPlayerRange — Best Indicator for Micro Index and Micro Dollar | MT5 Unlock the power of BigPlayerRange , widely recognized as the best institutional indicator for the micro index and micro dollar on MetaTrader 5. This powerful tool highlights strategic zones of institutional activity, providing ultra-precise market structure insights. How It Works: BigPlayerRange draws two horizontal zones based on institutional volume action: Green Zone — Where institutional buyers defend the price.
Meta Cipher B
SILICON HALLWAY PTY LTD
Meta Cipher B: The All-in-One Oscillator Suite for MT5 Meta Cipher B brings the popular Market Cipher B concept to MetaTrader 5, optimised for speed and precision. Built from the ground up for performance, it delivers professional-grade signals without lag or sluggish scrolling. What it does A unified oscillator stack that visualises Wave momentum, VWAP, Money Flow, RSI and Stochastic. Clean Buy and Sell dots appear when conditions align. Use it on small timeframes for timing, and on high
Introduction to X3 Chart Pattern Scanner X3 Cherart Pattern Scanner is the non-repainting and non-lagging indicator detecting X3 chart patterns including Harmonic pattern, Elliott Wave pattern, X3 patterns, and Japanese Candlestick patterns. Historical patterns match with signal patterns. Hence, you can readily develop the solid trading strategy in your chart. More importantly, this superb pattern scanner can detect the optimal pattern of its kind. In addition, you can switch on and off individu
Weis Wave with Alert MT5
Trade The Volume Waves Single Member P.C.
4.94 (16)
Rental/Lifetime Package Options and Privileges  Rent Monthly Six Months   Yearly/Lifetime Weis Wave with Speed with Alert+Speed Index x x x Manual  x x x Quick Set up Video x x x Blog x x x Lifetime Updates x x x Setup and Training Material x x Discord Access Channel "The SI traders"          x Rectangle Break Alert Tool      x How to trade with it:    http://www.tradethevolumewaves.com   ** If you purchase please contact me to setup your  : Training Room and  complete manual access.  Wei
AI Arrow
Victor-manuel Lozano Garcia
QUICK OVERVIEW: Use AI to predict the markets with AI Arrow, the ultimate trading tool, let it manage the probabilities and send you a simple signal in the form of an arrow, ready to trade, no complex configurations. The indicator will analyze the market and let you know when a potential movement will happen, sometimes it takes some extra bars for the movement to happen as it can't predict the exact top/bottom every time. Arrow will appear at the start of a new bar and alert you, so you have ti
Custom Indictor Signal Scanner for scan your own any custom indicator and template its one click you can open your desire signals(given time frame alert). Also can open same template with particular input indicator just type name of template your created with given indicator and enjoy all time frame scan with your logical signals  input string s2 = "====== Embedded Indicator Settings ======"; input UseEmbeddedIndicator = false; // Use embedded indicator instead of external file ( don't use its n
Boom and Crash Trend Detector is a  Non-Repaint   MT5 trading system usually being sold for 50 0$ . Most people use this for Deriv but can be used to forex too. The boom and crash spike indicator is a spike detecting software, with Multiple features, these features include. Spike Alert ( from 10 to 100-second warning before spike) Continues spike Alert (for double or continuous spikes at a time) supports all Boom/crash Indices M6 time frame works best here . Bigger time frame trend pointer for
Elliott Wave Trend was designed for the scientific wave counting. This tool focuses to get rid of the vagueness of the classic Elliott Wave Counting using the guideline from the template and pattern approach. In doing so, firstly Elliott Wave Trend offers the template for your wave counting. Secondly, it offers Wave Structural Score to assist to identify accurate wave formation. It offers both impulse wave Structural Score and corrective wave Structure Score. Structural Score is the rating to sh
Gold 100 Pip Signals
Allen Mwaniki Mwangi
100PIPSsignals — Fast EMA crossover system for Gold (M1) A lightweight EMA crossover indicator designed for Gold CFDs on the 1-minute chart. It marks low-risk entry points with clear arrows and gold circles, validates moves by a configurable minimum pip target, and can send alerts/notifications. How it works (simple) The indicator uses two exponential moving averages (fast EMA and medium EMA). When the fast EMA crosses above the medium EMA a Buy signal arrow appears; when it crosses below a Sell
Introducing the POWER TRADE indicator created by a small group of traders with a few years trading trading the financial market profitably . This is a plug and play indicator that provides you with  POWERFUL Entry signals with Profit Taking and rebound zones. The indicator Works with all MT5 trading instruments. The indicator uses previous  chart data as receipt to speculate on future market moves.
A tool for on-chart strategy backtesting and performance analysis. A utility for developing, debugging, and testing custom trading ideas and indicator functions. An indicator designed to quickly test trading concepts and visualize the effectiveness of different input parameters. An all-in-one sandbox for testing everything from simple crossovers to complex, multi-condition trading systems.
TPA True Price Action indicator reveals the true price action of the market makers through 100% non-repainting signals strictly at the close of a candle! TPA shows entries and re-entries, every time the bulls are definitely stronger than the bears and vice versa. Not to confuse with red/green candles. The shift of power gets confirmed at the earliest stage and is ONE exit strategy of several. There are available now two free parts of the TPA User Guide for our customers. The first "The Basics"
Enigmera MT5
Ivan Stefanov
3.67 (3)
ENIGMERA: The core of the market (This is a manual indicator and contains features that are not supported by the MetaTrader testing environment) Introduction This indicator and trading system is a remarkable approach to the   financial markets . ENIGMERA uses the fractal cycles to accurately calculate support and resistance levels.   It shows the authentic accumulation phase and gives direction and targets.    A system that works whether we are in a trend or a correction.   How It Works Most
The indicator highlights zones where interests are being declared then shows their accumulation zone. It works like an order book in big scale. This is the indicator for the biggest money. It's performance is exceptional. Whatever interest there is in the market you will see it. ( This is a fully rewritten, automated version—manual analysis is no longer required.)  The Transaction Speed is a new concept indicator that shows where and when large orders accumulates on the market and benefits o
Tragos
David Chokumanyara
TRAGOS Indicator – The GOAT of All Trading Indicators TRAGOS (Greek for “male goat”) isn’t just a name — it’s the GOAT: Greatest of All Time in trading indicators. Designed for Forex, Indices, Gold, Crypto, and Deriv Synthetic Indices (Boom & Crash, Volatility 75, Step, Jump, etc.), it gives you non-repainting buy, sell, and exit signals with unmatched clarity. Why TRAGOS? Non-Repainting Signals – 100% reliable. Audible, Email & Push Alerts – Never miss a trade. Trend Following – Rid
WVAP Scalping
Domantas Juodenis
Ctrader version available  https://ctrader.com/products/1943   WVAP Scalping Pro – The Ultimate Professional Trading System Revolutionary VWAP + Market Profile Technology for Serious Traders Stop trading blind. WVAP Scalping Pro delivers the most advanced Volume-Weighted Average Price system on MQL5 , combining institutional-grade market profile, triple VWAP confluence, and a professional trading dashboard — all in one powerful tool. This isn’t just another indicator. It’s a complete trading e
VTrende Pro
Andrii Diachenko
5 (1)
VTrende Pro - MTF indicator for trend trading with a display panel for MT5 *** Videos can be translated into any language using subtitles (video language - Russian) Although the signals of the VTrende Pro indicator can be used as signals of a full-fledged trading system, it is recommended to use them in conjunction with the Bill Williams TS. VTrende Pro is an extended version of the VTrende indicator. Difference between Pro version and VTrende: - Time zones - Signal V - signal 1-2 waves -    S
MonetTrend — Премиум-индикатор для торговли по тренду (M30, H1, H4) MonetTrend — это мощный и визуально понятный трендовый индикатор, созданный для торговли на таймфреймах M30, H1 и H4. Он идеально подходит для работы с волатильными инструментами, такими как: • Золото (XAUUSD) • Криптовалюты (BTCUSD) • Валютные пары (EURUSD, USDJPY и др.) Ключевые особенности MonetTrend: • Автоматическое отображение Take Profit 1 (TP1) и Stop Loss (SL): После появления сигнала индикатор сразу показывает: • TP
This indicator is based on the mathematics of the great trader W.D. Ganna. With its help, you can easily find strong levels by analyzing swings to find the optimal entry point. The indicator works on all instruments and all timeframes. The indicator is fully manual and has control buttons. All you need to do is press the NEW button, a segment will appear, which you can place on any movement, swing or even 1 candle that you want to analyze. By placing the segment, press the OK button. A grid (th
IQ FX Gann Levels a precision trading indicator based on W.D. Gann’s square root methods. It plots real-time, non-repainting support and resistance levels to help traders confidently spot intraday and scalping opportunities with high accuracy. William Delbert Gann (W.D. Gann) was an exceptional market analyst, whose trading technique was based on a complex blend of mathematics, geometry, astrology, and ancient mathematics which proved to be extremely accurate. Download the   Metatrader 4 Version
Get the FREE AUX Indicator, EA Support & Manual Guide please visit - https://www.mql5.com/en/blogs/post/763955 Spot the Trend. Read the Pattern. Time the Entry. 3 Steps in Under 30 Seconds! Trade effortlessly — no analysis required, Your smart assistant is ready to simplify your workflow No more chart overload. Trade with confidence using smart bias detection. Compatible with all currencies, crypto, stocks, metals, indices, and any timeframe. Just click and execute — it’s that simple. Deal for
The indicator is designed to work on any trading platform. The program is based on proprietary algorithms and W.D.Ganna's mathematics, allowing you to calculate target levels of price movement based on three points with the highest degree of certainty. It is a great tool for stock trading. The indicator has three buttons: NEW - call up a triangle for calculation. DEL - delete the selected triangle. DELS - completely remove all constructions. The probability of achieving the goals is more than 80
More from author
TrendView
Rafael Grecco
TrendView — Clear Trend Visualization for Confident Trading TrendView is a free trend indicator designed to give traders a clean and reliable view of market direction. It displays clear trendlines in three colors, making it easy to identify bullish, bearish, and neutral phases without cluttering the chart with unnecessary elements. Whether you are monitoring long-term market structure or short-term price action, TrendView helps you keep your focus on the bigger picture. For traders who also w
FREE
Reversal Oscillator — Advanced Momentum Shift Detector Reversal Oscillator is a free indicator designed to highlight price zones that are statistically outside their normal movement patterns, helping traders anticipate potential turning points before they occur. Unlike traditional oscillators that react mainly to overbought/oversold conditions, this indicator applies third derivative analysis (the "acceleration of the acceleration" of price) calculated using two independent methods within a n
FREE
Reversal Arrow Pro — Precise Buy/Sell Reversal Signal Indicator Reversal Arrow Pro is a leading indicator designed to detect the early stages of high-probability market reversals. Unlike traditional tools that react after a trend has formed, this indicator aims to anticipate turning points using a proprietary formula based on advanced momentum analysis. What is a Leading Indicator? Most popular indicators, such as Moving Averages, MACD, and Stochastic Oscillators, are considered lagging in
Filter:
No reviews
Reply to review