Watch the Market tutorial videos on YouTube
How to buy а trading robot or an indicator
Run your EA on
virtual hosting
virtual hosting
Test аn indicator/trading robot before buying
Want to earn in the Market?
How to present a product for a sell-through
Free Technical Indicators for MetaTrader 5 - 8

Basic Theme Builder: Simplify Your Chart Customization Transform your trading experience with the Basic Theme Builder indicator, a versatile tool designed to streamline the customization of your chart's appearance on MetaTrader 5. This intuitive indicator offers a user-friendly panel that enables you to effortlessly switch between various themes and color schemes, enhancing both the visual appeal and functionality of your trading environment. Free MT4 version The Basic Theme Builder indicator i
FREE
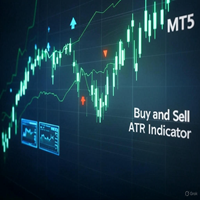
Buy and Sell ATR Indicator The Buy and Sell ATR Indicator is a powerful trend-following tool for MT5, combining ATR-based trend detection with RSI confirmation. It plots a dynamic trend line and generates clear buy (blue arrows) and sell (red arrows) signals when price action confirms a trend over a user-defined number of candles. A unique flat market filter, based on average ATR, prevents signals in low-volatility conditions. Customize ATR periods, RSI levels, signal thresholds, and arrow styl
FREE
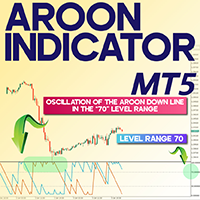
Aroon Oscillator in MetaTrader 5
The Aroon Indicator on MetaTrader 5 uses two oscillating lines—blue and brown—to analyze potential price movements and identify trend reversal zones. Displayed in a separate panel below the price chart, the Aroon Oscillator evaluates the strength and direction of a trend on a scale from 0 to 100. The positioning of the two lines, Aroon Up (blue) and Aroon Down (brown), determines whether the market trend is bullish or bearish. «Indicator Installation & User Gui
FREE

Used Fair Value Gap FVG and iFVG ICT SMC MT5 The Used Fair Value Gap (Used FVG-iFVG) is a sophisticated and efficient tool tailored for ICT and Smart Money traders , specifically for use on MetaTrader 5 (MT5) . This indicator pinpoints and visualizes market imbalance zones ( FVG ), helping traders spot crucial supply and demand areas . It marks bullish FVG zones in green and bearish FVG zones in brown . As the price revisits these regions, the indicator dynamically adjusts by shrinking the recta
FREE

Sessions are very important in trading and often good area where to look for setup. In SMC, ICT we will look for Asian session to serve as liquidity
This indicator displays: High & Low of the Asia session Midnight New York time opening line
Congifuration Line Style, color Label position, size, color Start of the level (Start of the day, Start of the session, Highest or Lowest point in the session)
Any questions or comments, send me a direct message here https://www.mql5.com/en/users/mvonline
FREE

Moving Average Convergence/Divergence — схождение/расхождение скользящих средних — технический индикатор, разработанный Джеральдом Аппелем (Gerald Appel), используемый в техническом анализе для проверки силы и направления тренда, а также определения разворотных точек. Встроенный в MetaTrader 5 индикатор MACD не соответствует задумке автора (Gerald Appel):
-линия MACD графически изображена в виде гистограммы, однако гистограммой отражается разница между линией MACD и сигнальной линией;
-сигнальн
FREE
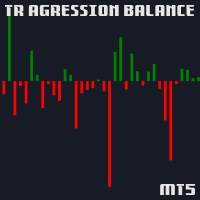
Shows the agression balance (buy agression deals - sell agression deals) in a histogram. The agression is calculated on every tick of a given candle and is the sum of volume of all the market buys minus all of the market sell trades. If the ticker does not have real volume, tick volume is used insted;
Very useful to determine if a given candle is dominated by bulls or bears
It is necessary for the data provider to have a list of trades (times & sales) as well as the agressor (buy/sell) data.
FREE

This Mt5 Indicator Signals when there is two opposite direction bars engulfed by current bar. has a recent Exponential Moving Average Cross and past bar was oversold/bought Expert Advisor Available in Comments Free Version Here : https://www.mql5.com/en/market/product/110114?source=Site  ; Full Alerts for mt5 terminal , phone , email, print to file, print to journal Buy Signal ( blue line ) Past ema cross ( set at 30 bars back ) Past bar rsi is oversold ( level 40 ) Engulfing bar closes
FREE

The indicator is an analytical tool incorporating 37 different variations of moving averages developed by authors such as Patrick Mulloy, Mark Jurik, Chris Satchwell, Alan Hull, and others. It provides the capability for historical virtual testing. The indicator can be used on various instruments, including gold, cryptocurrencies, stock indices, currency pairs, and other assets. An integrated visual backtester allows users to simulate virtual trading positions, track results, and visually assess
FREE

For those who love to trade using the Heikin Ashi Candlesticks, here it is a powerful ally: Heikin Ashi Delta . This indicator was presented by Dan Valcu in his book about Heikin Ashi candlesticks called " Heikin Ashi - How To Trade Without Candlestick Patterns " - and by the way this is a very cool book, we totally recommend it. Even for those of you who don't trade using Heikin Ashi candlesticks could use this Leading Indicator anyway. It is more "nervous" than let's say a Stochastic, but coul
FREE

Mouse You can draw fibonaccis moving the mouse over the zigzag indicator Pin them You can click on fibonacci with this option and it will no longer be deleted unless you click on it again :) Precision The tuned fibonacci gets the precise point in lower timeframes Enjoy it You can ask me for add more features, so please comment and leave your ranting for me to be happy, thank you :)
FREE

INFOPad is an information panel that creates information on the selected currency pair in the MetaTrader 5 terminal. There are 5 functions of this indicator: Shows the main and main information on the selected symbol: Ask BID, Spread, Stop Level, Swap, Tick value, Commission prices; Shows the future targets of SL target and TP Target (The number of points of the established stop loss and take profit, the dollar amount); It shows the profit received for the periods: Today, Week, Month, Year, Tot
FREE
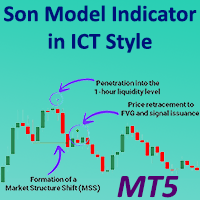
Son Model Indicator in ICT Style MT5
Crafted in alignment with the Son Model methodology, the Son Model Indicator delivers actionable trade alerts within the 5-minute chart. This MetaTrader 5 (MT5) tool integrates principles from ICT strategies, such as Market Structure Shift (MSS) and Fair Value Gap (FVG) , to generate signals. The indicator tracks price movement through liquidity zones derived from the 1-hour chart, aiming to detect areas where price might reverse. «Indicator Installation & U
FREE

COLORED TREND MA / MACD CANDLES draw MA Candles above/below Moving Average draw MACD Candles above and below 0 and Signal-Line
Your Advantage: a simple view of the trend direction a simple view over the higher trend direction a calmer chart for the eye clear rules can be defined Settings: Value Quick-Set : pre-Settings MACD 3 / 9 / 6 MACD customize MA Candles Fast EMA : 12 Slow EMA : 26 MACD SMA : 9 1. MA Period : default 14 and 20, which are my favorite for all timeframes, I believe in the 14
FREE

Description: Strategy based around Open-Close Crossovers. Setup: I have generally found that setting the strategy resolution to 3-4x that of the chart you are viewing tends to yield the best results, regardless of which MA option you may choose (if any) BUT can cause a lot of false positives - be aware of this. Don't aim for perfection. Just aim to get a reasonably snug fit with the O-C band, with good runs of green && red. Option to either use basic open && close series data or pick your pois
FREE

This indicator is designed to detect high probability reversal patterns: Double Tops/Bottoms with fake breakouts . This is the FREE version of the indicator: https://www.mql5.com/en/market/product/29957 The free version works only on EURUSD and GBPUSD! Double top and bottom patterns are chart patterns that occur when the trading instrument moves in a similar pattern to the letter "W" (double bottom) or "M" (double top). The patterns usually occur at the end of a trend and are used to signal tren
FREE

This indicator finds Double Top and Double bottom Example : What is Double Top When price establishes a new high and then falls, then reverse to the same candle area of High then its considered a valid double top and vice versa for double bottom. 1. It plots and high and low on visible chart if ChartChange is set to true else it searches on new bar opening
2. If there is double top and double bottom found in visible chart window then it plots a line 3. It has options to customize text color, tex
FREE

Indicator Introduction: The indicator comes from network ,It is more stable relative to RSI or CCI. You can set the indicator to send emails/notifications/alerts when the previous bar has an up or down arrow, you can specify the text of emails by inputing string into the parameter box of "UpMessages/DownMessages". It can be used to analyze market trend and design new expert that is based on trend. If the indicator below the axis ,this is a buy zone. The trend indicator is suitable for M1 and ab
FREE

The original author is David Weis, an expert in the Wyckoff Method. The Weis Wave is a modern adaptation of the 1930's Wyckoff Method, another expert in Tape Reading techniques and Chart Analysis. Weis Waves takes market volume and stacks it into waves according to price conditions giving the trader valuable insights about the market conditions. If you want to learn more about this subject you can find tons of videos in YouTube. Just look for "The Wickoff Method", "Weis Wave" and "Volume Spread
FREE
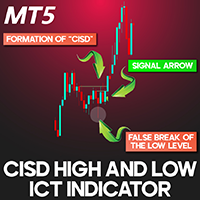
CISD - CSD + High & Low ICT Indicator in MetaTrader 5 The CISD – CSD + High and Low Indicator is a powerful tool that plots key High and Low-price levels while highlighting CISD formations on the chart. Designed based on the ICT trading strategy , this MT5 indicator helps identify false breakouts at major price levels and marks CISD occurrences with arrows to signal trade opportunities. CISD + High/Low Indicator Features Below is a breakdown of the CISD - CSD + High and Low Indicator specifica
FREE
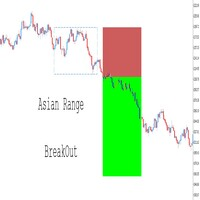
Fully Customizable – Adapt the indicator to your personal trading style by modifying parameters such as range time, colors, line styles, and risk-reward settings. Trade Levels Visualization – Automatically draws entry price, stop loss (SL), and take profit (TP) levels based on breakout conditions. Seamless Integration with Expert Advisors (EAs) – Take full control of your automated strategies by adding extra confirmations such as RSI, Moving Averages, Break of Structure (BOS), and more. Yo
FREE
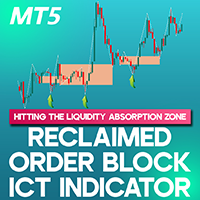
Reclaimed Order Block ICT Indicator MT5 Built upon the ICT trading principles, the Reclaimed Order Block ICT Indicator MT5 for MetaTrader 5 pinpoints essential price areas where an order block is initially breached, leading to a structural shift and the formation of a new trend. As the price revisits these levels post-breakout, the indicator generates strategic buy and sell signals, assisting traders in making data-driven decisions. «Indicator Installation & User Guide» MT5 Indicator Installatio
FREE

Welcome to RSI Colored Candles, an innovative indicator designed to enhance your trading experience by integrating the Relative Strength Index (RSI) directly onto your price chart. Unlike traditional RSI indicators, RSI Colored Candles utilizes a four-color scheme to represent RSI levels directly on your candlesticks, providing you with valuable insights at a glance. Features and Benefits: Space-saving Design: Say goodbye to cluttered indicator windows! RSI Colored Candles saves valuable chart
FREE

Better Period Separators For MetaTrader 5 The built-in period separators feature doesn’t allow users to specify the time period, so you can use this indicator to create more customizable period separators. On intraday charts, you could place period separators at a specific time, you could also place extra period separators at a specific time on Monday to mark the start of a week. On higher timeframe charts, this indicator works the same as the built-in period separators, On the daily chart, per
FREE

This indicator calculates the volume profile and places labels that correspond to the VAH, VAL and POC levels, for each candle individually.
Indicator operation features The indicator works on the timeframes from M3 to MN, but it uses the history data of smaller periods: M1 - for periods from M3 to H1, M5 - for periods from H2 to H12, M30 - for the D1 period, H4 - for the W1 period, D1 - for the MN period. The color and location of the VAL, VAH and POC labels on the current candle are considere
FREE

In many strategies, it's quite common to use a scaled ATR to help define a stop-loss, and it's not uncommon to use it for take-profit targets as well. While it's possible to use the built-in ATR indicator and manually calculate the offset value, it's not particularly intuitive or efficient, and has the potential for miscalculations.
Features Configurable ATR offset Upper and Lower Band. configurable ATR scaling factor alternate(non-chart) ATR timeframe explicitly defined input types to improv
FREE
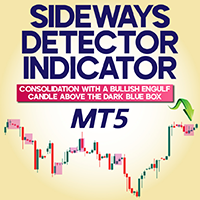
Sideways Detector indicator for MetaTrader 5 The Sideways Detector Indicator is a technical analysis tool in the MetaTrader 5 platform , designed to identify non-trending zones . This tool draws a navy blue box to display price equilibrium ranges and determine market conditions. This MetaTrader 5 indicator analyzes price movements using internal algorithms to determine whether the market is in a neutral phase or forming a new trend . «Indicator Installation & User Guide» MT5 Indicator Installati
FREE

The indicator analyzes the price structure of fractals and determines possible reversal points in market dynamics. Fractals can be used as support and resistance levels
Advantages:
Works on all instruments and timeseries, Does not redraw its results, Customizable colors of indicator elements, Pairs perfectly with any trend strategy, Adjusting the strength of fractals.
MT4 version indicator -> HERE / AW Fractals EA MT5 -> HERE
Strategy:
Fractals are a combination of can
FREE

JCAutoFibonacci 简繁自动绘制斐波那契 1.Zigzag3浪,大中小三浪分别代表市场潮流、趋势、涟漪,以不同参数实现。 使用自定义函数获取三浪高低点,以最近高低点作为绘制价格与时间。 2.Fibonacci,黄金分割线,水平线比例0、0.236、0.318、0.50、0.618、1.0、1.236、1.382、1.50、1.618、2.0等。 斐波那契返驰理论包括:反弹/回调现象、反转现象。合理绘制Fibonacci获取市场有效SR。分别绘制三浪。 3.自定义Fibo颜色,自定义水平线比例(0为不显示),自定义水平线颜色,自定义可选择,自定义右射。 备注:如遇使用问题,请联系邮箱:1093573090@qq.com
FREE

The OHLC indicator shows the current and historical values of High, Low, Open, Close and Mid for a specific time period. It can plot the current values or the values from the previous session. The indicator's range can be calculated from a daily, weekly, monthly, or user-specified session.
Levels High of the current or previous session. Low of the current or previous session. Open of current or previous session. Close of the current or previous session. Midpoint of the current or prev
FREE
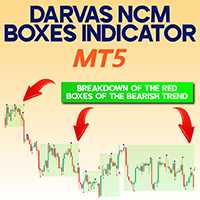
Darvas NCM Boxes Indicator for MetaTrader 5 The Darvas NCM Boxes Indicator for MetaTrader 5 is an advanced analytical tool designed to track significant price turning points by constructing visual range boxes around market highs and lows. By recognizing these pivot levels, the indicator outlines potential areas of interest, where price breakouts could trigger actionable trading opportunities. «Indicator Installation & User Guide» MT5 Indicator Installation | Darvas NCM Boxes Indicator MT4 | A
FREE
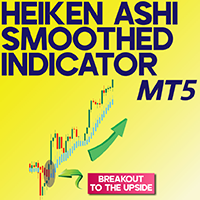
Heiken Ashi Smoothed Indicator for MT5
The "Heiken Ashi Smoothed" indicator is an advanced and updated version of Heiken Ashi candlesticks on the MetaTrader 5 platform . This indicator is specifically designed to analyze price trends and reduce chart noise .
The Heiken Ashi Smoothed indicator operates like a Moving Average (MA) , forming above or below the price. The trend's crossing with it indicates bullish or bearish market conditions. «Indicator Installation & User Guide» MT5 Indicator
FREE

RoundNumbers indicator is a simple and powerful psychological price levels. Trader usually use these levels as a Support and Resistance (SnR). Indicator Input: Levels - Numbers of levels drawn on chart. Default 30 levels. BoxSize - Box size drawn on each levels, indicate buffers around levels. Default value 1pips (10point) above and below each levels. ZoneSize - Distance between each levels, default value 10pips (100point). Style & Colours - User inputs customization. For MT4 version, p
FREE

Moving Average Crossover Alerts by Chart Walker
The Moving Average Crossover Alerts Indicator is designed to help traders identify potential trend reversals and entry/exit points in the market. By tracking two moving averages—typically a faster (short-term) and a slower (long-term) one—the indicator generates alerts whenever these moving averages cross. Key Features: Customizable Moving Averages: Choose from various types of moving averages (SMA, EMA, WMA, etc.) and set your desired periods for
FREE
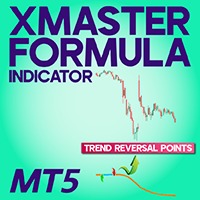
Xmaster Formula Indicator for MT5 Download The Xmaster Formula Indicator integrates Moving Average (MA) and MACD , enabling traders to assess trend strength and direction effectively. It uses green and red arrows to provide clear entry signals for trading decisions. «Indicator Installation & User Guide» MT5 Indicator Installation | Xmaster Formula Indicator for MT4 | ALL Products By TradingFinderLab | Best MT5 Indicator: Refined Order Block Indicator for MT 5 | Best MT5 Utility: Trad
FREE

The indicator has been designed for use on FORTS, but it can also work on other markets, at brokers broadcasting the required data. A peculiarity of these data is that they cannot be requested from the broker's server as a section of history, but can only be obtained for the current moment. The indicator periodically requests the broker, collects to a file and displays the following history from the stored file: The weighted average price. The volume of buy pending orders. The volume of sell pen
FREE

Stochastic Divergence Pro 1h 4h 1D+ Mastering Divergences for High Precision Trading The Stochastic Divergence Pro MT5 is an advanced analytical tool designed for traders who demand precision and clarity in their market analysis. This expert indicator identifies divergences between the price and the Stochastic Oscillator in real-time, providing crucial signals to anticipate trend changes in intermediate and higher timeframes (H1, H4 and above). Key Features and Benefits Automatic Divergence Dete
FREE

TILLSON MOVING AVERAGE Also known as TMA or T3 indicator. It is a moving average that uses EMA and DEMA in its formula and is calculated with the 3rd degree Binomial expansion. ... int handle1; //Handle of the Tillson TMA T3.EX5 custom indicator double euBuff1[]; int TMAperiod= 12 ; int TMSshift= 0 ; double VolumeFactor= 0.618 ; int OnInit () { ... handle1= iCustom ( NULL , PERIOD_CURRENT , "Market\\Tillson TMA T3.EX5" ,0,TMAperiod,0,0,TMSshift,0,0,Vol
FREE

Finally a Metatrader version of the very popular (and expensive) Market Cipher B indicator, or the Vumanchu Cipher B + Divergences very popular on Tradingview platform.
This tool is very heavy on calculations, total are 31 plots using 97 buffers from several indicators. On my mid end computer, timeframes below M15 start getting a bit laggy, so it would require a powerful computer to run it properly at very low timeframes. It's still usable here, but somewhat sluggish response in Metatrader (lik
FREE
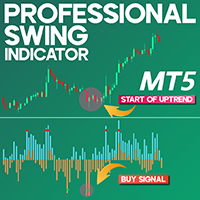
Professional Swing Indicator for MetaTrader 5
The Professional Swing Indicator is a reliable tool designed to assess trend strength and direction on the MetaTrader 5 platform. It features a combination of histogram bars and point markers. Histogram bars reflect the momentum of the trend, while point markers indicate trade entry opportunities. Buy signals appear below the midline, and sell signals appear above it. «Indicator Installation & User Guide» MT5 Indicator Installation | Professional
FREE

Time your Entry and Exits with Average True Range (ATR) Trailing Stops ATR Trailing Stops are primarily used to protect capital and lock in profits on individual trades but they can also be used, in conjunction with a trend filter, to signal entries. The indicator will help make your calculation of stop loss easier as it will be visually aiding you in choosing where to put your stoploss level on the chart by calculating the current value of ATR indicator. For those who are unfamiliar with ATR, i
FREE

Setup Tabajara was created by a Brazilian trader known as "The OGRO of Wall Street" .
The idea of this setup is to indicate to the trader the current trend of prices and the type of operation should be looked for in the graph.
Operation
It does this through the relation of the closing price position and the of 20 periods, by painting the candles in 4 possible colors : Green -> Price rising in upward trend (Search entry points for PURCHASE) Black -> Price correcting in Bullish Trend (Sear
FREE

The fact that round number levels have a significant influence on the market cannot be denied and should not be overlooked. These psychological levels are used by both retail Forex traders and major banks that deal in Forex. Very simple and effective indicator and most importantly free. ////////////////////////////////////////////////////////////////////////////////////////////////////////////////////////////////////////////////////////////// The program does not work in the strategy tester.
FREE
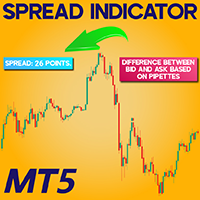
Spread Indicator download For Meta Trader 5
The Spread Indicator is a practical utility designed for MetaTrader 5 (MT5) that highlights the gap between the Bid and Ask prices directly on the chart. Positioned in the upper-left corner of the screen, it presents the current spread in real-time using pipettes (points), providing traders with a clear view of market costs. «Indicator Installation & User Guide» MT5 Indicator Installation | Spread Indicator Download for MT4 | ALL Products By Trad
FREE

Tabajara Rules for MT5 , baseado em Setup Tabajara do professor André Machado, indica a direção do mercado com base em médias móveis quando tem velas na mesma direção da média móvel.
O indicador contém a regra de coloração aplicada aos candles e a média móvel.
O indicador permite a alteração dos parâmetros: período e método de suavização da média móvel.
O indicador permite a alteração das cores dos candles ( contornos e preenchimento) e da média móvel.
O modelo do professor André Machado conté
FREE

Overview The TTM Squeeze indicator helps identify low volatility periods (squeeze) that often precede price breakouts. It uses Bollinger Bands (BB) and Keltner Channels (KC) to determine when the market is "coiling" and ready to move. Configuration Guide Volatility Settings The indicator uses Bollinger Bands to measure market volatility. When BBs are inside Keltner Channels, a squeeze is detected. The squeeze suggests the market is consolidating and may soon break out. True Range Option Optional
FREE
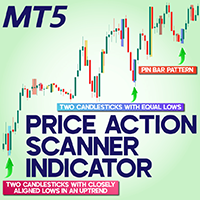
Price Action Scanner Indicator for MetaTrader 5 The Price Action Scanner Indicator leverages six prominent candlestick patterns . These include double highs/lows, equal highs/lows, wide-range bars, reversal points , and bullish , bearish , and pin bars . These patterns help traders identify optimal entry and exit opportunities with enhanced precision. «Indicator Installation & User Guide» MT5 Indicator Installation | Price Action Scanner Indicator MT4 | ALL Products By TradingFi
FREE

Imagine VWAP, MVWAP and MIDAS in one place... Well, you found it! Now you can track the movement of Big Players in various ways, as they in general pursue the benchmarks related to this measuring, gauging if they had good execution or poor execution on their orders. Traders and analysts use the VWAP to eliminate the noise that occurs throughout the day, so they can measure what prices buyers and sellers are really trading. VWAP gives traders insight into how a stock trades for that day and deter
FREE
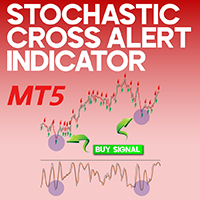
Stochastic Cross Alert Indicator for MetaTrader 5 The Stochastic Cross Alert Indicator for MetaTrader 5 is an advanced adaptation of the traditional Stochastic Oscillator, tailored for the MT5 trading platform. This tool provides traders with signal alerts under two specific conditions: when the %K and %D lines intersect, and when either line exits the predefined overbought or oversold zones. Stochastic Cross Alert Indicator Table Outlined below are the key specifications of the Stochastic Cro
FREE
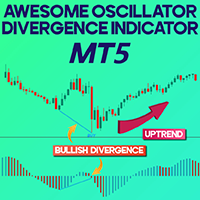
Awesome Oscillator Divergence Indicator for MetaTrader 5 The Awesome Oscillator Divergence Indicator for MetaTrader 5 (AO Divergence) is a modified version of the classic Awesome Oscillator that highlights bullish and bearish divergences directly on the chart. This indicator evaluates the spread between the 5-period and 34-period simple moving averages to measure market momentum and potential trend reversals, visualizing it through a histogram format. «Indicator Installation & User Guide» MT
FREE
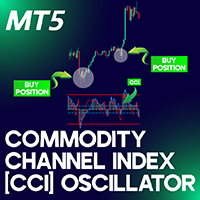
Commodity Channel Index Oscillator (CCI) Download MT5 The Commodity Channel Index (CCI) Oscillator is a widely used tool in technical analysis, particularly favored in the Forex and equities markets. Available for MetaTrader 5, this indicator, developed by Donald Lambert, measures the variance between the asset’s price and its moving average. Traders rely on it to determine ideal moments for entering and exiting positions and to assess potential overbought or oversold scenarios. «Indicator Insta
FREE

When working with several assets and having several open positions in different assets, it is a little complicated to visualize how much profit or loss is in each asset, so with this problem in mind I developed this indicator where it facilitates the visualization of open operations in each asset , where you will be able to open several different assets and you will be able to visualize the individual result of each asset and speed up your decision making in your trades.
FREE

Koala Trend Line Upgraded To Version 1.2 Last Upgrade Improvement : New Parameter Added that allow user to connect trend line to 2nd or 3th or Xth highest or lowest point.
My Request :
**Dear Customers Please Release Your Review On Koala Trend Line, And Let Me Improve By Your Feed Backs.
Join Koala Trading Solution Channel in mql5 community to find out the latest news about all koala products, join link is below : https://www.mql5.com/en/channels/koalatradingsolution
WHAT ABOUT OTHER FREE
FREE
This indicator is the mql version of the Linear Regression Candles indicator. There are many linear regression indicators out there, most of them draw lines or channels, but this one actually draws a chart.This script includes features such as linear regression for open, high, low, and close prices, signal smoothing with simple or exponential moving averages. Find out more here: https://www.mql5.com/en/users/rashedsamir/seller I welcome your suggestion for improving the indicator
To incre
FREE
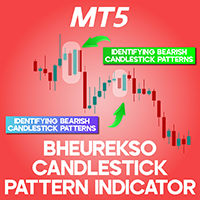
Bheurekso Candlestick Pattern Indicator for MetaTrader 5
The Bheurekso Pattern Indicator is suitable for traders to identify candlestick patterns on price charts. Developed for the MetaTrader 5 (MT5) platform, this indicator identifies candlestick reversal patterns and plots them on the chart, enabling traders to recognize them effectively. Additionally, it displays pattern labels and sends alerts to inform traders of their formation, allowing for more precise trading decisions.
«Indicator Inst
FREE

An “inside bar” pattern is a two-bar price action trading strategy in which the inside bar is smaller and within the high to low range of the prior bar, i.e. the high is lower than the previous bar’s high, and the low is higher than the previous bar’s low. Its relative position can be at the top, the middle or the bottom of the prior bar.
The prior bar, the bar before the inside bar, is often referred to as the “mother bar”. You will sometimes see an inside bar referred to as an “ib” and its m
FREE

Automatic Trend Line Fit. This indicator automatically plots the straight line and parabolic (curved) trend to any symbol at any timeframe. The plotted straight line is a good indication of the current trend and the curved line is an indication of a change momentum or change in the current trend. Plotting the straight line over about 2/3 the number of candles as the curved line is usually a good way to determine entry and exit points as it shows the current trend and momentum of the market. This
FREE

The Donchian Channel Channels are among the most popular tools of technical analysis, as they visually convey to the analyst the limits within which most price movement tends to occur. Channel users know that valuable information can be obtained at any time, whether prices are in the central region of a band or close to one of the border lines.
One of the best known techniques to explore these concepts is Bollinger Bands. However, John Bollinger was not the only one to research the application
FREE

Schaff Trend Cycle (STC) "CON ALERTAS"
El Indicador Schaff Trend Cycle (STC) es una herramienta técnica utilizada en el trading e inversión para identificar tendencias y generar señales de compra o venta. ¿Qué es el Schaff Trend Cycle? El STC fue desarrollado por Doug Schaff para mejorar las medias móviles incorporando análisis de ciclos. Su objetivo es identificar tendencias y cambios de tendencia midiendo la fuerza y velocidad de los cambios de precio. Es un oscilador que mide la velocidad
FREE

Fair Value Gap (FVG) Indicator for MetaTrader 5
The Fair Value Gap (FVG) Indicator is an effective tool designed to spot trading opportunities in MetaTrader 5 by identifying imbalances in supply and demand. These imbalances, known as FVGs, emerge when the price moves aggressively. To explain simply, imagine three candlesticks: the gap between the first and third candlestick forms the " FVG ." This indicator highlights these gaps as dynamic boxes—green for bullish FVGs and red for bearish FVGs.
FREE

L'indicatore "Heikin Ashi" è stato progettato per migliorare l'analisi dei grafici finanziari con un sistema di candele Heikin Ashi. Le candele Heikin Ashi sono un metodo avanzato per visualizzare il prezzo, che aiuta a filtrare il rumore del mercato, rendendo più chiara l'interpretazione dei trend e migliorando la qualità delle decisioni di trading. Questo indicatore consente di visualizzare le candele Heikin Ashi al posto delle candele giapponesi tradizionali, rendendo l'analisi grafica più pu
FREE
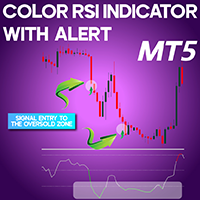
Color RSI Indicator with Alert (CRA) for Meta Trader 5 The Color RSI Indicator with Alert (CRA) for MetaTrader 5 enhances the classic Relative Strength Index by integrating color-coded signals and real-time notifications. It visually marks overbought regions (above 70) in red and oversold zones (below 30) in green, simplifying technical analysis. With built-in alerts, this tool helps traders respond quickly to ideal buy and sell moments on the MT5 platform. «Indicator Installation & User Guide»
FREE

Highly configurable Trader Dynamic Index (TDI) indicator.
Features: Highly customizable alert functions (at levels, crosses, direction changes via email, push, sound, popup) Multi timeframe ability (higher and lower timeframes also) Color customization (at levels, crosses, direction changes) Linear interpolation and histogram mode options Works on strategy tester in multi timeframe mode (at weekend without ticks also) Adjustable Levels Parameters:
TDI Timeframe: You can set the lower/higher ti
FREE

Daily session open lines shows the traders three important trading session opens. By default it is set up to show you: Zero GMT Open Line London Open Session Line New York Open Session Line The default times are set according to GMT+2 and as such you are able to change and customise according to your specific time zone. The Indicator is usefull specially for the trader who trades the London and NewYork sessions.
FREE
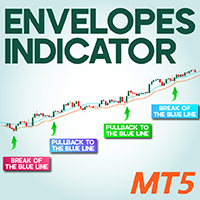
Envelopes Indicator for MetaTrader 5 The Envelopes Indicator is an effective technical analysis tool used to identify support and resistance areas and to detect trend reversals in the financial markets. It comprises two bands positioned at a fixed percentage above and below a moving average. These blue and red bands assist traders in accurately identifying overbought and oversold market conditions. «Indicator Installation & User Guide» MT5 Indicator Installation | Envelopes Indicator MT4 | ALL
FREE

Use this indicator to get alerts on trends developing within the market. Using this indicator, you will be able to get alerts about trends that are developing in the market as they develop. This indicator can be used to identify entries or exits within a trend. The indicator combines information from higher timeframes, with price movements of the current timeframe to output a buy or sell signal. The indicator can identify trend changes, or continuations of the dominant trend. Note: Trend followi
FREE
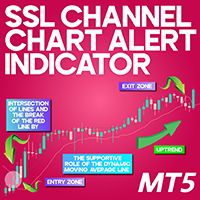
SSL Channel Chart Alert Indicator for MetaTrader 5 Introduction The SSL Channel Chart Alert Indicator is a powerful tool that leverages Moving Averages (MA) to determine buy and sell zones based on price trends. This MetaTrader 5 indicator consists of two Moving Average lines , calculated based on price highs and lows , offering traders a structured approach to identifying market direction. «Indicator Installation & User Guide» MT5 Indicator Installation | SSL Channel Chart Alert Indicator fo
FREE
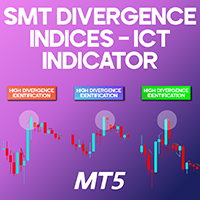
SMT Divergence Indices ICT Indicator MT5 The SMT Divergence Indices ICT Indicator MT5 is a specialized trading tool within the ICT methodology for MetaTrader 5. It assists traders in identifying three primary types of divergences across major stock indices. This indicator is particularly useful in spotting trendline divergences, higher-low divergences, and smart money divergences , providing traders with valuable insights into potential market reversals. «Indicator Installation & User Guide» MT5
FREE
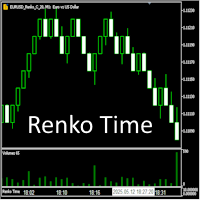
Индикатор предназначен для работы с ренко-графиками, построенными Renko Maker PRO или Renko Maker DEMO . Особенность реализации ренко-баров в терминале MetaTrader 5 такова, что из-за их вневременной природы (формирование новых баров зависит исключительно от изменения цены, а не от временных интервалов), время открытия каждого ренко-бара в истории оказывается искусственно сдвинутым в прошлое. Поэтому, чтобы видеть время открытия ренко баров, нужно воспользоваться этим индикатором Renko Time.
FREE
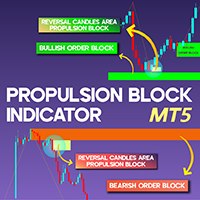
Propulsion Block Indicator for MT5
The Propulsion Block Indicator (ICT Propulsion Block) in MetaTrader 5 is an advanced analytical tool designed to detect price shifts and liquidity zones. These propulsion blocks emerge after the last candle revisits an order block, absorbing liquidity following notable price movements. This indicator pinpoints critical areas where order blocks intersect with Supply and Demand Zones , automatically updating the chart once the price enters one of these designate
FREE
The MetaTrader Market is a unique store of trading robots and technical indicators.
Read the MQL5.community User Memo to learn more about the unique services that we offer to traders: copying trading signals, custom applications developed by freelancers, automatic payments via the Payment System and the MQL5 Cloud Network.
You are missing trading opportunities:
- Free trading apps
- Over 8,000 signals for copying
- Economic news for exploring financial markets
Registration
Log in
If you do not have an account, please register
Allow the use of cookies to log in to the MQL5.com website.
Please enable the necessary setting in your browser, otherwise you will not be able to log in.