Press review - page 573


Nikkei 225 - daily correction within the primary bullish trend (based on the article)

Daily price was bounced from 23,426 resistance level to below for the secondary correction within the priumary bullish trend to be started. If the price breaks 21,281 support level to below on close daily bar so the bearish reversal will be started on the secondary ranging way, otherwise - bullish ranging within the levels.


  • "The breakneck climb from early September saw the Tokyo stock benchmark rise to highs not seen for more than 25 years. Recent peaks had been unmatched since the dawning days of January 1992, and they came backed up by gains for other global bourses. However of course they also saw the index become grievously overbought. A 4000-point climb in a little over two months will have that effect."
  • "Now the index has begun to retrace and that might be no bad thing. So far at least market action suggests a reasonable pause to re-group rather than a sudden outpouring of regret at all this autumn bullishness. Wednesday’s intraday low is the nadir of the pullback so far. It came in at 21,818 – exactly at the second, 38.2% retracement of the rise up from September 8’s lows."

==========

The chart was made on D1 timeframe with standard indicators of Metatrader 4 except the following indicators (free to download):

DailyFX Home
DailyFX Home
  • www.dailyfx.com
The breakneck climb from early September saw the Tokyo stock benchmark rise to highs not seen for more than 25 years. Recent peaks had been unmatched since the dawning days of January 1992, and they came backed up by gains for other global bourses. However of course they also saw the index become grievously overbought. A 4000-point climb in a...
 

USD/CAD Intra-Day FundamentalsCanada Manufacturing Shipments and range price movement 

2017-11-16 13:30 GMT | [CAD - Manufacturing Sales]

if actual > forecast (or previous one) = good for currency (for CAD in our case)

[CAD - Manufacturing Sales] = Change in the total value of sales made by manufacturers. 

==========

From official report :

  • "Manufacturing sales rose 0.5% to $53.7 billion in September, reflecting higher sales in the petroleum and coal product industry."
  • "Overall, sales were up in 7 of 21 industries, representing 28.9% of the Canadian manufacturing sector. Sales of non-durable goods rose 1.7% to $25.4 billion, while sales of durable goods decreased 0.5% to $28.4 billion."

==========

USD/CAD M5: range price movement by Canada Manufacturing Shipments news event 


==========

The charts were made on MT5 with MA Channel Stochastic system uploaded on this post, and using standard indicators from Metatrader 5.


Crude Oil - daily bullish ranging; 64.63 for the bullish trend to be continuing; 61.19 for the correction to be started (based on the article)

Daily price is located above 55 SMA/200 SMA in the strong bullish area of the chart. The price was bounced from resistance level at 64.63 to below for the secondary correction to be started if the support level at 61.19 is going to be broken by blow on the close daily bar.


  • "The price of Crude Oil is off the highest prices of the month as investors digest a recent EIA report showing the first build in crude and crude products in two months and as they await clarity on OPEC+ (a moniker for OPEC and strategic alliances like Russia.) Traders should note the finish to the year has been kind to Crude recently, and the charts are suggesting we could see a similar rally, but traders may have to put up with the volatility that proves directionless until the Nov. 30 meeting of OPEC and allies has passed."
  • "From a broader perspective, the recent 28-month high in crude oil last week, which was boosted by geopolitical tensions in the Middle East between Saudi Arabia that have led to a presence in Lebanon as warnings by the Saudi Royal court against Iran have escalated. Another key piece of industry news that provided price volatility, but may prove directionless in the end, is that Norway’s global leading sovereign wealth fund with $1 trillion in assets has proposed shedding their energy-intensive oil and gas stock portfolio. Their energy exposure is worth by nearly $35 billion, and this move would be to reduce concentration risk should an adverse energy price shock happen again. Another concern over the week came when the IEA reduced their demand forecast and said that $60."

==========

The chart was made on D1 timeframe with standard indicators of Metatrader 5 except the following indicators (free to download):


USD/CAD Intra-Day FundamentalsCanada Consumer Price Index and range price movement 

2017-11-17 13:30 GMT | [CAD - CPI]

  • past data is 0.2%
  • forecast data is 0.1%
  • actual data is 0.1% according to the latest press release

if actual > forecast (or previous one) = good for currency (for CAD in our case)

[CAD - CPI] = Change in the price of goods and services purchased by consumers. 

==========

From official report :

  • "The Consumer Price Index (CPI) increased 1.4% on a year-over-year basis in October, following a 1.6% gain in September. The all-items excluding gasoline index rose 1.3% year over year in October, after increasing 1.1% in September."

==========

USD/CAD M5: range price movement by Canada Consumer Price Index news event 


==========

Chart was made on MT5 with Brainwashing system/AscTrend system (MT5) from this thread (free to download) together with following indicators:

Same system for MT4:

  1. Brainwashing. Trades: manually and using EAs (MT4)
  2. Brainwashing EAs - the thread (MT4)
  3. Brainwashing: system setup for trading manually and for EAs (MT4) - the thread 
  4. Brainwashing: system development (MT4) - the thread
The Daily — Monthly Survey of Manufacturing, September 2017
  • 2017.11.16
  • www.statcan.gc.ca
Monthly data in this release are seasonally adjusted and are expressed in current dollars unless otherwise specified. For information on seasonal adjustment, see Seasonally adjusted data – Frequently asked questions. For information on trend-cycle data, see Trend-cycle estimates – Frequently asked questions. Non-durable goods industries include...
 

EUR/USD Next year Outlook - EUR/USD at 1.17/1.19 in Q1 of 2018 and at 1.22 in Q2, and Q3 of 2018 (adapted from the article)

Monthly price is on breakout within the primary bearish market condition: price was bounced from 1.0494 support level to above for the good secondary rally with the "reversal" Senkou Span line to be testing to above for the long-term bullish reversal.

If the price breaks 1.2092 resistance on close monthly bar so we may see the reversal of the price movement to the primary bullish market condition; otherwise - the price will be ranging within the levels near Senkou Span line waiting for the direction of the trend to be started.

Most likely scenario for 2018: breaking 1.20 resistance to above for the global long-term bullish reversal.


  • "Barclays Capital FX Strategy Research discusses its EUR/USD outlook going into 2018, expecting a flat profile around 1.17 level into Q1 of next year before breaking higher towards the 1.20 level in Q2."
  • "Starting in Q2 18, we expect EUR appreciation to renew on the back of an announcement around sequencing of ECB tightening. The Italian election will likely result in a higher risk premium for the EUR in the near term, but we see the ‘Politics of Rage’ more as a medium-term risk for the euro area," Barclays argues."

==========

The chart was made on D1 timeframe with Ichimoku market condition setup (MT5) from this post (free to download for indicators and template) as well as the following indicator from CodeBase:

EUR/USD: Close To Fair Value; What's Next? - Barclays
  • www.efxnews.com
Barclays Capital FX Strategy Research discusses its EUR/USD outlook going into 2018, expecting a flat profile around 1.17 level into Q1 of next year before breaking higher towards the 1.20 level in Q2. "The EUR's gains will likely remain supported by solid euro area growth, but much further gains are capped, as the currency is close to fair...
 

EUR/USD - 1.1860 as a next target for the primary daily bullish reversal (based on the article)

Daily price is on secondary rally within the primary bearish trend: price is located near and below Ichimoku cloud for Senkou Span line to be tested to above for the resistance level at 1.1860 as a next target for the primary daily bullish reversal.


  • "A lot of noise was made when EUR/USD broke the ‘neckline’ of the ‘head-and-shoulders’ top, and we were indeed onboard with what was presented to us as a valid confirmation of the three-month pattern. However, last week’s surge pushed the euro well above the ‘neckline’ and the trend-line running down off the September high. The combination of technical breaches significantly decreases the likelihood of the ‘H&S’ pattern still holding any real weight. One could say the formation isn’t fully wrecked until we see the euro trade above the ‘right shoulder’, but with the sturdy trend-line broken along with the ‘neckline’ the probability of the formation becoming fully invalidated rose sharply last week. "
  • "This doesn’t mean EUR/USD is in the clear for higher prices just yet, though. The downtrend off the September high remains intact for now with the series of lower-lows and lower-highs still in place. It’s possible the Wednesday reversal-day marked the next lower-high in the sequence. This makes that particular day, and even more importantly, the area around 11876 so crucial. It’s the 2010 low, which is why it has received so much attention in recent months as both support and resistance. Strong clearance above will be needed before the euro can run. If we see a solid close above, preferably into the 11900s, the area surrounding the 2012 lows between 12000/100 or higher will come into focus."

==========

The chart was made on D1 timeframe with standard indicators of Metatrader 5 except the following indicators (free to download):

DailyFX Home
DailyFX Home
  • www.dailyfx.com
with what was presented to us as a valid confirmation of the three-month pattern. However, last week’s surge pushed the euro well above the ‘neckline’ and the trend-line running down off the September high. The combination of technical breaches significantly decreases the likelihood of the ‘H&S’ pattern still holding any real weight. One could...
 
Weekly Outlook: 2017, November 19 - November 26 (based on the article)

The US dollar had a mixed week amid all-important inflation numbers. The upcoming week features US durable goods orders, housing data, speeches from Yellen and Draghi, and the FOMC minutes as we head into Thanksgiving. Here are the highlights for the upcoming week.
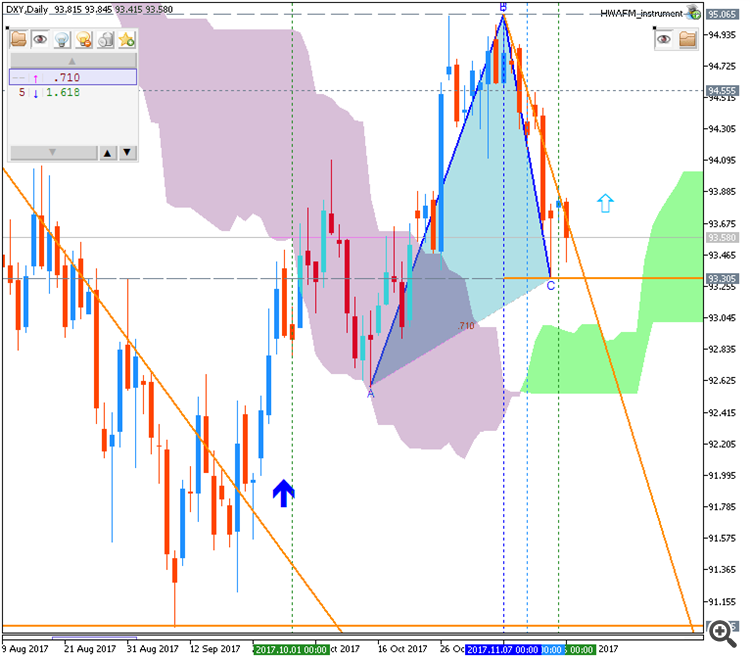

    1. Mario Draghi testifies Monday, 14:00. The president of the ECB faces European MPs in Brussels and may lay out an updated view of the euro-zone economies and the inflation situation. The next meeting of the ECB is only in mid-December, so Draghi will not be constrained by a “quiet period”.
    2. US Existing Home Sales: Tuesday, 15:00. An annual level of 5.42 million is on the cards.
    3. Janet Yellen talks, Tuesday, 23:00. The Chair of the Federal Reserve will speak in New York and may provide some interesting insights about the upcoming Fed meeting in December. Given she will be out of her job in February, Yellen may be freer to speak out.
    4. US Durable Goods Orders: Wednesday, 13:30. Both headline and core orders are expected to rise by 0.4%.
    5. US FOMC Meeting Minutes: Wednesday, 19:00. These are the minutes from the November meeting, which did not consist of new forecasts nor a press conference. While the Fed hinted that they are on course to raise rates in December, they changed their wording about inflation, describing it as “soft”. We will now get an insight into the discussion among the members. How worried are they about inflation? How pleased are they with job growth? It is unlikely that the minutes will change expectations about the December meeting, but the dollar will likely move.
    6. UK GDP (second release): Thursday, 9:30. The second release will likely confirm this growth rate.
    7. ECB Meeting Minutes: Thursday, 12:30.
    8. Thomas Jordan speaks Thursday, 16:30. The Governor of the Swiss National Bank will give a speech in Basel and will discuss the high current account surplus. The SNB continues intervening in the franc from time to time maintaining the surplus, keeping inflation from falling too much and helping Swiss exports.
    Forex Weekly Outlook - Nov. 20-24 2017 | Forex Crunch
    Forex Weekly Outlook - Nov. 20-24 2017 | Forex Crunch
    • 2017.11.17
    • Yohay Elam
    • www.forexcrunch.com
    The US dollar had a mixed week amid all-important inflation numbers. The upcoming week features US durable goods orders, housing data, speeches from Yellen and Draghi, and the FOMC minutes as we head into Thanksgiving. Here are the highlights for the upcoming week. Updates: Mario Draghi testifies Monday, 14:00. The president of the ECB faces...
     

    Weekly GBP/USD Outlook: 2017, November 19 - November 26 (based on the article)

    GBP/USD was under pressure as Brexit negotiations remain stuck and worries about the economy persist. The upcoming week features the GDP report and also the government’s Autumn Statement.
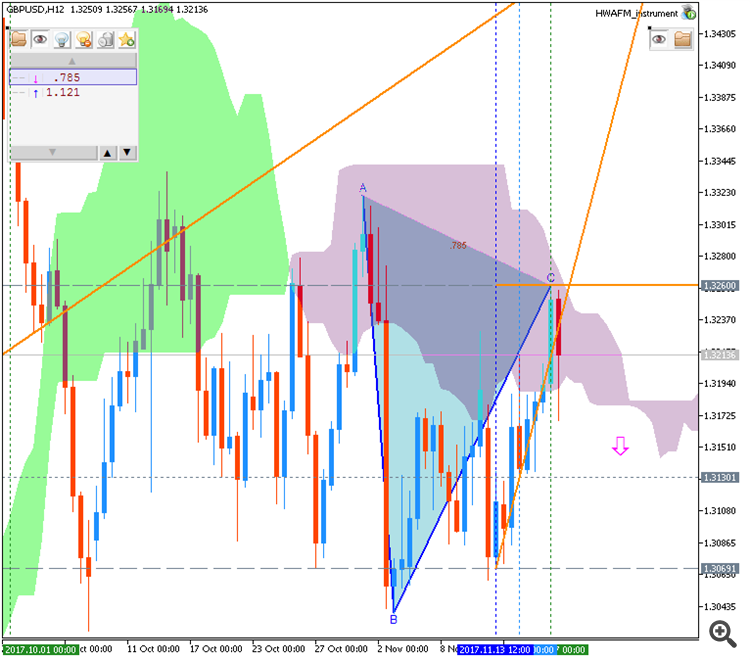

    1. Public Sector Net Borrowing: Tuesday, 9:30. A level of 6.6 billion is on the cards now.
    2. CBI Industrial Order Expectations: Tuesday, 11:00. A bounce back to positive ground, to +3 points, is forecast now.
    3. Autumn Forecast Statement: Wednesday, 12:30. Chancellor of the Exchequer Phillip Hammond will present new government policy in the British parliament. Fresh forecasts regarding growth, inflation, and employment will be of interest, but Brexit could grab the headlines. Hammond is one of the leaders of the soft-Brexit camp and the internal fights could surface in his appearance. The session could be long and volatile for the pound.
    4. UK GDP (second release): Thursday, 9:30. The second release will likely confirm this growth rate.
    5. CBI Realized Sales: Thursday, 11:00. Realized sales plunged from +42 to -36 in October and could rebound now. +5 is projected.
    6. High Street Lending: Friday, 9:30.
    GBP/USD Forecast Nov. 20-24 2017 | Forex Crunch
    GBP/USD Forecast Nov. 20-24 2017 | Forex Crunch
    • 2017.11.17
    • Yohay Elam
    • www.forexcrunch.com
    GBP/USD was under pressure as Brexit negotiations remain stuck and worries about the economy persist. The upcoming week features the GDP report and also the government’s Autumn Statement. Here are the key events and an updated technical analysis for GBP/USD. Updates: GBP/USD daily graph with resistance and support lines on it. Click to enlarge...
     

    NZD/USD - daily strong bearish; 0.6780 is the key (based on the article)

    Daily price is far below Ichimoku cloud in the bearish area of the chart: price is on testing the support level at 0.6780 together with descending triangle pattern to below for the primary bearish trend to be continuing.


    • "The New Zealand Dollar has broken support that has been holding it up since mid-May, hinting that deeper losses against the currency’s US namesake area ahead. The drop came amid broad-based risk aversion after US Special Counsel Robert Mueller subpoenaed the Trump campaign. From here, a daily close below the 38.2% Fibonacci expansionat 0.6745 sees the next downside barrier marked by the 50% level at 0.6672. Alternatively, a turn back above the 23.6% Fib at 0.6835 – now recast as resistance – opens the door for a retest of the 14.6% expansion at 0.6890."
    • "Technical and risk/reward parameters appeared acceptable to attempt a short position and NZD/USD was sold at 0.6804, initially targeting 0.6745. A stop-loss will be activated on a daily close above 0.6837. Profit on half of the trade will be booked at the stop moved to breakeven if (and when) the first objective is met."

    ============

    Chart was made on MT5 with BrainTrading system from this post (free to download) as well as the following indicators from CodeBase:

    All about BrainTrading system for MT5:

    About BrainTrending system in general:

    • TSD DS jurik BrainTrading system - the key thread
    • TSD BrainTrading Stochastics system - the post
    • BrainTrading Semi-Manual EA for M30 timeframe system - the thread 
    • The differences between Brainwashing and BrainTrading system - the post.
     

    Apple - daily ranging bullish with possible correction (based on the article)

    Daily share price is located far above Ichimoku cloud in the bullish area of the chart. The price is on bullish ranging within the followiung support/resistance levels:

    • 176.18 resistance level located in thge beginning of the bullish trend to be resumed, and
    • 168.38 support level located in the beginning of the secondary correction to be started.

    Descending triangle pattern was formed by the price to be crossed to below for the correction to be started in the near future.


    • "Two years ago, Apple’s penchant for keeping its artificial intelligence research secret was notorious throughout the industry. But since then, Apple has made a big show of ramping up its efforts in AI."
    • "Nowadays, the race among tech giants to lead in artificial intelligence — a term generally used for software that allows computers to learn and improve tasks on their own — is heating up, and Apple clearly wants to be in the running. AI is a technology that underpins self-driving cars and voice assistants like Siri and Amazon’s Alexa, and tech giants like Google, Facebook, Amazon, Microsoft are in a fierce competition to recruit the top minds in AI and offer the most advanced applications of the technology. (According to a recent report in The New York Times, salaries for AI experts can range from $500,000 to $120 million annually.) For years, Apple was perceived as lagging in the field, largely because of its tight-lipped approach to research. Now, as the availability of top AI talent has declined due to booming demand for expertise in the field, the company has recently sought to show it can respond to the conventions of the AI community, where publishing frequently is a must."
    • "At the iPhone event this past September, people watching for clues on Apple’s AI progress were treated to a slew of AI-infused features in the new iPhones. At the event, Apple executives and presenters explained the new iPhone X’s features using terminology familiar to the AI-literate: the company's new A11 Bionic chip includes a so-called "Neural Engine" designed for artificial intelligence processing tasks like mathematically modeling the human face for the iPhone X's new FaceID authentication feature. Crucially, the chip uses machine learning to evolve recognition of face over time, and even if you grow a beard or wear glasses."

    ==========

    Chart was made on MT5 with PriceChannel Parabolic system (MT5) from this post (free to download) as well as the following indicators from CodeBase:

    A Year After Pledging Openness, Apple Still Falls Behind On AI
    A Year After Pledging Openness, Apple Still Falls Behind On AI
    • www.buzzfeed.com
    "Apple is the NSA of AI." That was how storied computer scientist and Stanford University adjunct professor Jerry Kaplan described Apple's unconventional approach to artificial intelligence research in 2016. A year later, his assessment of the company is largely the same — despite Apple's pledge to more fully engage with the research community...
    Reason: