
Indicators tab
This tab focuses on market analysis and signal generation.
The trading tab is the other main tab, beside this and it has its own sub-tabs like Open, Close, Filters, and Manage (Trail through Breakeven) plus Chart tools live there — see those topic guides, not this post. 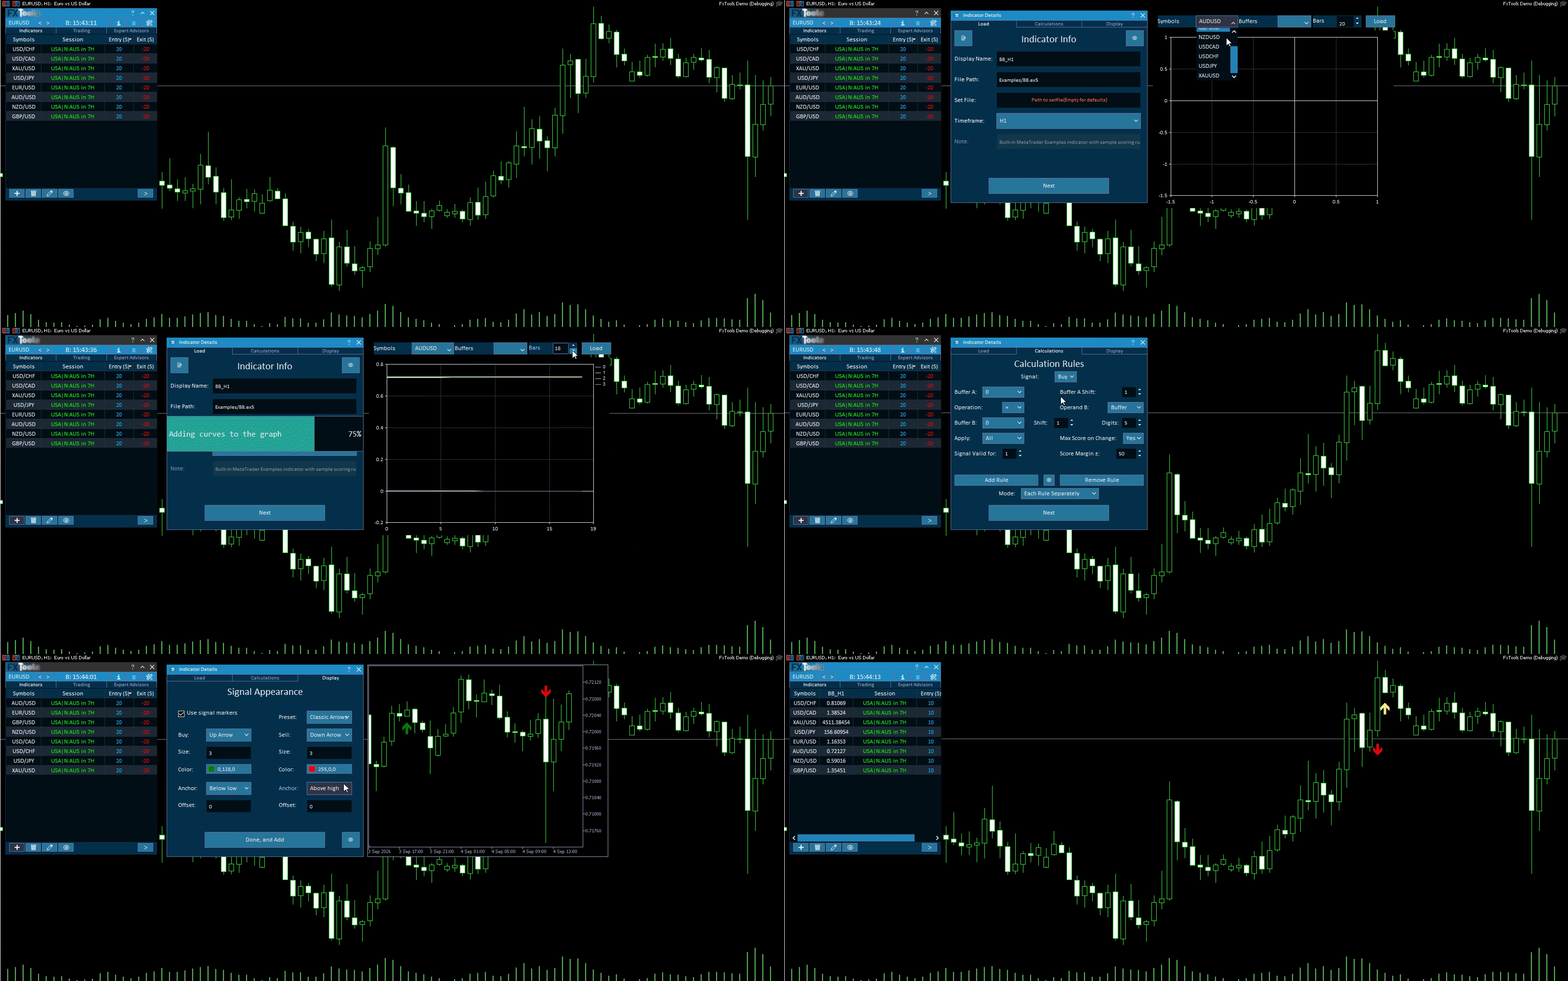
Here you can: 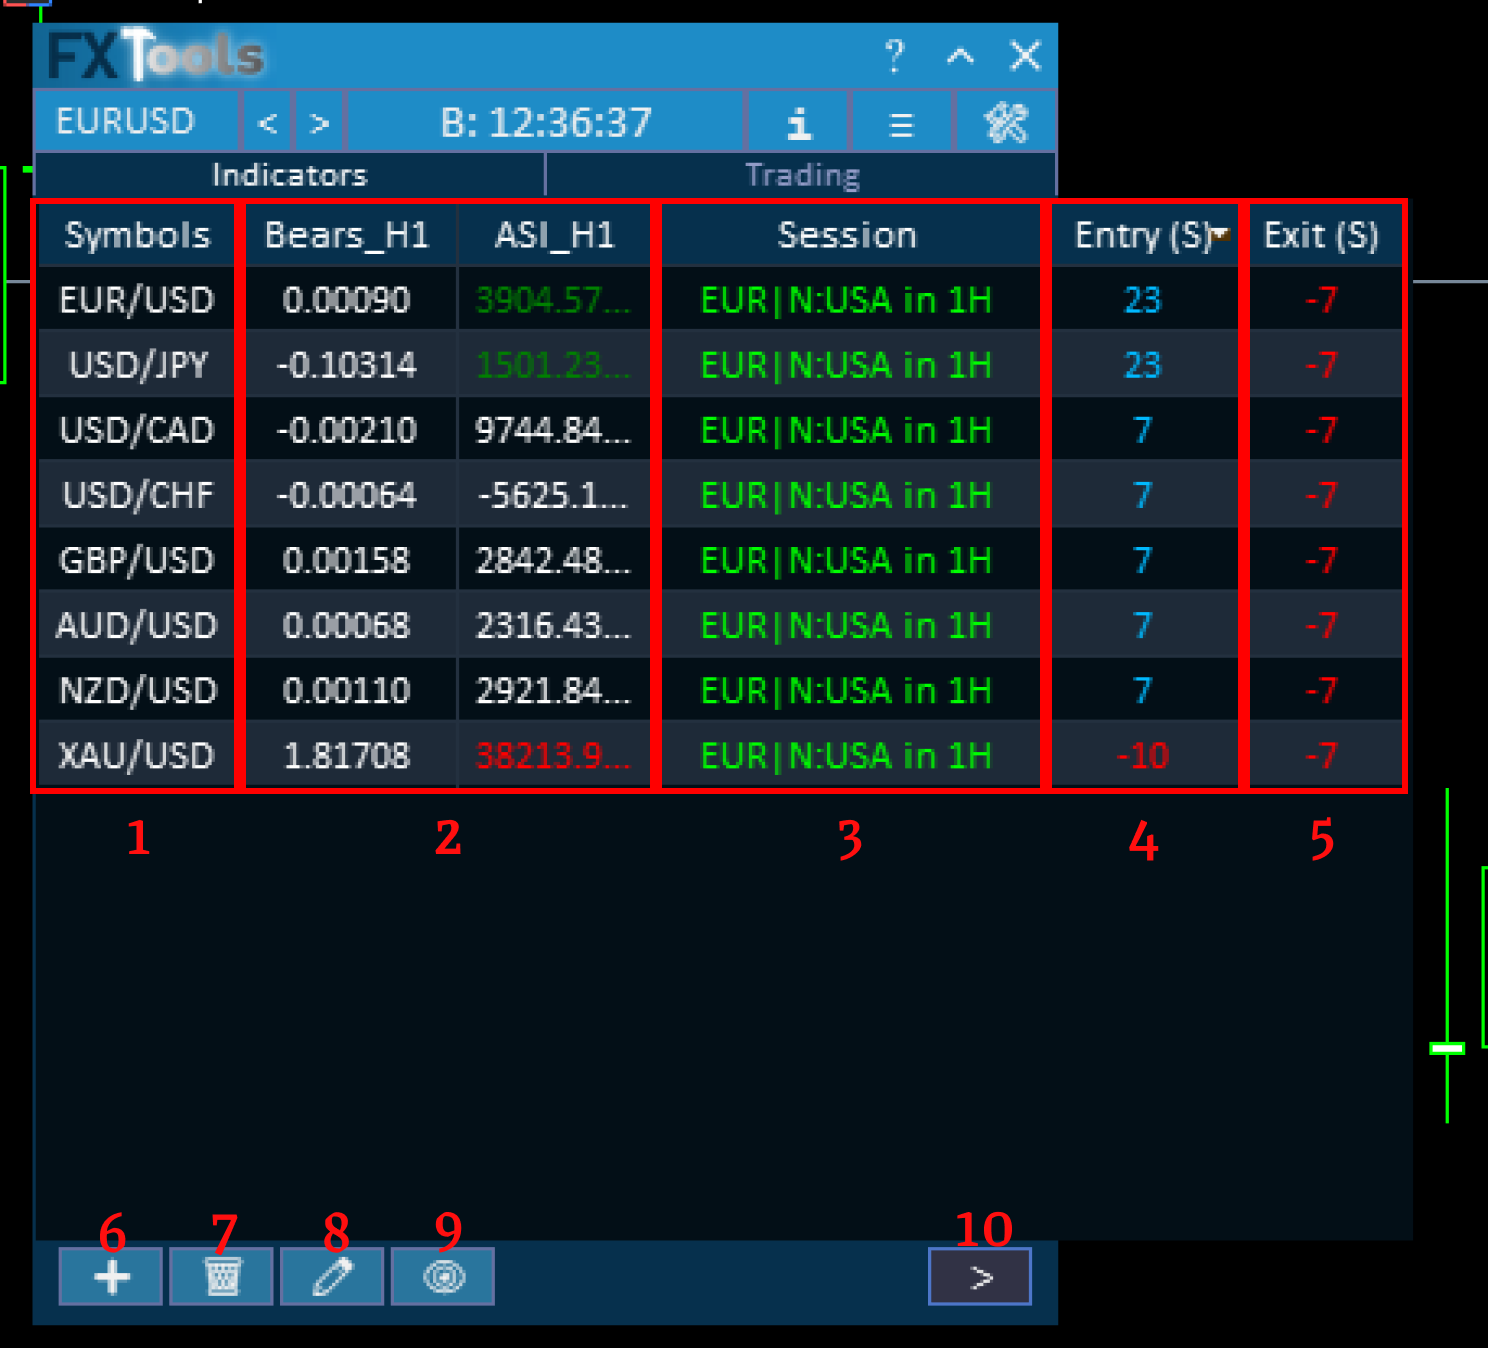
• Load indicators
• Adjust entry and exit scoring rules
• Monitor all Market Watch symbols in one table
Many common indicators are already available, and more may be added through updates.
________________________________________
Watch table
Inside the Indicators tab, the dashboard displays a structured table showing signals across symbols.
1. Symbol Column
Each row corresponds to a symbol from Market Watch.
To change which symbols appear, simply modify your Market Watch list.
________________________________________
2. Loaded Indicator Columns
This column shows an example of a loaded indicator.
In the image, the example is an AMA indicator on the D1 timeframe.
It displays the indicator buffer value, which influences the Entry Score and Exit Score calculations.
(Your dashboard may show different indicators depending on what you load.)
________________________________________
3. Session Column
A built-in indicator showing current and upcoming trading sessions.
Example:
USA | N:AUD in 3H
Means the current session is New York and the next session will be Australia in 3 hours.
________________________________________
4. Entry Score Column
Represents the calculated trade entry strength.
• Higher values indicate stronger entry potential.
| Blue values suggest buy opportunities. |
| Red values suggest sell opportunities. |
________________________________________
5. Exit Score Column
Represents the calculated trade exit strength.
• Higher values suggest better exit conditions.
• Red values indicate stronger signals to exit sell trades.
• Blue values indicate stronger signals to exit buy trades.
________________________________________
Indicator Management Controls
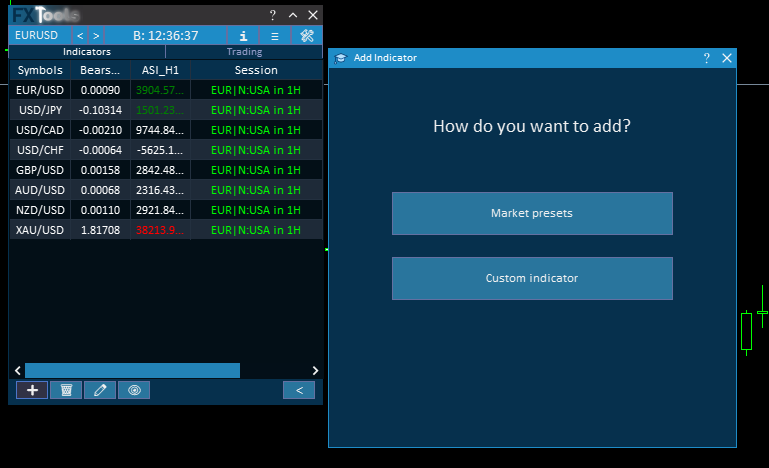
6. Add Indicator
Opens a guided window allowing you to add custom indicators to the table.
Clicking Add Indicator (+) opens the Add Indicator chooser. The title asks How do you want to add?
Two buttons:
- Market presets — opens the Market Preset Browser (one-click add, or customize).
- Custom indicator — opens the Indicator Details wizard: Load / Calculations / Display.
7. Delete Indicator
Trash icon on the Indicators toolbar. Opens Choose Indicators to Remove. Tick one or more custom indicators, then Submit — those columns leave the table and the indicator is unloaded (handles, rules, chart markers). Session and News are not in this list; you cannot delete the built-ins.
8. Edit Indicator Settings
Pencil icon. Opens Choose Indicator to Edit. Pick one loaded custom indicator (single select) and Submit. That opens the same Indicator Details wizard (Load / Calculations / Display) already filled from that indicator. Change what you need, then Done, and Add. If the display name already exists, a Confirm Edit window asks you to confirm before the existing column is replaced.
9. Show / Hide Indicators
Eye icon. Opens Choose Indicators to Hide/Show (heading inside: Choose Indicators to Show). This list includes Session and News plus every custom indicator. Tick what should stay visible in the watch table, untick what should hide, then Submit. Hidden columns are only taken off the table — the indicator is still loaded. Use Delete (7) when you want it gone.
Some indicators, such as News and Session, are built into the dashboard.
10. Table Width
The > button on the right of the toolbar. Press it to widen the table so every column is visible at once — the table grows past the dashboard instead of clipping. Press again (<) to keep the table inside the window with a horizontal scroll.
Add indicator window
Market Preset Browser
From the chooser, Market presets opens a window titled Market Presets. The heading inside is Choose a Market Preset.
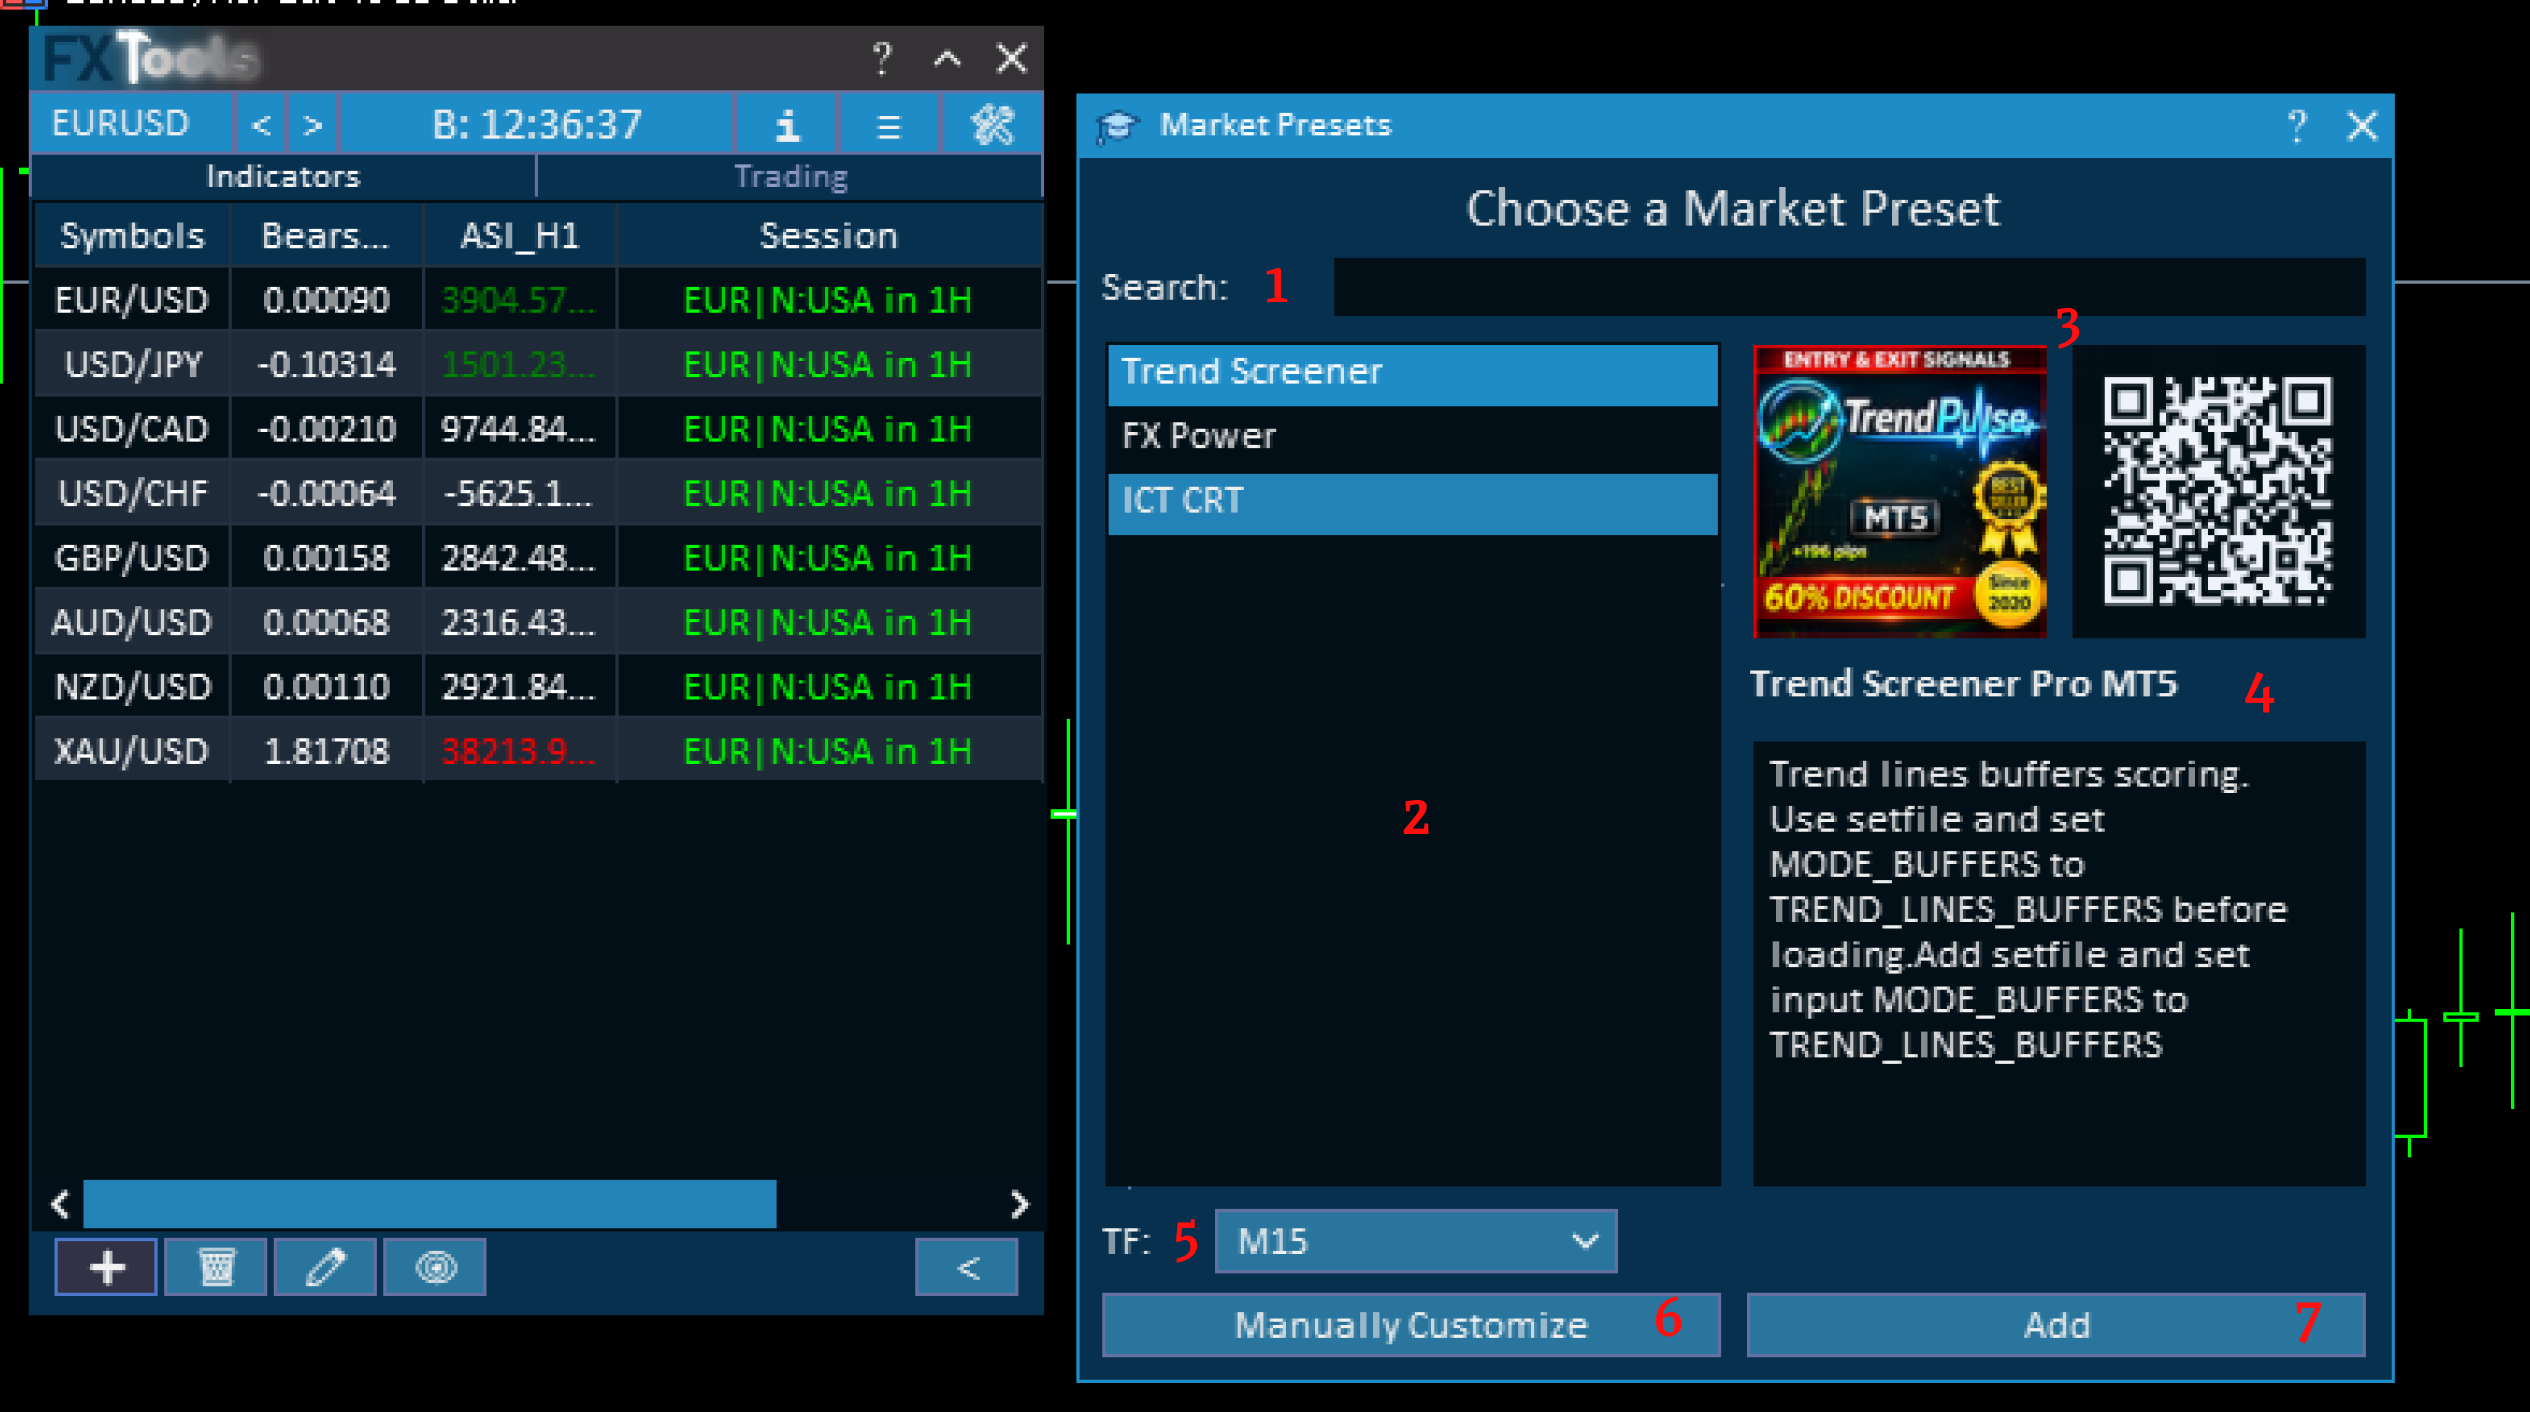
1. Search
Filter the preset list by name.
________________________________________
2. Preset list
Left column. Click a row to show that preset’s details.
________________________________________
3. Logo and QR
Right column: product logo and a QR to the Market page.
________________________________________
4. Name and description
Title plus a read-only blurb for the selected preset.
________________________________________
5. TF
Timeframe dropdown above the footer. Used when you Add or Manually Customize.
________________________________________
6. Manually Customize
Opens the Load / Calculations / Display wizard prefilled from this preset so you can change rules or appearance.
________________________________________
7. Add
Loads the selected preset into the watch table in one step (no wizard walk).
If you need to change settings for the selected preset — scoring rules, how it draws, or the file itself — click Manually Customize. That opens the wizard below with the preset already filled in, so you can adjust what you need and then add it to the table.
Adding Indicator Window – Load Tab Overview
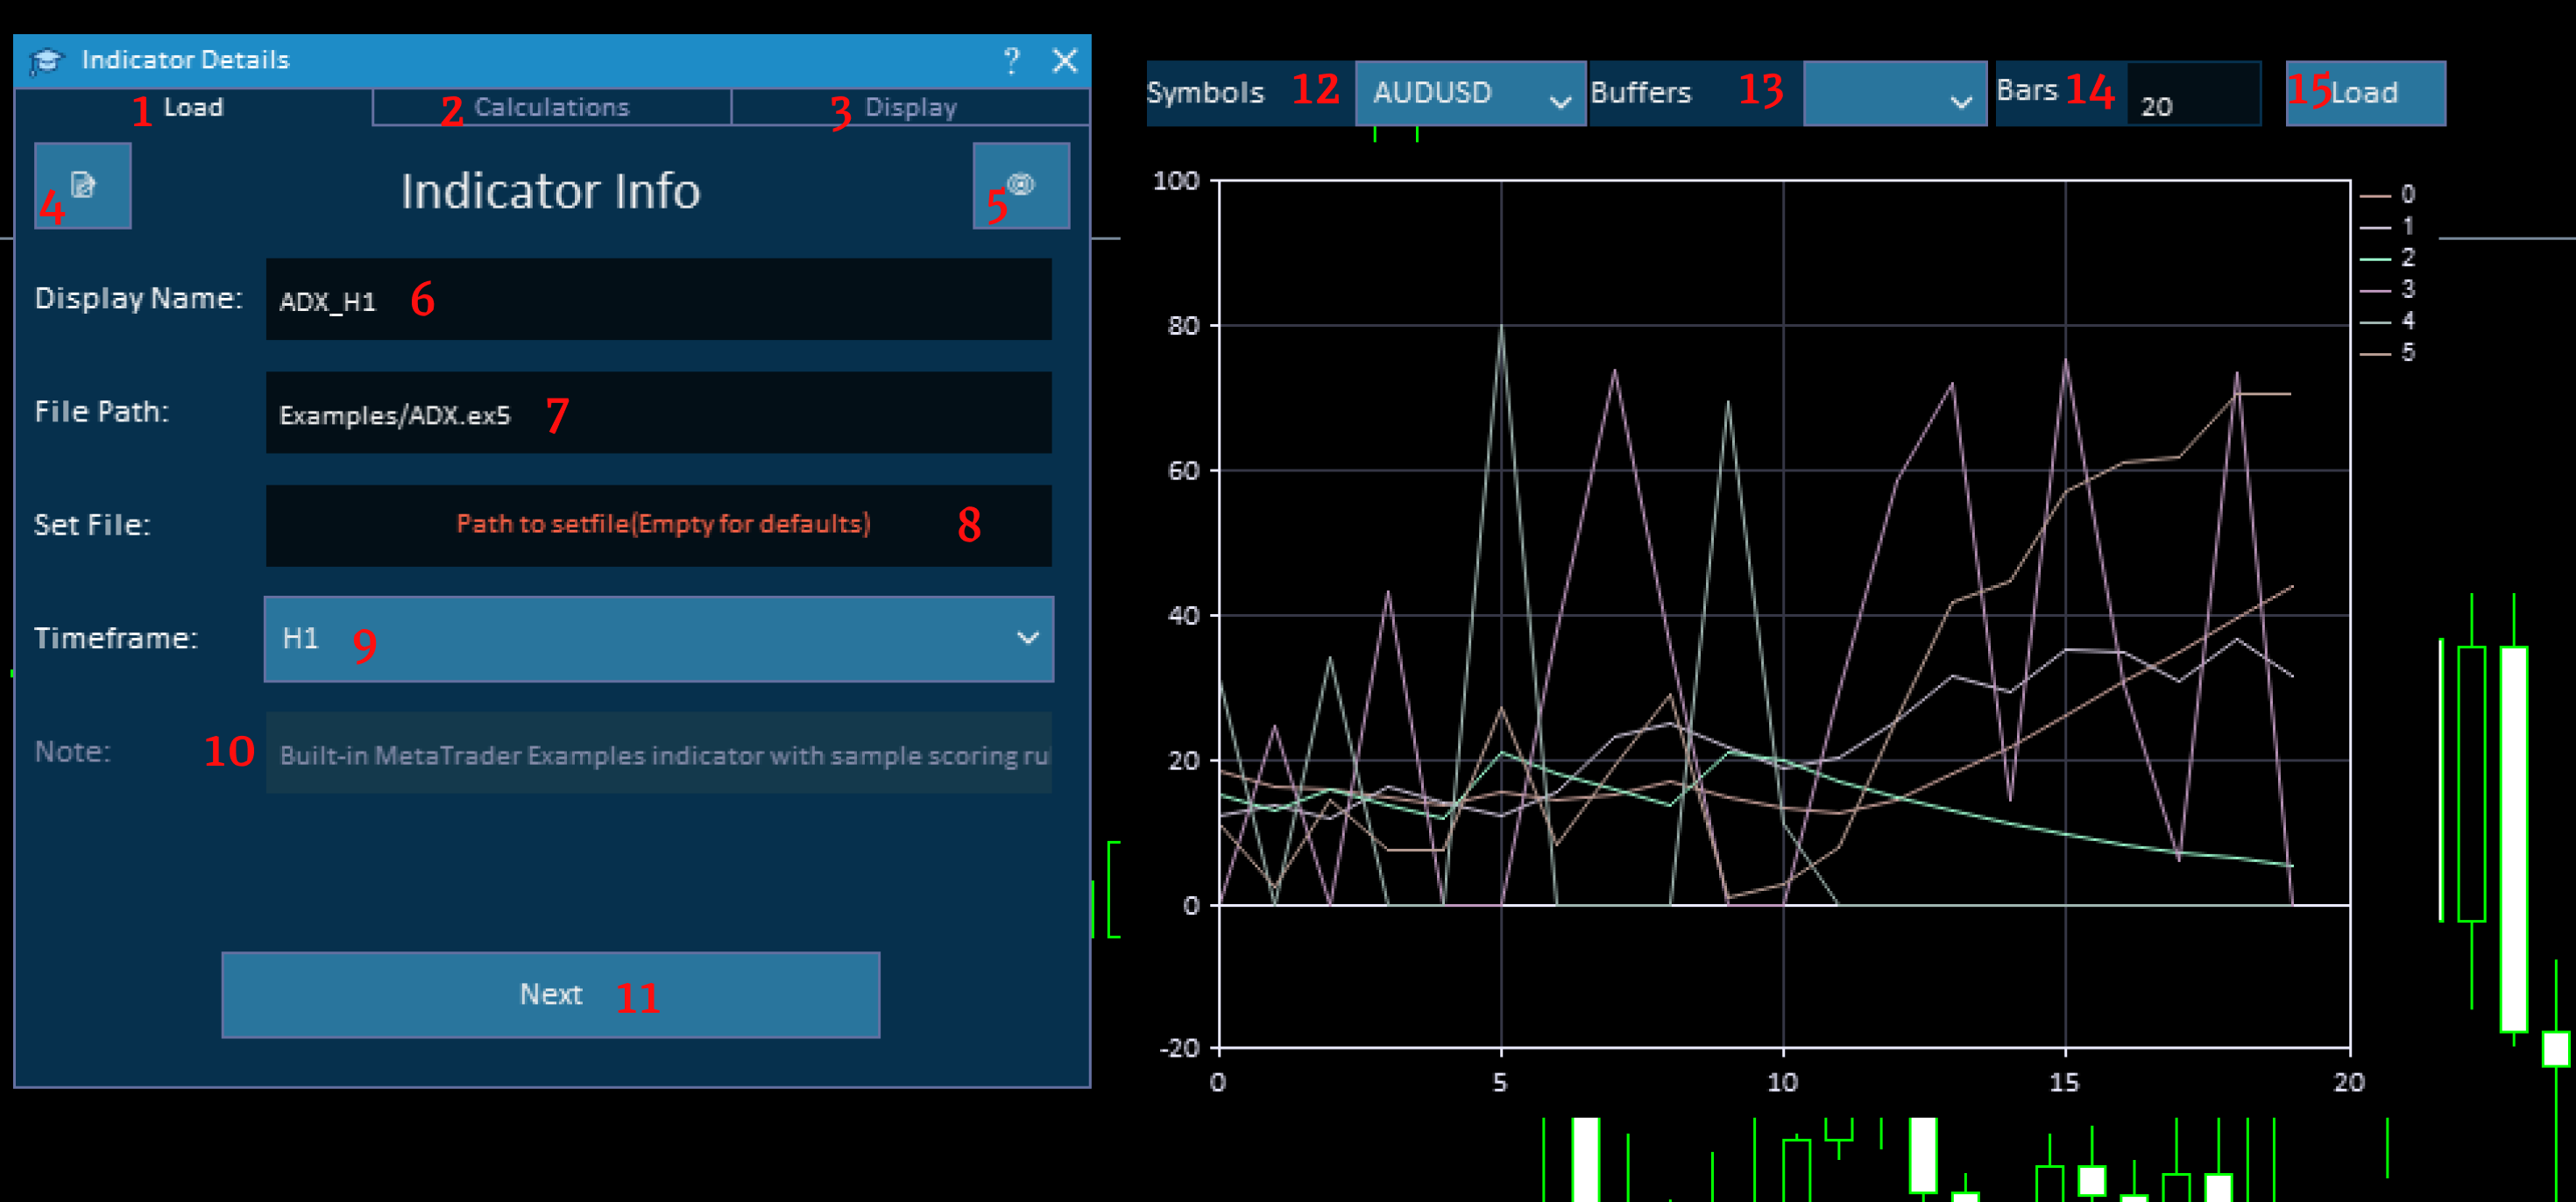
Custom indicator on the chooser (or Manually Customize on a preset) opens Indicator Details. The Load tab heading in the window is Indicator Info (the tab itself is still named Load).
The first tab in this window is the Load tab, where you select the indicator file and its basic settings.
Below is a detailed explanation of each element in this tab.
1. Load Tab
• This is the first step of adding an indicator.
Here you specify the indicator file and, optionally, its preset configuration file.________________________________________
2. Calculations Tab
• After loading the indicator, you can move to the Calculations tab, where you define how the indicator contributes to scoring and signal logic.
This tab will be explained in its own section.________________________________________
3. Display Tab
• The Display tab controls how the indicator appears on the chart and in the dashboard table.
This will also be explained separately.________________________________________
• The paper icon on the toolbar fills the fields with a sample configuration using built-in MetaTrader indicators.
This is useful for learning how the loading fields should be completed.________________________________________
Toolbar eye icon. The graph opens on this Load tab (not a separate window).
• After loading an indicator, clicking this button opens a preview where you can:
- Choose a symbol
- Select the buffer number
- Choose how many bars to load
• After pressing Load, you will see how the indicator behaves on a real chart and which buffer produces which values.
This helps identify the correct buffer for scoring calculations.________________________________________
6. Display Name:
• This field defines how the indicator name appears in the dashboard table.
• We recommend using a short name so it fits neatly in the column header.
You can choose any name you prefer.________________________________________
7. File Path:
• Here you enter the path to the indicator file.
• The indicator must be located inside the Indicators folder of your MetaTrader Data directory.
- If it is inside a subfolder, include the folder name
Example:
Examples/Bears.ex5- If it is directly inside the Indicators folder, simply write:
Bears.ex5• Make sure the name matches the file exactly and includes the .ex5 extension.
________________________________________
8. Set File:
• If you want to load the indicator with default settings, leave this field empty.
• Otherwise, you can specify a .set file stored in the Presets folder of the Data directory.
- If inside a subfolder, include the folder name
- Otherwise, just write the filename, for example:
Bears.set________________________________________
9. Timeframe Selection
• Choose the timeframe on which the indicator should run.
A dropdown list of common timeframes is provided for convenience.________________________________________
10. Note:
• This field is locked and is used mainly for Market indicators.
It may display warnings or important notes about the selected indicator before loading.________________________________________
• After filling all required fields, click Next to proceed.
• If any field contains an error, it will be highlighted in red so you can correct it.
________________________________________
12. Symbols
Preview-row dropdown. Visible after you open the eye (5). Pick which symbol the buffer graph uses.
________________________________________
13. Buffers
Preview-row dropdown. Tick which buffer indexes to plot. The list fills after you press Load (15); it can look empty until then.
________________________________________
14. Bars
Preview-row spin. How many bars to copy into the graph (default 20).
________________________________________
15. Load
Preview-row button. Reads the file on the chosen symbol and timeframe, fills Buffers, and draws the graph. Display Name and File Path must be valid first.
Adding Indicator Window – Calculations Tab Overview
Second Tab of Adding Indicators
What is this tab for?
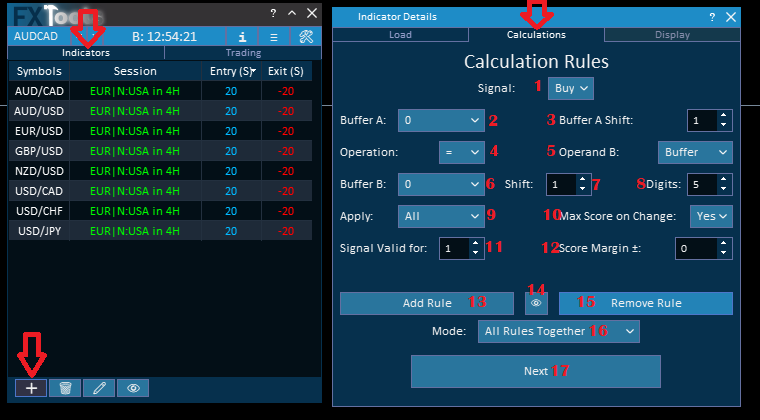
The Calculations tab is a Rules Builder. The heading in the window is Calculation Rules.
These rules tell the dashboard how to score your indicator's signals.
📌 Important: To use this tab, you need some knowledge about the indicator, specifically its buffer numbers (the value you want to base the signal on). If you don't know this information, you can ask the indicator's developer.
How It Works
In this tab, you adjust and determine rules for each entry:
When to get a Buy signal
When to get a Sell signal
How much maximum score you want for each entry
You can set multiple different conditions for an entry and adjust them so that:
All conditions must be met for the signal to appear (AND logic)
Any condition separately triggers the entry signal (OR logic)
You can also set rules for each symbol separately or for all symbols together.
Important Notes
Each time you set the conditions and click Add Rule, you add one rule
If you want multiple rules, you must select each entry rule settings and click Add Rule again
If you only enter a rule for Buy or Sell (but not both), the opposite condition will be calculated automatically for the other direction
Detailed Field Explanations
1. Signal
Here you select the signal direction:
Buy – Conditions for a buy (long) entry signal
Sell – Conditions for a sell (short) entry signal
2. Buffer A
For each entry, you have two variables that you want to compare.
Buffer A is the first value of these two. You set which value of the indicator you want to use.
Example: "If the indicator's first value is bigger than the candle close, then it's a buy signal"
📌 Technical Note: Buffers are numbered starting from 0 (the first value of the indicator is buffer index 0). The dashboard automatically detects available buffers in the indicator so you can choose from them. If you don't know which buffer corresponds to what you see on the chart, ask the indicator's developer.
3. Buffer A Shift
Here you choose the shift of Buffer A.
Shift moves the buffer value forward or backward in time. For example, 1 means use the value from 1 candle ago.
4. Operation
Here you choose the comparison operator between the two values (Buffer A and Operand B).
5. Operand B
Unlike the first value (which is always a buffer of the indicator), the second value (Operand B) can be chosen from different options.
6. Buffer B
This field appears only if you choose "Buffer" in Operand B.
Here you select a different buffer of the indicator (cannot be the same as Buffer A).
If you choose OHLC in Operand B, this area will show a list of candle values instead (Open, High, Low and Close).
7. Shift (for Buffer B)
This is the shift for Buffer B. It works the same way as Buffer A Shift (item 3).
8. Digits
You set the digits (decimal places) of Buffer B value.
By default, this is the same as the symbol's digit count (e.g., 5 digits for most forex pairs).
9. Apply
Here you choose where to apply the rule.
10. Max Score on Change
What does this do?
The dashboard's calculation has a max score curve. When you set this to Yes:
The first time the condition is met, it receives the maximum score at that exact point
After that, the score slowly lowers over time
This is useful for signals that are only valuable at the exact moment of change (e.g., a crossover) and lose value afterward.
11. Signal Valid for:
You set how many candles the signal will remain valid.
After this many candles pass without the signal being acted upon, the signal expires.
Example: If you set 3, the signal is valid for 3 candles after it first appears.
12. Score Margin ±:
You set the maximum score for your signal here.
📌 Note: The score should be positive for both Buy and Sell signals.
13. Add Rule
After adjusting all the settings above, click this button to add the rule to your list.
14. Preview (eye)
Eye icon between Add Rule and Remove Rule. Opens the rules list on this tab.
Click this button to see the list of rules you have already added.
15. Remove Rule
When you click the eye, each rule in the list has a checkbox. You can:
Select the checkbox of the rule(s) you want to remove
Click Remove Rule to delete them
16. Mode:
Dropdown values are All Rules Together and Each Rule Separately.
After adding all your rules, you select the mode for how they should be evaluated:
📌 Note: Buy and Sell rules are always calculated separately.
17. Next
After finishing your calculations, click Next to go to the next tab.
Operators Table
| Operator | Meaning |
|---|---|
| > | Greater than |
| < | Smaller than |
| >= | Greater than or equal to |
| <= | Smaller than or equal to |
| = | Equal to |
Operand B Options
| Option | Meaning |
|---|---|
| (1) Buffer | Another buffer of the indicator (must be different from Buffer A) |
| (2) Constant | A fixed number you enter (e.g., -1, 1, 1.5, -10.9) |
| (3) Zero | The second value is always 0 |
| (4) Price | The second value is the Ask or Bid price (you choose from dropdown) – useful to check if an indicator value has crossed the current market price |
| (5) OHLC | Candle values: Open, High, Low, Close – useful to compare indicator values with candle prices |
| (6) Not Empty | For indicators that only appear on some candles (like arrows or dots). You only need to check if the value appeared (is not empty) – that becomes your entry signal |
Apply Options
| Option | Meaning |
|---|---|
| All | The rule applies to all symbols |
| Specific Symbol | The rule applies only to the specific symbol you select. This is useful when an indicator has values that are specific to one symbol only. |
Mode Options
The dropdown uses All Rules Together and Each Rule Separately.
| Mode | Meaning |
|---|---|
| All Rules Together | You only get an entry signal when every rule for that direction (Buy or Sell) is satisfied at the same time |
| Each Rule Separately | You get an entry signal when at least one rule for that direction is satisfied |
Adding Indicator Window – Display Tab Overview

After finishing adding the calculation rules for your indicator, you go to the third and last sub-tab of adding indicators, which is Display.
What is this tab for?
The Display tab title is Signal Appearance. Controls: Use signal markers, Preset, then two columns (Buy: left, Sell: right) for icon, Size:, Color:, Anchor:, and Offset: — Anchor and Offset are separate rows, one control pair each. Footer: Done, and Add plus an eye that opens a preview chart on this tab.
Here you set how to show Buy and Sell signals on the chart for this indicator.
Detailed Field Explanations
Anchor: and Offset: are two separate rows (Buy left, Sell right).
1. Use signal markers
Master checkbox. Off until you tick it; appearance rows stay locked until this is on.
2. Preset:
Style preset for the Buy/Sell appearance pair: Classic Arrows, Dots, Check / Cross, Stars.
3. Buy: / Sell:
Dropdowns labeled Buy: (left) and Sell: (right) for the Wingdings icon.
4. Size:
One Size: spin per side (Buy column / Sell column).
5. Color:
Color picker per side. Labels are Color:. Defaults: Buy green, Sell red.
6. Anchor:
Own row, two dropdowns. Where the marker sits on the bar. Values: Below low, Above high. Classic Arrows defaults: Buy Below low, Sell Above high.
7. Offset:
Own row under Anchor, two spins. Extra distance from the anchor. Range −10 to 10; 0 is flush with the bar.
8. Done, and Add
Footer button Done, and Add loads the indicator into the watch table using the Calculations rules. May take a while with many Market Watch symbols.
9. Preview (eye)
Eye button next to Done opens a preview chart on this tab (not a second window) you can see the markers in action.
Summary – Adding an Indicator Workflow
After completing all three tabs and clicking Done, and Add, your custom indicator is ready to be used with the dashboard. The chooser / Market presets path can skip the wizard.
| Step | Tab | Action |
|---|---|---|
| 1 | Chooser | Market presets (browser Add or Manually Customize) or Custom indicator |
| 2 | Load | Select the indicator file and basic properties |
| 3 | Calculations | Set buffer rules, comparisons, scoring, and logic |
| 4 | Display | Tick Use signal markers, then Preset / icon / Size / Color / Anchor / Offset (Anchor and Offset are separate rows); Done, and Add |
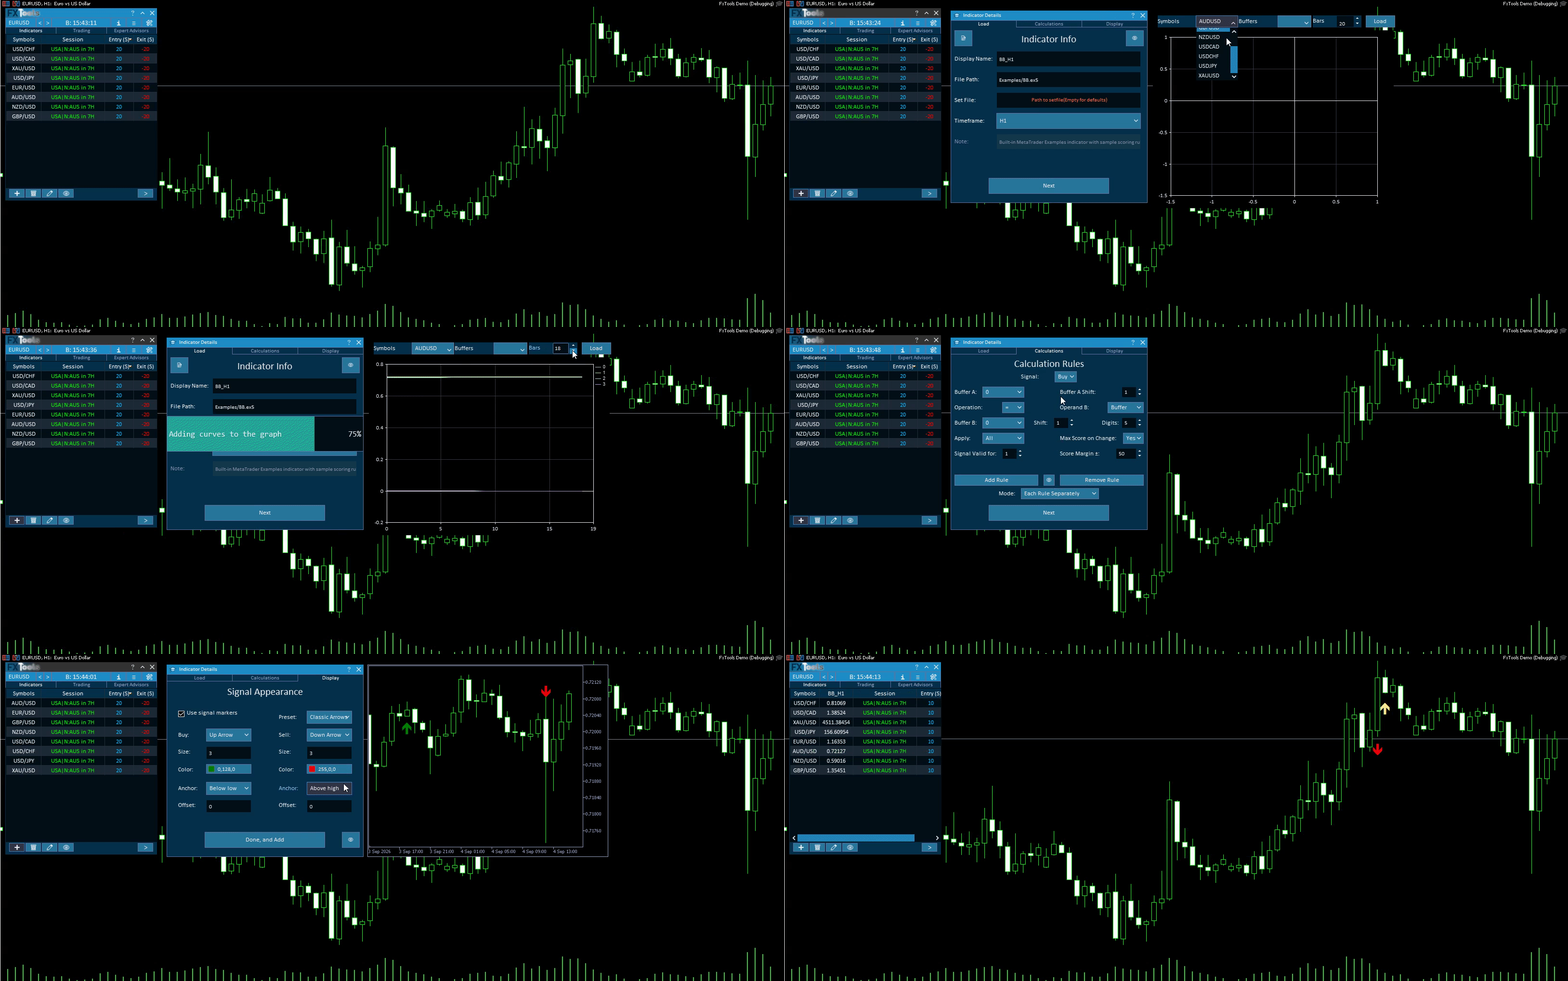
The clip below walks the Custom path end to end: chooser → Load (file, timeframe, preview) → Calculations (rules) → Display (markers) → Done, and Add. Market presets can skip that walk with one-click Add.
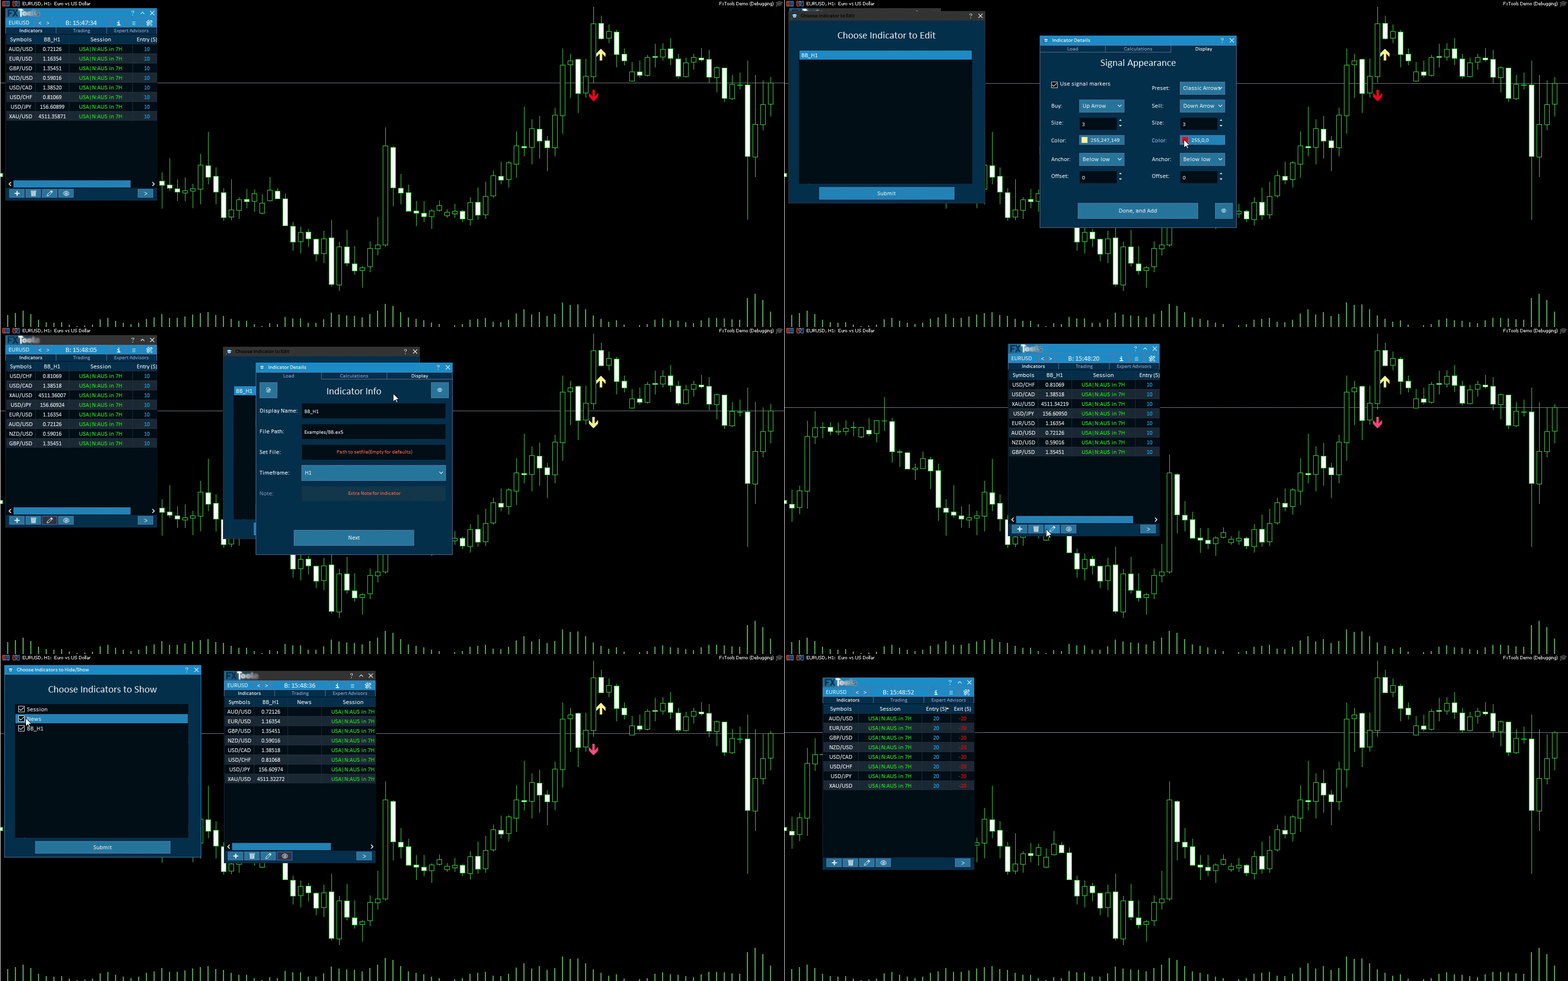
After an indicator is on the table, the same toolbar manages it. Edit (pencil) reopens the three-tab wizard for one selected indicator; confirm if the name already exists. Show / Hide (eye) only changes which columns you see — Session and News are in that list too. Delete (trash) unloads the custom indicator for good; built-ins stay.
Links
- Part 0 Overall Guide — four work places (dashboard, shortcut bar, overlays, chart)
- Part 1 Shortcut bar — shortcut bar and min mode
- Part 2 Overlays — Info and Settings
- Part 3 Indicators — watch table and add indicator
- Part 4 Open — Instant, Pending, By Time (coming soon)
- Part 5 Close — Manual, Auto, Partial
- Part 6 Filters — News, Prop firm, Time
- Part 7 Trail — TrailStop and shared distance modes
- Part 8 Grid — same-direction legs after price moves in favor
- Part 9 Martingale — extra legs as the trade moves into loss
- Part 10 Recovery — Recovery Zone hedge channel
- Part 11 Breakeven — move SL toward the open once in profit
- Part 12 Chart — Easy Position Manager and Easy Trade Deck
- Part 13 Expert Advisors — strategy cards by magic, live vs backtest