
Moving Average Crossover Strategy: How to Trade Crossovers for Better Forex Entries

Moving Average Crossover Strategy:
How to Trade Crossovers for Better Forex Entries
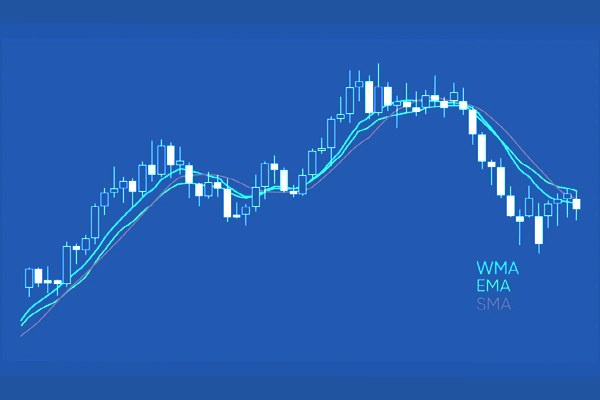
The moving average crossover strategy is one of the most popular trend-following methods used by forex and financial market traders. The concept is simple: place two moving averages with different periods on the chart and watch for a crossover that may indicate a change in market momentum or trend direction.
But simplicity does not mean every crossover is a good trading opportunity.
Experienced traders know that a crossover signal needs market context. Trend direction, volatility, support and resistance, price action, timeframe, and risk management can all determine whether a signal becomes a profitable trade or a false entry.
In this guide, we will explain how the moving average crossover strategy works, how to choose MA periods, how to identify bullish and bearish crossover signals, and how to reduce the impact of false signals and whipsawing.
What Is a Moving Average Crossover?
A moving average smooths price data over a specific number of candles. Instead of focusing on every individual price movement, traders use the moving average to see the underlying direction of the market.
There are two common types of moving averages used in crossover trading:
Simple Moving Average (SMA)
The SMA calculates the average closing price over a defined number of periods. For example, a 50 SMA represents the average price of the previous 50 candles.
SMA reacts more slowly to new price movements, which can make it useful for identifying broader market trends.
Exponential Moving Average (EMA)
The EMA gives greater weight to recent prices. As a result, it reacts faster to current market conditions than an SMA.
This makes EMA combinations particularly popular among intraday traders and scalpers who want earlier signals.
The basic idea behind a crossover is straightforward: when a faster moving average crosses a slower moving average, traders interpret the event as a possible change in momentum.
How the Moving Average Crossover Signal Works
The two most important crossover signals are the bullish crossover and bearish crossover.
Bullish Crossover and Golden Cross
A bullish crossover occurs when the faster moving average crosses above the slower moving average.
For example, if the 50 SMA moves above the 200 SMA, traders may interpret this as evidence that buying pressure is increasing relative to the longer-term trend.
A major bullish crossover involving the 50 SMA and 200 SMA is commonly known as a golden cross.
However, traders should not treat the crossover itself as an automatic BUY command. The market may already have moved significantly before the crossover becomes visible.
A stronger setup may occur when the crossover is supported by:
-
Higher highs and higher lows
-
Strong bullish price action
-
Increasing momentum
-
Support holding below the entry
-
Healthy market volatility
-
Confirmation from another technical tool
Bearish Crossover and Death Cross
A bearish crossover occurs when the faster moving average crosses below the slower moving average.
For example, when the 50 SMA moves below the 200 SMA, traders commonly refer to the event as a death cross.
This can indicate that bearish momentum is becoming stronger and that sellers are gaining control.
Again, the signal should be evaluated within the broader market structure. A bearish crossover in the middle of a strong support zone may have a very different meaning from a bearish crossover occurring after a confirmed breakdown.
Best Moving Average Settings for Different Trading Styles
There is no universal "best" moving average combination.
The correct settings depend on your trading style, timeframe, instrument, volatility and tolerance for delayed signals.
9 EMA and 21 EMA
The 9 EMA / 21 EMA combination reacts quickly to price movements and is commonly used by short-term and intraday traders.
Because these averages are relatively fast, they can produce many signals. The advantage is earlier detection of momentum changes; the disadvantage is increased exposure to false signals.
This combination can be useful for traders operating on lower timeframes, particularly when combined with a strong trend filter.
20 SMA and 50 SMA
The 20 SMA / 50 SMA combination provides a slower and generally smoother approach.
Swing traders can use these averages to monitor intermediate trends on charts such as H4 and Daily.
Fewer crossover signals can mean less market noise, but it also means the trader may enter later after a trend has already started.
50 SMA and 200 SMA
The 50 SMA / 200 SMA combination is one of the most recognized long-term crossover setups.
A golden cross can indicate strengthening bullish conditions, while a death cross can indicate weakening market structure.
The main disadvantage is lag. By the time the crossover occurs, a substantial part of the trend may already be underway.
The general rule is simple:
Shorter periods = more signals and more noise.
Longer periods = fewer signals and more lag.
The goal is not to find the fastest signal. The goal is to find a combination that fits your trading system.
Where Moving Average Crossover Strategies Work Best
The moving average crossover strategy performs best when the market is trending.
In an uptrend, price typically creates higher highs and higher lows. The faster MA tends to remain above the slower MA, and pullbacks can provide opportunities to join the existing trend.
In a downtrend, lower highs and lower lows create the opposite structure.
This is where crossover systems can perform well because the moving averages are designed to follow directional momentum.
Trending Markets
A clean trend allows the moving averages to separate and maintain direction.
For example, after a bullish crossover, price may pull back toward the moving averages before continuing higher. Traders can use this behavior together with support, resistance or price action to look for confirmation.
Ranging and Choppy Markets
The biggest weakness of crossover systems appears during sideways markets.
When price moves repeatedly above and below a relatively flat moving average, the fast MA can cross the slow MA several times.
This creates false signals and can result in repeated stop-loss hits.
This behavior is commonly known as whipsawing.
A trader who enters every crossover without considering market structure may suffer a series of small losses even though the strategy works well during strong trends.
How to Reduce False Crossover Signals
A professional trading approach does not rely on a single indicator.
Instead, traders can use additional information to determine whether a crossover has enough market context.
Use Price Action Confirmation
Price action can help determine whether the crossover is supported by actual market structure.
A bullish crossover near a strong support level may have more significance than the same crossover appearing in the middle of a wide trading range.
Likewise, a bearish crossover accompanied by a strong rejection from resistance can provide additional confirmation.
Use RSI for Momentum Confirmation
The RSI can be used to evaluate momentum alongside a crossover.
For example, a bullish MA crossover combined with improving RSI momentum may provide stronger confirmation than a crossover occurring while momentum is weakening.
RSI divergence can also warn traders that the current trend may be losing strength.
Watch Support and Resistance
Support and resistance remain important even when using moving averages.
A crossover that occurs directly below major resistance may have limited upside potential.
Conversely, a bearish crossover directly above strong support may face immediate buying pressure.
This is why experienced traders look beyond the indicator and ask a more important question:
Where is the market when the signal appears?
Consider Volume and Volatility
Volume and volatility can also help filter weak signals.
A crossover accompanied by strong market participation can be more meaningful than one appearing during a quiet trading session.
Volatility is especially important for stop-loss placement. A stop that is too tight for the current market conditions can be triggered by normal price fluctuations.
Practical Rules for Trading Moving Average Crossovers
The crossover itself should be treated as a trading condition, not a guaranteed prediction.
Before entering a trade, consider the following rules:
-
Identify the overall trend first.
-
Wait for the crossover to confirm.
-
Prefer closed-candle confirmation instead of reacting to an unfinished candle.
-
Check nearby support and resistance.
-
Use price action or another momentum filter for confirmation.
-
Define your stop-loss before entering.
-
Calculate position size according to your risk.
-
Avoid taking every crossover in a sideways market.
-
Backtest the selected MA combination on the exact instrument and timeframe.
-
Evaluate performance across different market conditions rather than relying on one profitable period.
These rules help turn a basic indicator concept into a more disciplined trading process.
Moving Average Crossover Strategy for Forex Trading
Forex traders can apply crossover systems to major currency pairs, gold, indices and other liquid markets.
However, the same settings will not necessarily behave identically on every instrument.
For example, a fast MA combination that works reasonably well on EURUSD M15 may generate excessive noise on XAUUSD M5.
Timeframe selection is equally important.
Lower timeframes generally provide more signals but also more market noise. Higher timeframes provide fewer signals and can offer a clearer view of the dominant trend.
For this reason, many traders combine multiple timeframes.
A higher timeframe can be used to identify the dominant direction, while a lower timeframe can be used to search for a more precise entry.
Why Backtesting Matters
A moving average crossover may look excellent on a historical chart, but visual inspection alone is not enough.
Backtesting allows traders to measure how a specific MA combination behaves across different market environments.
Important metrics include:
-
Win rate
-
Average profit per trade
-
Maximum drawdown
-
Profit factor
-
Number of consecutive losses
-
Average stop-loss distance
-
Average trade duration
Do not optimize a strategy simply to achieve the highest historical profit. Excessive optimization can produce settings that perform well on historical data but fail when market conditions change.
The objective is to find a robust trading framework that can tolerate different market environments.
Final Thoughts on the Moving Average Crossover Strategy
The moving average crossover strategy remains popular because it is simple, flexible and easy to understand.
A bullish crossover can highlight strengthening upward momentum, while a bearish crossover can indicate increasing selling pressure. The golden cross and death cross provide well-known examples of how traders use longer-term moving averages to monitor major trend changes.
But no crossover is a guarantee of profit.
The real advantage comes from combining the signal with market structure, support and resistance, price action, momentum analysis and disciplined risk management.
If you trade every crossover blindly, ranging markets can quickly turn a simple strategy into a sequence of losing trades. If you understand when the market is trending, wait for confirmation and control your risk, moving averages can become a useful part of a systematic trading approach.

TW Trend Sniper MT4 for Trend and Crossover-Based Analysis
For traders who prefer a more comprehensive technical approach instead of relying on a basic moving average crossover alone, TW Trend Sniper MT4 combines trend detection with price action analysis, Fibonacci levels, moving averages, support and resistance, and the Trade Wizards proprietary formula.
The indicator provides visual and audible trading alerts, multiple profit target levels, and configurable stop-loss methods. It is designed for traders who want clearer trend and entry information directly on the MetaTrader 4 chart.
The indicator supports different instruments and timeframes from M5 upward, allowing traders to adapt the analysis to their own trading style.
As with any trading tool, the best approach is to test the indicator with historical data and evaluate its behavior on your preferred market and timeframe before using it in live trading.