XAU/USD Weekly Market Outlook & Trading Plan (October 19–23, 2026): Macro Tug-of-War & Premium Liquidity Hunting

XAUUSD — Institutional Market Analysis
18/10/2026 | Multi-Timeframe MN $\rightarrow$ M15 | Quantum Apex Pro v1.20 | Research / Paper Trading
Closing the past trading week near 4165.25 USD/oz, the gold market is caught in a stark divergence between medium-term macroeconomic headwinds and short-term relief dynamics. While the Daily (D1) structure remains firmly within a corrective bearish phase, current price action is hovering just above short-term support—making chasing shorts at current market levels a low-probability, high-risk proposition.
The primary directive for the upcoming trading week is WAIT FOR CONFIRMATION. The institutional bias favors intraday SELL setups only within the Premium zone (4185–4199) following a confirmed liquidity raid and market structure shift, rather than selling directly into local support.
1. Macroeconomic Landscape & Intermarket Context: Conflicting Catalysts
Recent US economic data delivered mixed signals last week, creating a complex push-and-pull environment for XAU/USD:
-
Federal Reserve Tightening & Sticky Inflation (Medium-Term Bearish): Following the Federal Reserve's 25 bps rate hike on September 16 to 3.75–4.00%, September inflation figures came in hotter than consensus. Headline CPI rose 0.6% m/m (3.7% y/y), Core CPI increased 0.3% m/m, and PPI surged 1.3% m/m (6.3% y/y). Persistent price pressures keep hawkish repricing risks alive for upcoming FOMC meetings, capping gold's medium-term upside potential.
-
Cooling US Dollar & Short-Term Yield Relief (Short-Term Supportive): Despite hot inflation prints, the US Dollar Index (DXY) softened by 0.17% to approximately 101.87 during Friday's session, while FedWatch probabilities reflected an 83% chance of the Fed holding rates steady in October. Meanwhile, the US 10-Year Yield (US10Y) hovered near 5.12% and the 2-Year Yield (US02Y) stood at 4.747%. This near-term pullback in the greenback provides temporary support for gold, reducing the reliability of a pure macro-driven sell-off.
-
Geopolitics & Energy Markets: Brent crude oil trading elevated around 109–110 USD/bbl introduces dual forces: heightened inflationary risks alongside sporadic safe-haven demand.
Macro & Intermarket Verdict: MIXED (Medium-Term Bearish Tilt). Because macro forces are pulling in opposite directions over the short term, fundamentals alone do not justify an immediate market entry. Execution must rely strictly on Market Structure and Price Action confirmation.
Key Economic Calendar Events (Week of Oct 19–23, 2026)
Compared to last week's heavy CPI/PPI releases, the upcoming calendar is relatively light, allowing technical structure and liquidity flows to drive intraday price action:
-
Monday, Oct 19: No high-impact scheduled US releases. Focus remains on managing weekend gap risk, opening spread widening, and early week price discovery.
-
Tuesday, Oct 20 (12:30 UTC / 08:30 EDT): US New Residential Construction (Housing Starts & Building Permits).
-
Thursday, Oct 22 (12:30 UTC / 08:30 EDT): US Initial Jobless Claims — Key labor market gauge during the New York session.
(Risk Management Rule: Avoid opening new paper-trade positions within the News Red Zone—from 30 minutes before to 15–30 minutes after high-impact USD releases).
2. Multi-Timeframe Structure & Liquidity Mapping
Analyzing the market from the Monthly down to the 15-Minute chart reveals why price is currently compressing:
| Timeframe | Structural Bias | Key Technical Read |
| MN (Monthly) | Bullish | Long-term multi-year secular uptrend remains intact. |
| W1 (Weekly) | Bearish Correction | Deep corrective sequence following major highs, gradually gravitating toward lower weekly SSL near 3942. |
| D1 (Daily) | Bearish | Governed by the 4697.232 – 3959.460 dealing range. Price (4165.252) trades well below D1 Equilibrium (4328.346), confirming buyers have not reclaimed medium-term control. |
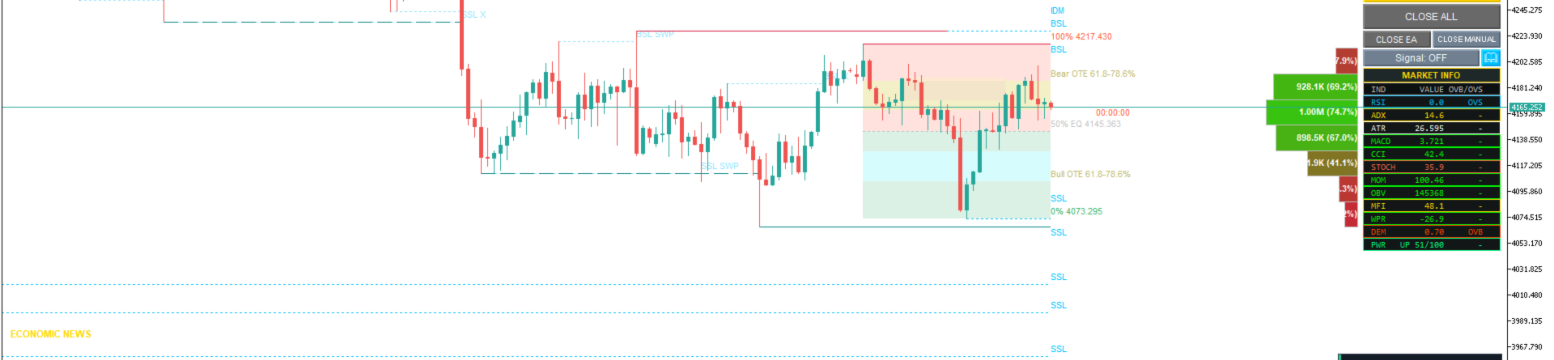
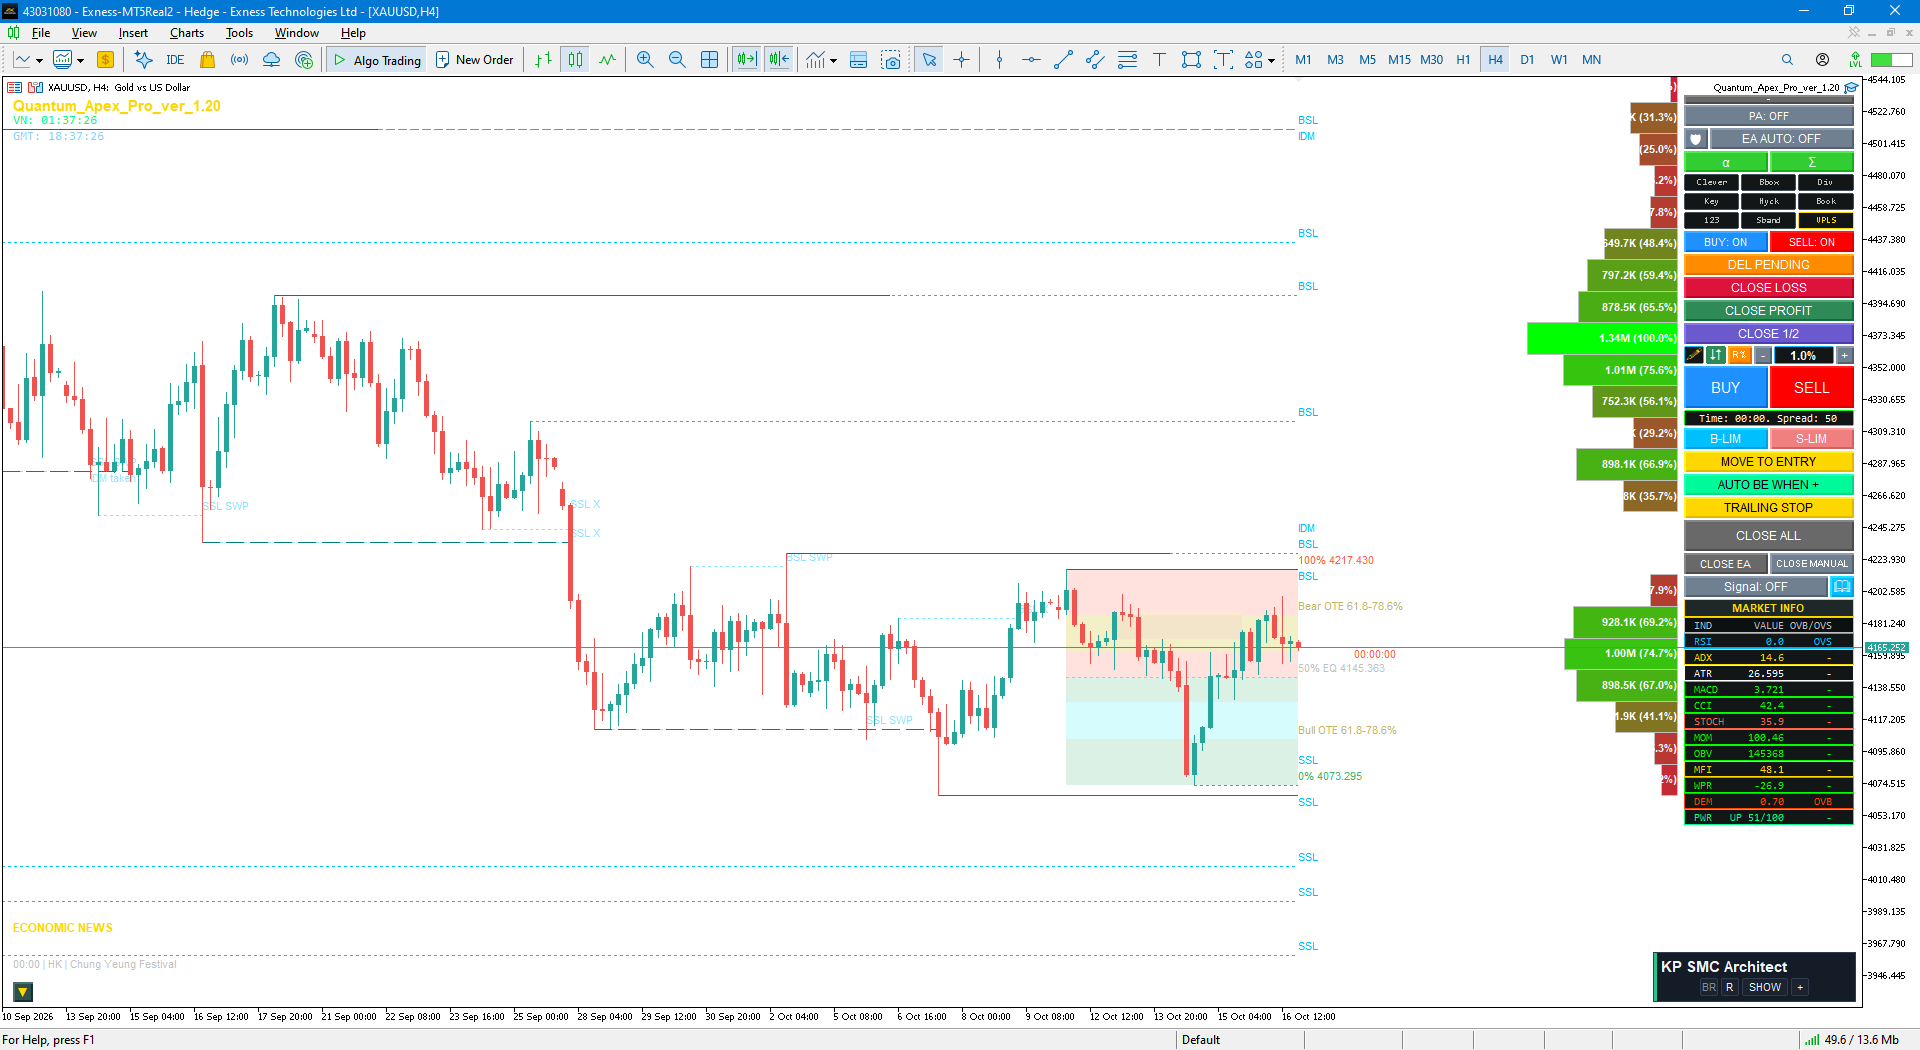
| H4 (4-Hour) | Range / Mixed | Two-way rotational environment between 4073.295 and 4217.430, repeatedly reacting around H4 Equilibrium (4145.363). The 4217.430 high acts as the macro invalidation boundary for bears. |
| H1 (1-Hour) | Range / Bearish Tilt | Operating inside a tighter 4130.388 – 4170.548 working range (EQ at 4150.468), showing downward pressure from local highs. |
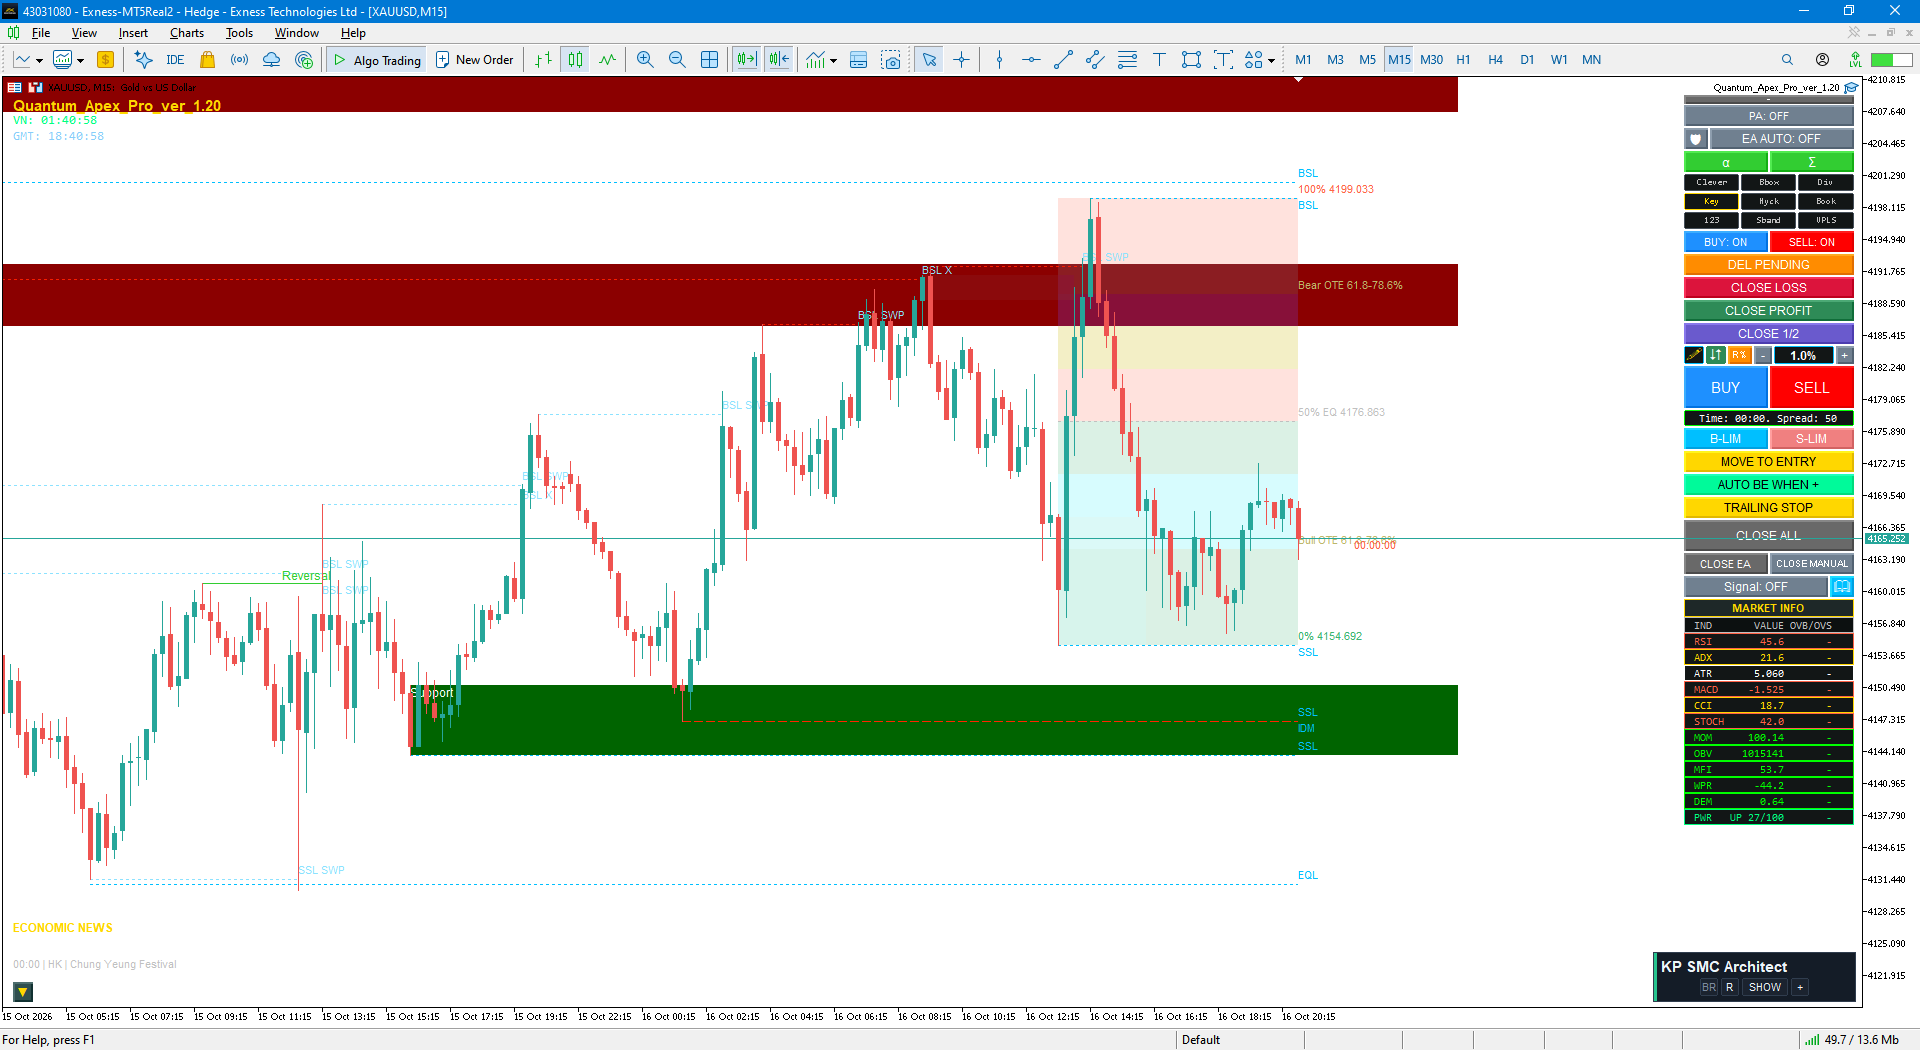
| M15 (15-Min) | Bearish | Following a buy-side liquidity sweep at 4199.033, price printed a decisive bearish displacement leg through M15 EQ (4176.863) down to 4154.692, followed by weak consolidation. |
Liquidity Ladder & Dealing Range Positioning
Mapping the current M15 Dealing Range (4199.033 High to 4154.692 Low) highlights why patience is essential:
-
Higher Timeframe Resistance / BSL: 4697.232 (D1 Upper BSL) $\rightarrow$ 4328.346 (D1 EQ) $\rightarrow$ 4217.430 (H4 Upper BSL).
-
M15 Upper BSL (Nearest Buy-Side Liquidity): 4199.033.
-
M15 Premium Zone: 4176.863 to 4199.033. Within this zone lies the Fibonacci OTE cluster (61.8% at 4182.095, 70.5% at 4185.952, and 78.6% at 4189.544) and a high-relevance M15 Supply/Rejection zone at ~4187–4192.
-
M15 Equilibrium (50%): 4176.863.
-
M15 Discount Zone (Current Price Location): 4154.692 to 4176.863 (Reference Price: 4165.252).
-
Downside Liquidity Targets (SSL): 4154.692 (Nearest M15 SSL) $\rightarrow$ 4145.363 (H4 EQ) $\rightarrow$ 4130.388 (H1 SSL) $\rightarrow$ 4073.295 (H4 Lower SSL) $\rightarrow$ 3959.460 (D1 Lower SSL).
Core Structural Insight: Although the last meaningful M15 displacement was strongly bearish, the reference price (4165.252) sits inside M15 Discount—yet remains above H4/H1 Equilibrium. Initiating a fresh short at 4165 offers poor Risk-to-Reward (R:R) right above the 4154.692 support low. Conversely, buying here fights the D1 bearish correction and overhead M15 supply.
3. Next Week's Trading Plan & Execution Scenarios (Oct 19–23, 2026)
The Primary Draw on Liquidity remains the Sell-Side Liquidity (SSL) pools at 4154.692 and 4130.388, conditional upon price first retracing into a favorable premium location.
🔴 No-Trade Zone: 4154.692 – 4176.863
Avoid initiating proactive positions along the current M15 discount range. Selling near the bottom of the range compresses R:R, while buying lacks higher-timeframe structural backing. Stand aside until price reaches key boundary levels.
🎯 Scenario A (Primary): SELL on Premium Rejection (4185 – 4199)
This setup aligns with the D1 corrective trend and capitalizes on the recent M15 bearish order flow.
-
Target Hunting Zone (Key Location): 4185.000 – 4199.033 (Confluence of M15 OTE Fibonacci retracement, ~4187–4192 M15 supply zone, and 4199.033 BSL).
-
Mandatory 5-Step Trigger Sequence:
-
Location: Price retraces upward into the 4185–4199 premium window.
-
Liquidity Event: Price executes a Buy-Side Liquidity (BSL) raid near 4199.033 or prints a clear failed breakout within the premium supply zone.
-
Rejection: An M15 candle closes back below the swept high/rejection threshold (a single unclosed wick is insufficient confirmation).
-
Displacement & MSS: M5/M15 prints an impulsive bearish displacement leg that breaks and closes below the most recent internal pullback low, confirming a Bearish Market Structure Shift (MSS).
-
Retest: Enter on a controlled retest of the newly formed displacement origin / Fair Value Gap (FVG), provided the structural Stop Loss allows a minimum 1:2 R:R to the first target.
-
-
Conditional Paper-Trade Reference Parameters (Mathematical Model):
-
Example Entry: 4190.000
-
Example Technical Stop Loss (SL): 4204.000
-
HTF Structural Invalidation: 4217.430 (H1/H4 acceptance above this level kills the bearish thesis)
-
Take Profit 1 (TP1): 4154.692 (M15 SSL)
-
Take Profit 2 (TP2): 4130.388 (H1 SSL)
-
-
Risk-to-Reward Verification:
$$\text{Risk} = 4204.000 - 4190.000 = 14.000 \text{ pts}$$$$R_{\text{TP1}} = \frac{4190.000 - 4154.692}{14.000} = \mathbf{2.52R}$$$$R_{\text{TP2}} = \frac{4190.000 - 4130.388}{14.000} = \mathbf{4.26R}$$
Execution Discipline: Do not place blind Sell Limit orders at 4190. If the actual liquidity sweep extends higher and forces a wider Stop Loss that degrades R:R below 1:2, cancel the setup. If price drops straight from 4165 to 4154/4130 without retracing into 4185–4199, log it as a Missed Trade and reset.
🔄 Scenario B (Alternative): Bullish Transition (Only Upon SELL Invalidation)
This scenario activates if and only if the primary bearish thesis is structurally invalidated.
-
Activation Trigger: H1/H4 closes and establishes clear price acceptance above 4217.430, followed by a successful retest of the breakout zone and a confirmed bullish displacement + MSS on M15.
-
Action Plan: Abandon all short biases from 4185–4199. Shift focus to evaluating long opportunities targeting overhead H4 supply/imbalance zones around ~4259.000 – 4290.000.
-
Warning: If H1 falls back and accepts below 4199 following a breakout attempt, suspend the bullish transition thesis immediately.
4. Session Timing Windows & Weekly Execution Checklist
Monitor price behavior closely across the three primary liquidity windows (shown in UTC and Vietnam Time UTC+7):
-
Asian Session (00:00–04:00 UTC | 07:00–11:00 VN): Assess the Monday opening gap, spread normalization, and initial Asian range liquidity boundaries.
-
London Session (07:00–10:00 UTC | 14:00–17:00 VN): Primary window to watch for range expansion and a potential Judas swing / BSL sweep into the 4185–4199 zone.
-
New York Session (12:00–16:00 UTC | 19:00–23:00 VN): Track DXY and US Treasury yield volatility for trend continuation or post-news structural confirmation.
📋 Pre-Trade Trader Checklist for Monday's Open:
-
[ ] Gap & Spread Check: Did the Monday open create a major gap from 4165.252 that alters the M15 dealing range?
-
[ ] Location Check: Has price actually reached the 4185–4199 Premium zone, or is it still trapped inside the 4154.692–4176.863 No-Trade Zone?
-
[ ] Trigger Check: Have you witnessed the full sequence: BSL Raid $\rightarrow$ M15 Rejection Close $\rightarrow$ Bearish Displacement + MSS $\rightarrow$ Retest?
-
[ ] R:R & Invalidation Check: Does the real-time entry offer at least 1:2 R:R to 4154.692 after accounting for spreads, and is H1/H4 still holding below 4217.430?
Final Summary Rule:
IF XAU/USD retraces into 4185–4199, raids buy-side liquidity, and confirms bearish displacement + MSS followed by a valid retest, THEN maintain the SELL bias toward 4154.692 and 4130.388, UNTIL H1/H4 accepts above 4217.430.
⚠️ Disclaimer: This institutional market analysis is compiled from multi-timeframe chart snapshots and cited public macroeconomic data strictly for educational research and paper-trading simulation purposes. It does not constitute live price reporting, financial advice, or a recommendation to execute real-money trades. Trading leveraged derivatives involves substantial risk.