How SSS v5.0 Generates BUY and SELL Signals on BTC, Gold and Forex

Introduction
Understanding a trading indicator is not only about seeing a BUY or SELL arrow on the chart.
A complete setup can contain several pieces of information, including the Major Signal, Entry level, Stop Loss, Take Profit levels, Warning signals, and Continuation signals.
SSS Scalping Smart Signals v5.0 for MetaTrader 5 is designed to display this information directly on the trading chart.
This article explains how to read these signals using practical BTCUSD and USDJPY chart examples.
1. Understanding the Major SignalImportant: The chart examples in this article are historical examples for educational purposes. Indicator signals do not guarantee future price movement or trading profits.
The Major Signal is displayed in the SSS v5.0 information panelDepending on the detected setup, the panel can display information such as:
- BUY ARROW
- SELL ACTIVE
- Other signal-state information
The signal direction should always be considered together with the Entry, Stop Loss and other chart information.
A BUY signal does not mean that price must immediately rise, and a SELL signal does not mean that price must immediately fall.
The purpose is to provide structured technical information for the trader to evaluate.
2. How to Read a BUY Setup
A BUY setup can contain several important components:
BUY Arrow
The BUY arrow identifies the displayed bullish setup on the chart.
Entry BUY STOP
The Entry line identifies the configured price level associated with the setup.
Stop Loss
The Stop Loss line identifies the displayed invalidation/risk level.
TP1, TP2 and TP3
Multiple target levels can be displayed according to the indicator's configured Risk/Reward settings.
This allows the trader to see the complete setup directly on the chart rather than manually calculating every level.
3. BTCUSD M1 BUY Example
The first example shows BTCUSD on the M1 timeframe.
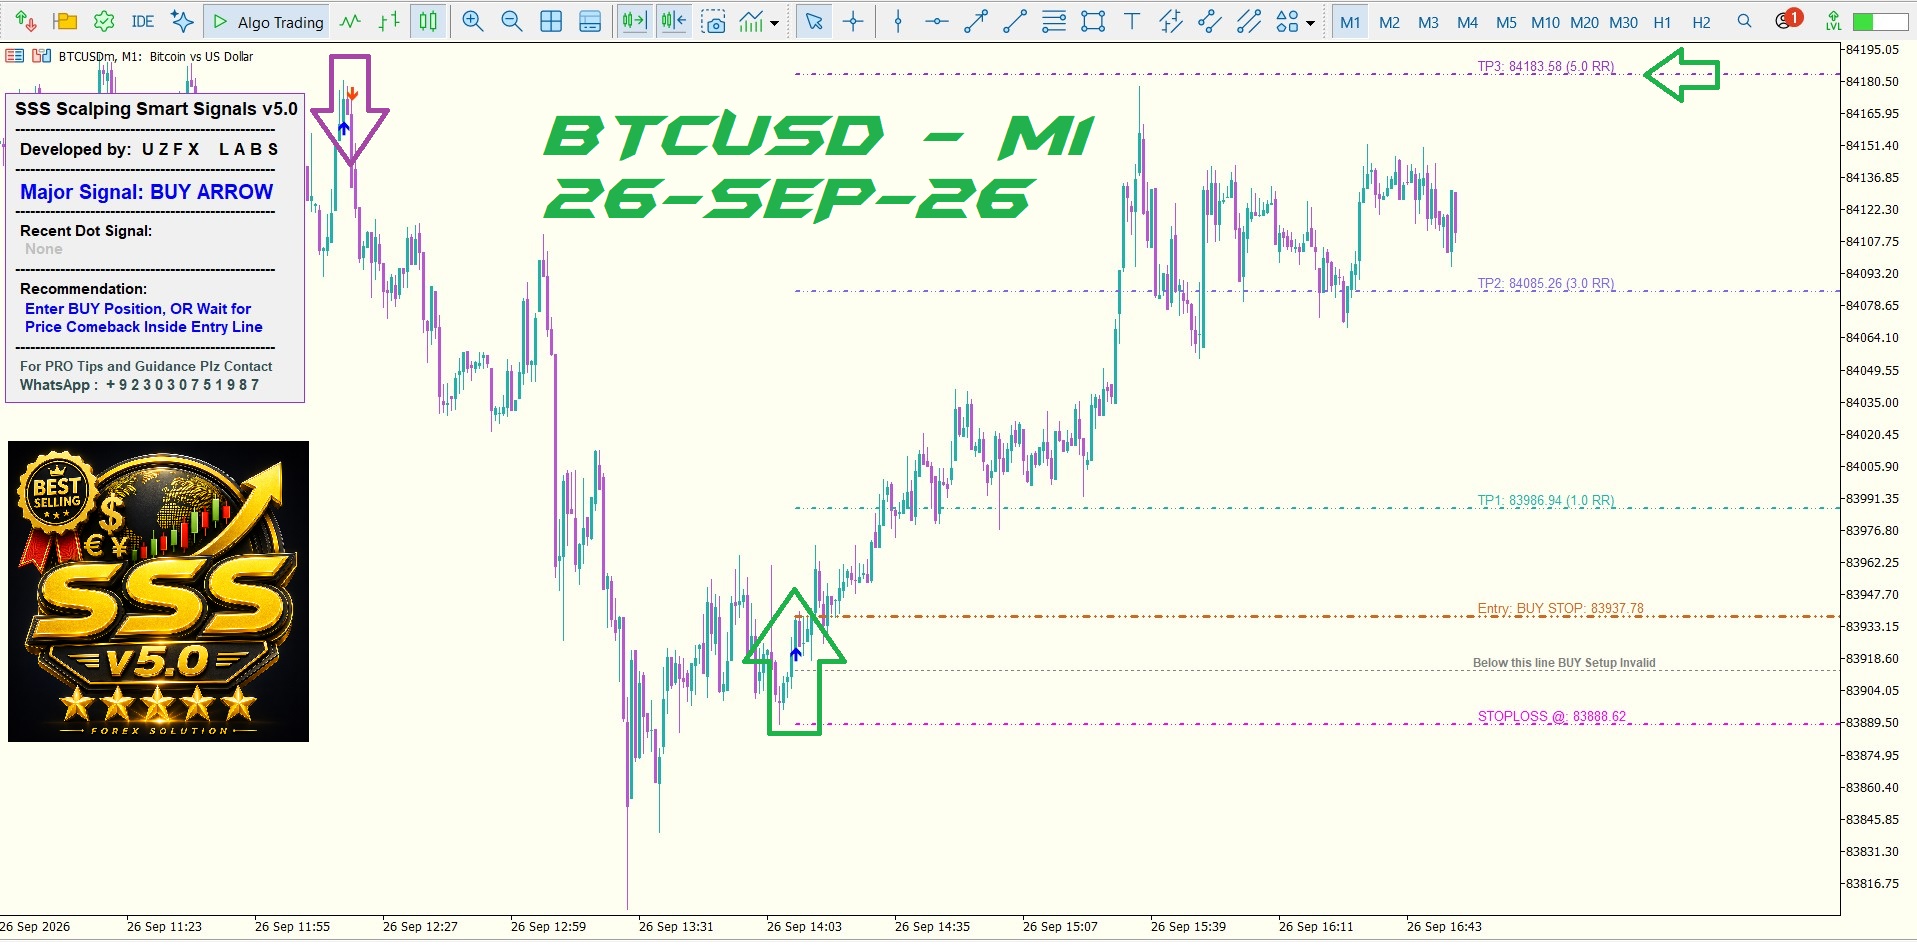
In this example, the chart displays:
- Major Signal: BUY ARROW
- Entry BUY STOP: 83937.78
- STOPLOSS: 83888.62
- TP1: 83986.94 — 1.0 RR
- TP2: 84085.26 — 3.0 RR
- TP3: 84183.58 — 5.0 RR
The chart also displays the message:
"Below this line BUY Setup Invalid"
This is an important part of the setup.
It indicates that the trader should understand the relationship between the entry condition and the invalidation level rather than treating the BUY arrow as an unconditional instruction to enter immediately.
Example calculation
The displayed entry is:
83937.78
The displayed Stop Loss is:
83888.62
The approximate difference is:
49.16 points
The displayed targets are then positioned according to the configured Risk/Reward structure.
For this particular screenshot:
- TP1 = 1.0 RR
- TP2 = 3.0 RR
- TP3 = 5.0 RR
This gives the trader a visual framework for evaluating the setup.
4. Why the Entry Line Matters
One common mistake is to see a BUY arrow and immediately open a market BUY order.
SSS v5.0 can instead display a specific Entry BUY STOP level.
This means the trader should pay attention to the relationship between:
Signal → Entry Level → Price Confirmation → Stop Loss
The chart example demonstrates why the Entry line is important.
The BUY arrow identifies the setup, while the Entry line provides a specific price reference for the setup.
5. Understanding Setup Invalidation
The BTCUSD example also displays:
"Below this line BUY Setup Invalid"
This provides additional context to the setup.
If price moves through the specified invalidation area, the trader should reassess the setup rather than assuming that the original BUY signal remains valid indefinitely.
This is particularly important in fast-moving markets such as cryptocurrency.
6. How to Read a SELL Setup
A SELL setup works in the opposite direction.
The trader can review:
- SELL signal
- Entry SELL STOP
- Stop Loss
- TP1
- TP2
- TP3
- Warning or reversal information
The same principle applies:
Signal → Entry → Risk Level → Targets → Market Confirmation
7. USDJPY M10 SELL Example
The second example shows USDJPY on the M10 timeframe.

The information panel in this example shows:
Major Signal: SELL ACTIVE
The panel also displays:
Recent Dot Signal: BUY WARNING at 159.848
And the recommendation shown on the chart is:
"Caution: Possible Reversal to BUY — Monitor for Upcoming BUY Signal"
This is a useful example because it demonstrates that SSS v5.0 can display different types of signal information simultaneously.
8. Understanding a Warning Signal
A warning signal should not automatically be treated as a confirmed reversal.
In the USDJPY example, the major signal remains:
SELL ACTIVE
while the recent signal shows:
BUY WARNING
The panel therefore provides additional information suggesting that the trader should monitor the market for a possible change in direction.
This distinction is important.
Major Signal
Represents the primary signal state displayed by the indicator.
Warning Signal
Provides additional cautionary information that may require monitoring.
Upcoming Signal
A warning can indicate that traders should wait for further confirmation rather than assuming that a reversal has already occurred.
9. USDJPY Entry, Stop Loss and Targets
The USDJPY screenshot displays:
Entry SELL STOP: 160.309
STOPLOSS: 160.390
The displayed targets are:
- TP1: 159.904 — 5.0 RR
- TP2: 159.094 — 15.0 RR
- TP3: 158.284 — 25.0 RR
The levels are displayed directly on the chart so the trader can visually evaluate the setup.
The distance between the Entry and Stop Loss is relatively small in this example, while the configured target levels extend progressively farther away.
However, the displayed RR values should be understood as configured indicator levels, not as a prediction that those targets will be reached.
10. TP1, TP2 and TP3
SSS v5.0 can display three take-profit levels.
TP1
The first target level.
TP2
The second target level.
TP3
The third target level.
Multiple targets can help traders structure their trade-management plan.
For example, a trader may decide in advance how much of a position to manage at each target according to their own strategy.
The indicator does not determine the appropriate position size or risk percentage for every trader.
11. BUY Signals vs SELL Signals
The basic visual concept can be summarized as follows:
| Element | BUY Setup | SELL Setup |
|---|---|---|
| Major signal | BUY | SELL |
| Entry | BUY STOP / configured entry | SELL STOP / configured entry |
| Stop Loss | Below setup area in the shown example | Above setup area in the shown example |
| TP levels | Above entry | Below entry |
| Warning | May indicate caution/reversal information | May indicate caution/reversal information |
| Continue signal | Additional continuation information | Additional continuation information |
The exact placement depends on the market and setup.
12. Warning Does Not Mean Confirmed Reversal
The USDJPY example is particularly useful for understanding this concept.
The chart shows:
SELL ACTIVE
and simultaneously:
BUY WARNING
This does not mean that the SELL setup has automatically changed into a BUY setup.
Instead, the warning provides additional information that the trader can monitor.
A trader can wait for further confirmation before changing their trading plan.
13. Reading the Complete Setup
Instead of looking at only one arrow, consider the entire chart structure.
A practical checklist is:
Step 1 — Identify the Major Signal
Is the displayed setup BUY or SELL?
Step 2 — Find the Entry
Locate the Entry BUY STOP or Entry SELL STOP line.
Step 3 — Check the Stop Loss
Determine where the setup becomes invalid according to the displayed level.
Step 4 — Review TP1
Identify the first displayed target.
Step 5 — Review TP2 and TP3
Check the additional target levels.
Step 6 — Look for Warning Dots
A warning may provide additional information about changing market conditions.
Step 7 — Look for Continue Dots
A continuation marker can provide additional context regarding the existing setup.
Step 8 — Check Market Conditions
Review volatility, spread, news, session conditions and your own trading plan.
14. Why Signal Confirmation Matters
Financial markets can move rapidly.
A signal can appear during:
- High volatility
- News releases
- Low liquidity
- Sudden reversals
- Strong trends
- Consolidation periods
Therefore, traders should avoid treating an indicator signal as an isolated prediction.
SSS v5.0 is a technical analysis tool. The trader remains responsible for deciding whether and how to trade.
15. Different Markets Can Behave Differently
The two examples in this article demonstrate different markets:
BTCUSD M1
and
USDJPY M10
Bitcoin can experience substantial short-term volatility, particularly on lower timeframes.
Currency pairs can behave differently depending on market sessions, economic releases, liquidity and volatility.
For this reason, users should test the indicator on the specific symbol and timeframe they intend to trade.
16. Risk Management
A signal does not determine how much money should be risked.
Before entering a trade, consider:
- Account size
- Position size
- Stop Loss distance
- Spread
- Slippage
- Market volatility
- News events
- Maximum acceptable loss
Never increase position size simply because an indicator displays multiple TP levels.
The displayed Risk/Reward ratio does not eliminate the possibility of loss.
17. Common Mistakes When Reading Signals
Mistake 1 — Entering immediately after seeing an arrow
The trader should first check the Entry level and complete setup.
Mistake 2 — Ignoring the Stop Loss
Every setup should have a clearly understood risk level.
Mistake 3 — Ignoring Warning Signals
A warning can provide additional context about changing market conditions.
Mistake 4 — Assuming TP3 must be reached
TP levels are displayed targets, not guaranteed outcomes.
Mistake 5 — Using very high risk because the setup looks strong
No indicator can remove market risk.
Mistake 6 — Ignoring the timeframe
A signal on M1 can behave very differently from a signal on H1 or H4.
18. Simple SSS v5.0 Signal Reading Workflow
For a beginner, the following workflow can be useful:
1. Select the market
↓
2. Select the timeframe
↓
3. Check the Major Signal
↓
4. Locate Entry
↓
5. Locate Stop Loss
↓
6. Review TP1 / TP2 / TP3
↓
7. Check Warning / Continue information
↓
8. Evaluate market conditions
↓
9. Apply your own risk-management rules
↓
10. Decide whether the setup fits your trading plan
Conclusion
SSS v5.0 presents multiple pieces of technical information directly on the MetaTrader 5 chart.
The BTCUSD example demonstrates a BUY setup with an Entry BUY STOP, Stop Loss and three displayed targets.
The USDJPY example demonstrates a SELL ACTIVE setup together with a BUY WARNING, showing how additional warning information can appear while the primary signal remains active.
Understanding the difference between the Major Signal, Entry, Stop Loss, Take Profit and Warning information can help traders read the indicator more systematically.
Always test the indicator under your own trading conditions and use appropriate risk management before trading a live account.
Risk Disclaimer
Trading Forex, Gold, Cryptocurrency and other financial instruments involves significant risk of loss. SSS v5.0 is a technical analysis tool and does not guarantee profits, signal accuracy or future market movements. Historical chart examples are for educational purposes only. Traders are responsible for their own trading decisions, position sizing and risk management.
Product Link: https://www.mql5.com/en/market/product/141469