")

Introduction
The Apex Break PRO indicator is a non-repainting pivot trendline breakout system for MetaTrader 4 and MetaTrader 5. It automatically detects pivot highs and pivot lows, draws dynamic trendlines between them, and fires BUY or SELL signals when price breaks through a trendline with sufficient confluence confirmation.
Key Features:
- Automatic Pivot Trendlines: Resistance and support lines drawn from detected pivot points
- Multi-Filter Confluence Scoring: EMA, RSI, Volume, ADX, and Breakout Margin filters combined into a single confluence score
- Non-Repainting Signals: Signals appear only after bar close and never disappear
- ATR-Based Risk Management: Automatic SL, TP1, TP2, and TP3 calculation with hit tracking
- On-Chart Dashboard: Real-time signal status, filter pass/fail, and trade level display
- Six Alert Types: BUY signal, SELL signal, TP1 hit, TP2 hit, TP3 hit, and SL hit via popup, sound, push, and email
Product Links
TIP: This indicator is designed for traders who want a structured, rules-based approach to trendline breakout trading. It works on any symbol and any timeframe available in MetaTrader.
Understanding Pivot Trendline Breakouts
Apex Break PRO identifies swing highs and swing lows using a configurable left/right bar lookback window. When two consecutive pivot highs are found, the indicator draws a resistance trendline connecting them. When two consecutive pivot lows are found, it draws a support trendline.
How signals are generated:
- The indicator detects a new pivot high or pivot low at the bar located PivotRightBars bars back from the current bar
- A trendline is drawn from the previous pivot of the same type to the newly detected pivot and extended forward
- When the closing price of a confirmed bar breaks above a resistance line (or below a support line) by at least the required margin, a raw breakout is detected
- The confluence filters (EMA, RSI, Volume, ADX) are evaluated and scored
- If the confluence score meets or exceeds MinConfluence and the cooldown period has elapsed, a signal is generated
- The signal arrow and label are drawn on the chart, TP/SL levels are calculated, and alerts fire
Active trendlines are drawn as solid lines. Broken or expired trendlines switch to dashed style.
NOTE: Because the indicator requires PivotRightBars of confirmed data to the right of a pivot before detecting it, there is a built-in confirmation lag. This is what makes the signals non-repainting -- the pivot must be fully confirmed before any line or signal can appear.
Installation Guide
Apex Break PRO is distributed through the MQL5.com Market. Installation is automatic.
Steps:
- Purchase the indicator from the MQL5 Market product page
- The indicator installs automatically into your MetaTrader terminal
- Open MetaTrader and press Ctrl+N to open the Navigator panel
- Expand Indicators > Market
- Locate Apex_Break_PRO in the list
- Drag the indicator onto any chart, or double-click its name
- The settings dialog appears -- adjust parameters as needed (see sections below)
- Click OK to apply
After loading, you will see:
- Trendlines drawn on the chart connecting pivot points (resistance in red/tomato, support in green/aquamarine)
- Signal arrows (Wingding 233 for BUY, Wingding 234 for SELL) at breakout points
- Signal labels showing price, star rating, and confluence score
- TP/SL levels drawn as horizontal lines with colored fill zones
- Dashboard panel in the corner of the chart (if enabled)
IMPORTANT: Do not manually copy files to the data folder. The MQL5 Market handles all file placement and updates automatically.
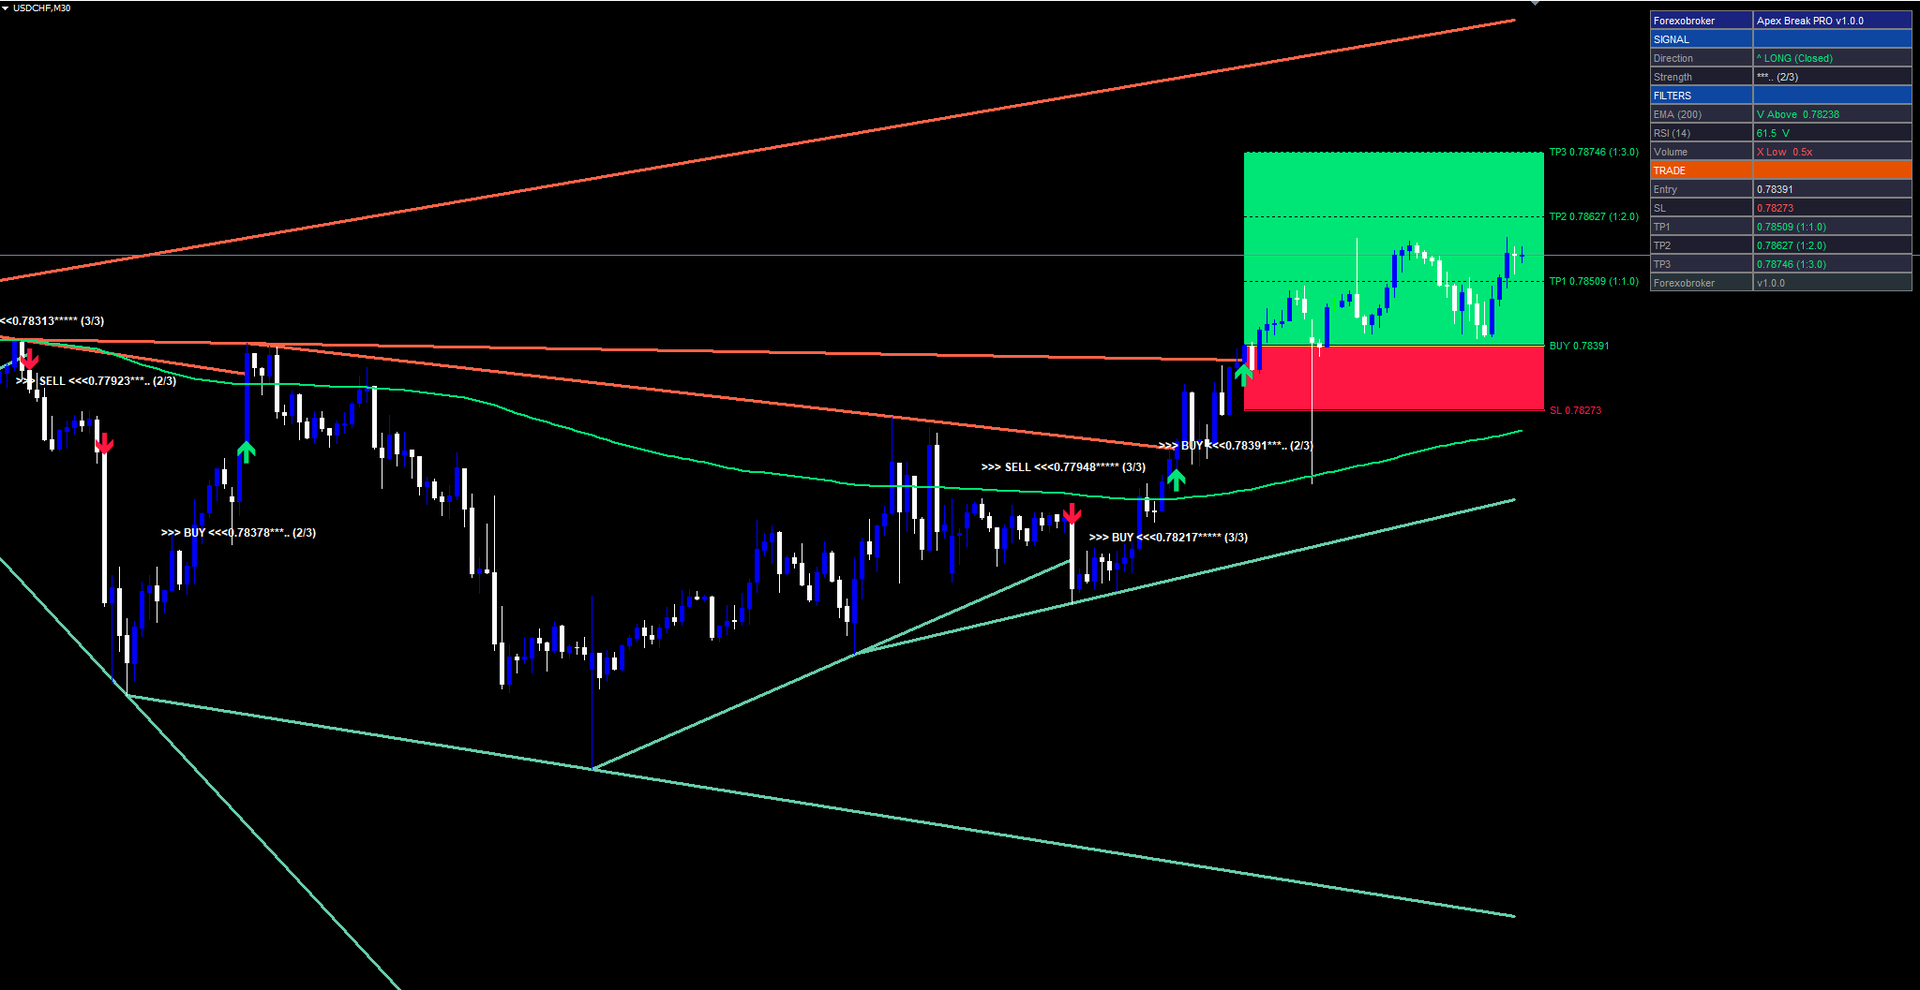
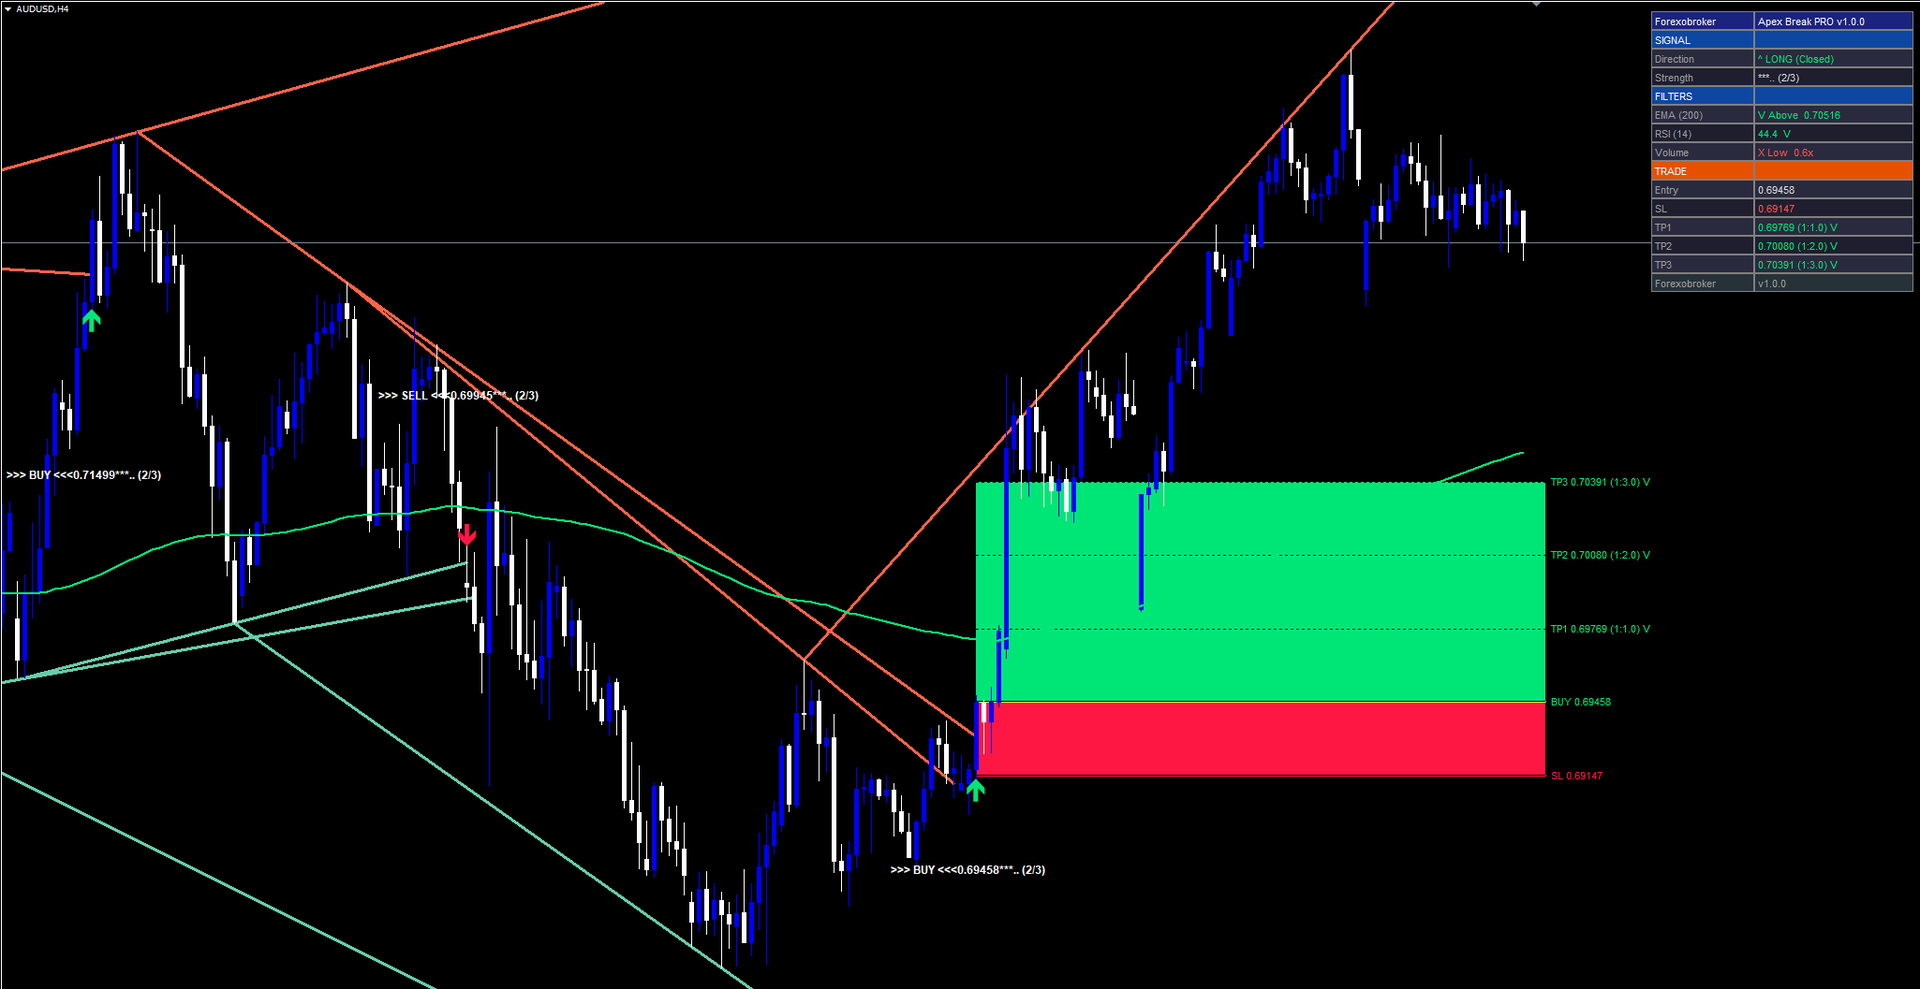
Signal System Overview
Each signal consists of three visual components on the chart:
1. Signal Arrow
- BUY signals display a green upward arrow (Wingding 233) below the signal bar
- SELL signals display a red downward arrow (Wingding 234) above the signal bar
- Arrows appear only on confirmed (closed) bars
2. Signal Label
Below or above the arrow, a text label shows:
- Direction: >>> BUY <<< or >>> SELL <<<
- Price level at signal close
- Star rating and confluence score, e.g. ***. (3/4)
The star rating maps the raw confluence score to a 5-star scale. The fraction in parentheses shows how many filters passed versus how many are enabled.
3. Confluence Score
The confluence score is the count of filters that pass at the moment of breakout. For example, if EMA, RSI, and Volume filters are enabled (3 filters total) and the breakout passes EMA and Volume but not RSI, the confluence score is 2/3.
A signal only fires when the confluence score is at or above the MinConfluence threshold.
Non-Repainting Confirmation:
- Breakout detection runs only on confirmed bars ( barConfirmed = true when the bar index is less than rates_total - 1 )
- Once a signal arrow and label appear, they are permanent and will never be removed or repositioned
- What you see in historical data is exactly what would have appeared in real time
Trendline Display Settings
These parameters control how pivot points are detected and how trendlines are drawn on the chart.
| Parameter | Default | Description |
|---|---|---|
| PivotLeftBars | 20 | Number of bars to the left that must have lower highs (for pivot high) or higher lows (for pivot low) |
| PivotRightBars | 20 | Number of bars to the right that must confirm the pivot. Higher values increase confirmation lag but reduce false pivots |
| MaxLineExtension | 500 | Maximum number of bars a trendline extends forward from its detection point before expiring |
| MaxResistanceLines | 5 | Maximum number of resistance trendlines displayed simultaneously. Oldest lines are removed first. Set to 0 for unlimited |
| MaxSupportLines | 5 | Maximum number of support trendlines displayed simultaneously. Oldest lines are removed first. Set to 0 for unlimited |
| LineWidth | 3 | Pixel width of trendlines |
| LineTransparency | 25 | Transparency level (0 = fully opaque, 100 = invisible). Default 25 gives a subtle, non-distracting appearance |
Visual behavior:
- Active trendlines (not yet broken or expired) are drawn with a solid line style
- Broken trendlines (price closed beyond the line) switch to a dashed line style and become inactive
- Expired trendlines (reached MaxLineExtension bars) also switch to dashed
- Resistance lines use the ResistanceColor input (default: Tomato)
- Support lines use the SupportColor input (default: MediumAquamarine)
TIP: For scalping on lower timeframes (M5-M15), try reducing PivotLeftBars and PivotRightBars to 10. For swing trading on H4-D1, increase them to 30 for more significant pivot points.
Confluence Filter Configuration
The confluence system is the core of Apex Break PRO. Each filter evaluates a separate market condition. A breakout must pass enough filters (meeting MinConfluence ) before a signal is generated.
EMA Trend Filter
| Parameter | Default | Description |
|---|---|---|
| UseEmaFilter | true | Enable or disable the EMA trend filter |
| EmaLength | 200 | Period of the Exponential Moving Average |
| ShowEmaOnChart | true | Draw the EMA line on the chart |
Logic: For BUY signals, price must close above the EMA. For SELL signals, price must close below the EMA. This ensures trades align with the dominant trend.
RSI Boundary Filter
| Parameter | Default | Description |
|---|---|---|
| UseRsiFilter | true | Enable or disable the RSI filter |
| RsiLength | 14 | RSI calculation period |
| RsiOverbought | 75 | Upper boundary. BUY signals require RSI below this level |
| RsiOversold | 25 | Lower boundary. SELL signals require RSI above this level |
Logic: BUY signals pass when RSI is below the overbought level (not already overextended). SELL signals pass when RSI is above the oversold level. This prevents entering trades at exhaustion points.
Volume Spike Filter
| Parameter | Default | Description |
|---|---|---|
| UseVolumeFilter | true | Enable or disable the volume filter |
| VolumeMultiplier | 1.2 | Current volume must exceed the average by this multiple |
| VolumeAvgLength | 20 | Period for the volume simple moving average |
Logic: The current bar's tick volume must be greater than VolumeMultiplier times the 20-bar average volume. This confirms that the breakout has institutional participation rather than occurring on thin volume.
ADX Trend Strength Filter
| Parameter | Default | Description |
|---|---|---|
| UseAdxFilter | false | Enable or disable the ADX filter (disabled by default) |
| AdxLength | 14 | ADX calculation period |
| AdxThreshold | 20.0 | Minimum ADX value required to pass |
Logic: ADX must be above the threshold, indicating a trending environment. This filter is disabled by default because many valid breakouts occur during range-to-trend transitions when ADX is still rising.
TIP: Enable the ADX filter when trading pairs known for strong trending behavior (e.g., GBPJPY, EURJPY). Keep it disabled for pairs that frequently range (e.g., EURGBP, AUDNZD).
Breakout Margin
| Parameter | Default | Description |
|---|---|---|
| UseBreakoutMargin | true | Require price to close beyond the trendline by a minimum margin |
| MarginMultiplier | 0.1 | Margin size as a multiple of ATR |
Logic: Price must close at least 0.1 x ATR beyond the trendline to count as a valid breakout. This filters out false breakouts where price barely touches the trendline.
Cooldown and Minimum Confluence
| Parameter | Default | Description |
|---|---|---|
| SignalCooldown | 5 | Minimum number of bars between consecutive signals of the same type |
| MinConfluence | 2 | Minimum confluence score required to generate a signal |
How MinConfluence works: If you have 4 filters enabled (EMA + RSI + Volume + ADX) and MinConfluence = 2 , at least 2 of those 4 filters must pass for a signal to fire. The star rating on the signal label reflects the ratio: 2/4 = 2.5 stars.
Risk Management Setup
Apex Break PRO calculates stop loss and three take profit levels automatically for each signal. These levels are drawn on the chart as horizontal lines with colored fill zones.
Stop Loss Calculation
| Parameter | Default | Description |
|---|---|---|
| UseAtrSL | true | Calculate SL using ATR. If false, uses percentage-based SL |
| AtrPeriod | 14 | ATR calculation period |
| SlMultiplier | 1.5 | SL distance = ATR x this multiplier |
| SlPercent | 1.0 | SL distance as percentage of entry price (used only when UseAtrSL = false) |
When UseAtrSL = true , the stop loss is placed at Entry Price - (ATR x 1.5) for BUY signals, or Entry Price + (ATR x 1.5) for SELL signals. This adapts the stop distance to current market volatility.
Take Profit Levels
| Parameter | Default | Description |
|---|---|---|
| TP1_RR | 1.0 | TP1 at 1:1 risk-reward ratio |
| TP2_RR | 2.0 | TP2 at 1:2 risk-reward ratio |
| TP3_RR | 3.0 | TP3 at 1:3 risk-reward ratio |
The "risk" in the risk-reward calculation is the distance from entry to SL. So if SL is 50 pips from entry:
- TP1 (1:1) = 50 pips from entry in the trade direction
- TP2 (1:2) = 100 pips from entry in the trade direction
- TP3 (1:3) = 150 pips from entry in the trade direction
Display Toggles
| Parameter | Default | Description |
|---|---|---|
| ShowTPSL | true | Master toggle for all TP/SL visualization |
| ShowSL | true | Show the SL line and fill zone |
| ShowTP1 | true | Show the TP1 line and label |
| ShowTP2 | true | Show the TP2 line and label |
| ShowTP3 | true | Show the TP3 line and label |
Hit Tracking
The indicator tracks whether each TP level and the SL have been reached by subsequent price action:
- When price reaches TP1, a checkmark (V) appears next to the TP1 label on chart and dashboard
- Same for TP2 and TP3
- If SL is hit, the trade is considered closed
- If TP3 is hit, the trade is also considered closed (full target reached)
- The dashboard shows "(Active)" while a trade is open and "(Closed)" after SL or TP3 is hit
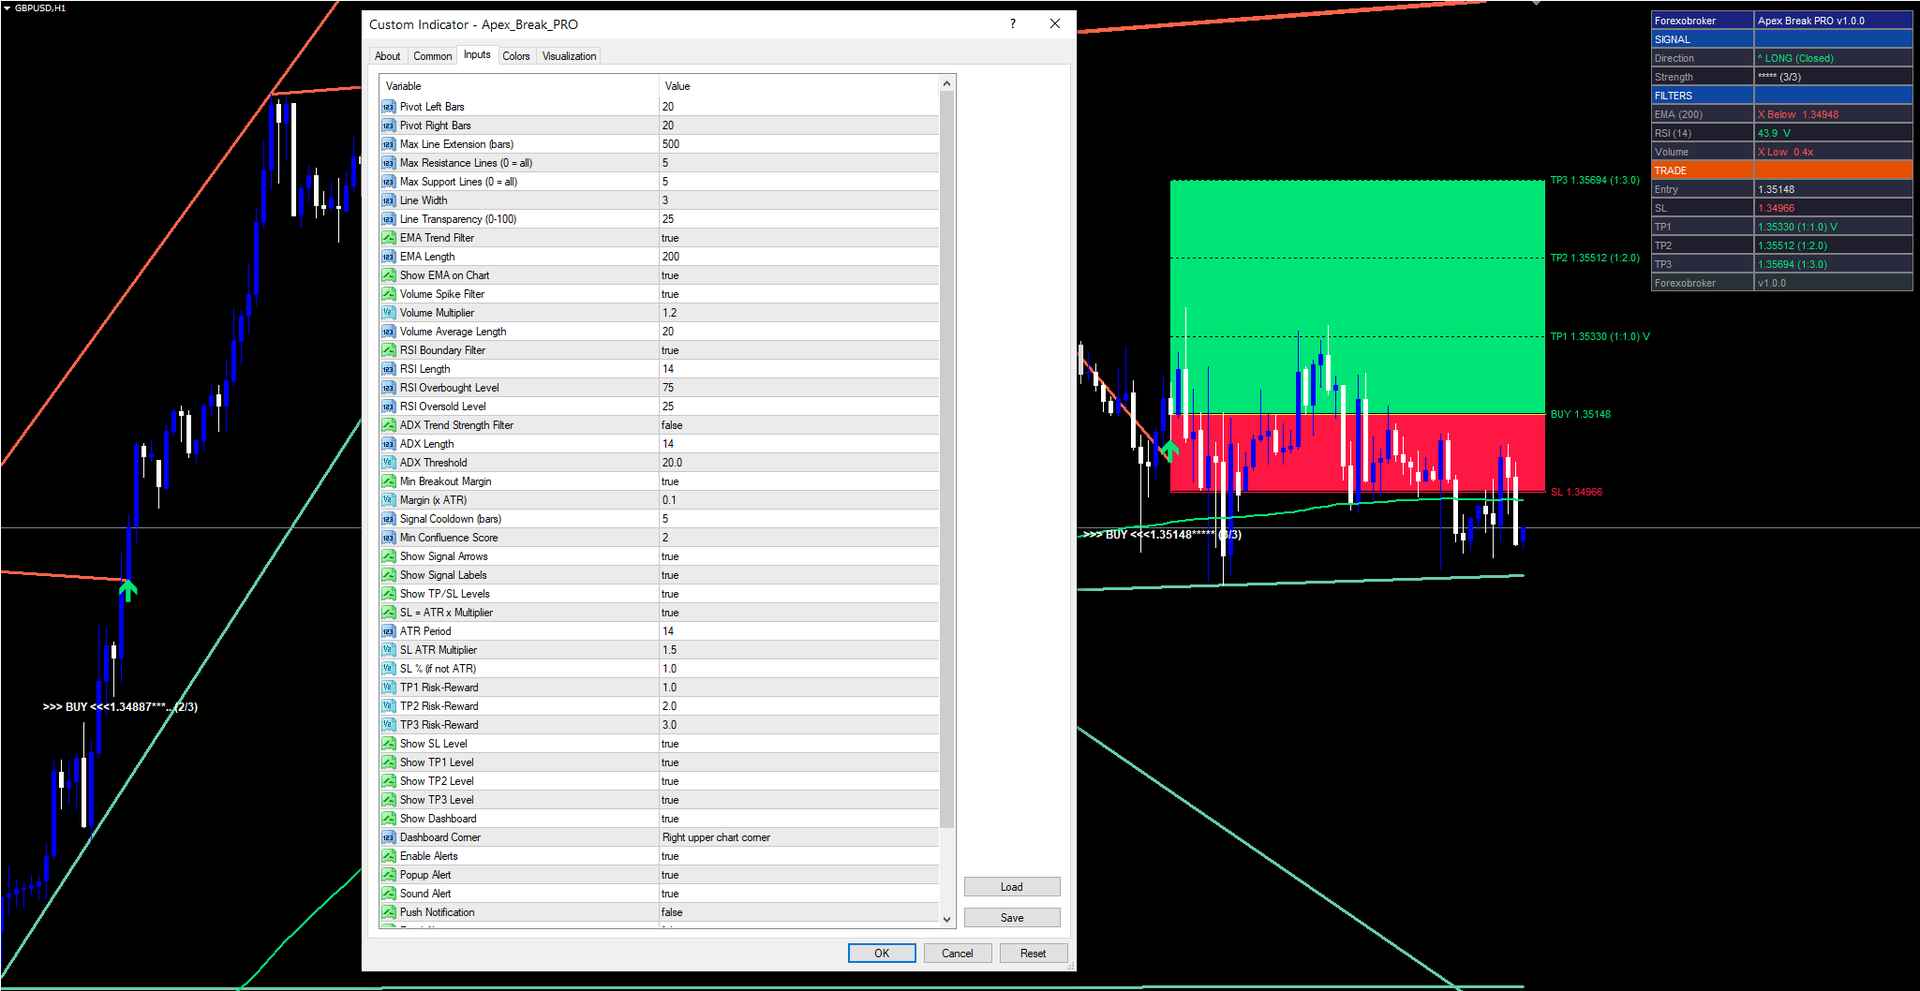
Complete Parameter Reference
The following table lists all 34 input parameters in the order they appear in the indicator settings dialog.
| # | Parameter | Type | Default | Category |
|---|---|---|---|---|
| 1 | PivotLeftBars | int | 20 | Pivot Detection |
| 2 | PivotRightBars | int | 20 | Pivot Detection |
| 3 | MaxLineExtension | int | 500 | Pivot Detection |
| 4 | MaxResistanceLines | int | 5 | Line Display |
| 5 | MaxSupportLines | int | 5 | Line Display |
| 6 | LineWidth | int | 3 | Line Display |
| 7 | LineTransparency | int | 25 | Line Display |
| 8 | UseEmaFilter | bool | true | Signal Filters |
| 9 | EmaLength | int | 200 | Signal Filters |
| 10 | ShowEmaOnChart | bool | true | Signal Filters |
| 11 | UseVolumeFilter | bool | true | Signal Filters |
| 12 | VolumeMultiplier | double | 1.2 | Signal Filters |
| 13 | VolumeAvgLength | int | 20 | Signal Filters |
| 14 | UseRsiFilter | bool | true | Signal Filters |
| 15 | RsiLength | int | 14 | Signal Filters |
| 16 | RsiOverbought | int | 75 | Signal Filters |
| 17 | RsiOversold | int | 25 | Signal Filters |
| 18 | UseAdxFilter | bool | false | Signal Filters |
| 19 | AdxLength | int | 14 | Signal Filters |
| 20 | AdxThreshold | double | 20.0 | Signal Filters |
| 21 | UseBreakoutMargin | bool | true | Signal Filters |
| 22 | MarginMultiplier | double | 0.1 | Signal Filters |
| 23 | SignalCooldown | int | 5 | Signal Filters |
| 24 | MinConfluence | int | 2 | Signal Filters |
| 25 | ShowArrows | bool | true | Signal Display |
| 26 | ShowLabels | bool | true | Signal Display |
| 27 | ShowTPSL | bool | true | Risk Management |
| 28 | UseAtrSL | bool | true | Risk Management |
| 29 | AtrPeriod | int | 14 | Risk Management |
| 30 | SlMultiplier | double | 1.5 | Risk Management |
| 31 | SlPercent | double | 1.0 | Risk Management |
| 32 | TP1_RR | double | 1.0 | Risk Management |
| 33 | TP2_RR | double | 2.0 | Risk Management |
| 34 | TP3_RR | double | 3.0 | Risk Management |
| 35 | ShowSL | bool | true | TP/SL Display |
| 36 | ShowTP1 | bool | true | TP/SL Display |
| 37 | ShowTP2 | bool | true | TP/SL Display |
| 38 | ShowTP3 | bool | true | TP/SL Display |
| 39 | ShowDashboard | bool | true | Dashboard |
| 40 | DashCorner | ENUM_BASE_CORNER | CORNER_RIGHT_UPPER | Dashboard |
| 41 | EnableAlerts | bool | true | Alerts |
| 42 | AlertPopup | bool | true | Alerts |
| 43 | AlertSound | bool | true | Alerts |
| 44 | AlertPush | bool | false | Alerts |
| 45 | AlertEmail | bool | false | Alerts |
| 46 | ResistanceColor | color | clrTomato | Colors |
| 47 | SupportColor | color | clrMediumAquamarine | Colors |
| 48 | BuySignalColor | color | C'0,230,118' | Colors |
| 49 | SellSignalColor | color | C'255,23,68' | Colors |
Dashboard Guide
The on-chart dashboard provides a compact, real-time summary of the indicator state. It is organized into three sections: SIGNAL, FILTERS, and TRADE.
Dashboard Settings:
| Parameter | Default | Description |
|---|---|---|
| ShowDashboard | true | Show or hide the dashboard |
| DashCorner | CORNER_RIGHT_UPPER | Which corner of the chart to anchor the dashboard |
The dashboard corner can be set to any of the four chart corners: Right Upper, Left Upper, Right Lower, or Left Lower.
SIGNAL Section
| Row | Description |
|---|---|
| Direction | Shows ^ LONG (Active) , v SHORT (Active) , ^ LONG (Closed) , v SHORT (Closed) , or - WAITING depending on the current signal state. Green for LONG, red for SHORT, gray for WAITING |
| Strength | Star rating and confluence fraction, e.g. ***. (3/4) . Shows ----- when no signal is active |
FILTERS Section
Each enabled filter appears as a row with a pass/fail indicator:
| Row | Pass Display | Fail Display |
|---|---|---|
| EMA (200) | V Above 1.08542 (green) | X Below 1.08542 (red) |
| RSI (14) | 52.3 V (green) | 78.1 X (red) |
| Volume | V Spike 1.8x (green) | X Low 0.7x (red) |
| ADX (14) | 28.5 V (green) | 15.2 X (red) |
Only filters that are enabled via their Use*Filter toggle will appear in the dashboard. Disabled filters are hidden entirely.
TRADE Section
| Row | Description |
|---|---|
| Entry | Entry price of the most recent signal |
| SL | Stop loss price (displayed in red) |
| TP1 | TP1 price with risk-reward ratio, e.g. 1.08920 (1:1.0) . Appends V when hit |
| TP2 | TP2 price with ratio, e.g. 1.09298 (1:2.0) . Appends V when hit |
| TP3 | TP3 price with ratio, e.g. 1.09676 (1:3.0) . Appends V when hit |
The dashboard header row shows Forexobroker | Apex Break PRO v1.0.0 and the footer shows the version number.
TIP: If the dashboard overlaps with price action, change DashCorner to a different corner or temporarily hide it with ShowDashboard = false .
Alert Configuration
Apex Break PRO supports four alert delivery channels and six distinct alert events.
Alert Channels
| Parameter | Default | Description |
|---|---|---|
| EnableAlerts | true | Master switch for all alerts |
| AlertPopup | true | Show a popup dialog in MetaTrader |
| AlertSound | true | Play the default alert sound |
| AlertPush | false | Send push notification to the MetaTrader mobile app |
| AlertEmail | false | Send email notification |
Alert Events
The indicator fires alerts for six events, each once per bar:
| Alert Event | Example Message | ||||||||
|---|---|---|---|---|---|---|---|---|---|
| BUY Signal | `BUY \ | EURUSD \ | TF: H1 \ | Price: 1.08542 \ | *.. Moderate (3/4) \ | SL: 1.08164 \ | TP1: 1.08920 \ | TP2: 1.09298 \ | TP3: 1.09676` |
| SELL Signal | `SELL \ | EURUSD \ | TF: H1 \ | Price: 1.08542 \ | **. Strong (4/4) \ | SL: 1.08920 \ | TP1: 1.08164 \ | TP2: 1.07786 \ | TP3: 1.07408` |
| TP1 Hit | `ABPTP1 Hit \ | EURUSD \ | H1 \ | Entry: 1.08542` | |||||
| TP2 Hit | `ABPTP2 Hit \ | EURUSD \ | H1 \ | Entry: 1.08542` | |||||
| TP3 Hit | `ABPTP3 Hit \ | EURUSD \ | H1 \ | Entry: 1.08542` | |||||
| SL Hit | `ABPStop Loss Hit \ | EURUSD \ | H1 \ | Entry: 1.08542` |
Each alert fires only once per bar to prevent duplicate notifications. The alert text includes the symbol, timeframe, entry price, confluence details, and all TP/SL levels.
Enabling Push Notifications
- Install the MetaTrader mobile app on your phone (iOS or Android)
- Open the app and navigate to Settings > Messages
- Copy your MetaQuotes ID
- In the desktop MetaTrader, go to Tools > Options > Notifications
- Enter your MetaQuotes ID and enable notifications
- Set AlertPush = true in the indicator settings
Enabling Email Notifications
- In MetaTrader, go to Tools > Options > Email
- Check Enable
- Enter your SMTP server, port, login, password, and destination email address
- Click Test to verify the configuration works
- Set AlertEmail = true in the indicator settings
Trading Strategies
The following three approaches demonstrate different ways to use Apex Break PRO. All strategies assume default filter settings unless stated otherwise.
WARNING: Trading involves significant risk of loss. These strategies are provided for educational purposes only. Always test on a demo account first and never trade with money you cannot afford to lose.
Strategy A: Scalping (M5 - M15)
Goal: Capture quick moves with tight risk management.
Recommended settings adjustments:
- PivotLeftBars = 10, PivotRightBars = 10 (faster pivot detection)
- EmaLength = 50 (shorter trend reference)
- MinConfluence = 3 (stricter filtering to compensate for noise)
- SignalCooldown = 3 (allow more frequent signals)
- SlMultiplier = 1.0 (tighter stops)
- TP1_RR = 1.0, TP2_RR = 1.5, TP3_RR = 2.0 (lower TP targets)
Trade management:
- Wait for a signal with confluence score of 3 or higher
- Enter at the open of the next bar after the signal
- Take partial profit at TP1 (close 50% of position)
- Move stop to breakeven after TP1 is hit
- Close remaining position at TP2
Strategy B: Swing Trading (H1 - H4)
Goal: Ride medium-term trends using all three TP levels.
Recommended settings: Use defaults (PivotLeftBars=20, PivotRightBars=20, EmaLength=200, MinConfluence=2).
Trade management:
- Wait for a signal that aligns with the EMA direction (the EMA filter handles this automatically)
- Enter at the open of the next bar after the signal
- Close 1/3 of the position at TP1
- Move stop to breakeven after TP1
- Close 1/3 at TP2
- Trail stop behind TP1 level and let the final 1/3 run to TP3
Strategy C: Alert-Based (Set and Forget)
Goal: Monitor multiple charts without sitting at the screen.
Setup:
- Open charts for all symbols and timeframes you want to monitor
- Apply Apex Break PRO to each chart with your preferred settings
- Enable AlertPush = true and configure your MetaQuotes ID
- When a push notification arrives, open the chart to evaluate the signal
- Use the dashboard to check filter status and TP/SL levels before entering
TIP: For Strategy C, consider setting MinConfluence one point higher than your default to reduce noise in push notifications.
Parameter Tuning Presets
The following preset tables provide starting points for different trading styles. Adjust based on your symbol, broker conditions, and personal preference.
Scalping Preset (M5 - M15)
| Parameter | Scalping Value |
|---|---|
| PivotLeftBars | 10 |
| PivotRightBars | 10 |
| MaxLineExtension | 200 |
| EmaLength | 50 |
| VolumeMultiplier | 1.5 |
| SignalCooldown | 3 |
| MinConfluence | 3 |
| SlMultiplier | 1.0 |
| TP1_RR | 1.0 |
| TP2_RR | 1.5 |
| TP3_RR | 2.0 |
Swing Trading Preset (H1 - H4)
| Parameter | Swing Value |
|---|---|
| PivotLeftBars | 20 |
| PivotRightBars | 20 |
| MaxLineExtension | 500 |
| EmaLength | 200 |
| VolumeMultiplier | 1.2 |
| SignalCooldown | 5 |
| MinConfluence | 2 |
| SlMultiplier | 1.5 |
| TP1_RR | 1.0 |
| TP2_RR | 2.0 |
| TP3_RR | 3.0 |
Conservative / Position Preset (H4 - D1)
| Parameter | Conservative Value |
|---|---|
| PivotLeftBars | 30 |
| PivotRightBars | 30 |
| MaxLineExtension | 800 |
| EmaLength | 200 |
| UseAdxFilter | true |
| AdxThreshold | 25 |
| VolumeMultiplier | 1.5 |
| SignalCooldown | 10 |
| MinConfluence | 3 |
| SlMultiplier | 2.0 |
| TP1_RR | 1.0 |
| TP2_RR | 2.0 |
| TP3_RR | 4.0 |
TIP: Start with the Swing Trading preset and modify one parameter at a time to observe its effect on signal quality and frequency.
Troubleshooting
No Signals Appearing on the Chart
Possible causes and fixes:
- Warmup period not reached. The indicator requires a minimum number of historical bars before it can detect pivots and generate signals. The warmup is approximately EmaLength + 50 bars or PivotLeftBars + PivotRightBars + 50 bars, whichever is larger. Scroll back in history or wait for more bars to form.
- MinConfluence is too high. If MinConfluence equals the number of enabled filters, every single filter must pass simultaneously. Try reducing MinConfluence by 1.
- Cooldown is too long. On higher timeframes, a SignalCooldown of 5 bars can mean several days with no signals. Reduce the cooldown for higher timeframes.
- No trendline breakouts in the visible range. Zoom out or scroll back. The indicator may have signals further back in history.
Trendlines Not Visible
- Verify that MaxResistanceLines and MaxSupportLines are not set to 0 if you expect to see lines (0 means unlimited, not zero lines)
- Check LineTransparency -- a value of 100 makes lines invisible
- Increase LineWidth if lines are difficult to see on your monitor
- Ensure the chart has enough history for pivots to be detected ( PivotLeftBars + PivotRightBars bars minimum)
Dashboard Not Showing
- Confirm ShowDashboard = true
- If the chart window is too narrow, the dashboard may be drawn outside the visible area. Try changing DashCorner to CORNER_LEFT_UPPER
- Resize the chart window to be wider
- The dashboard repositions automatically when the chart is resized (handled by the OnChartEvent handler)
Alerts Not Firing
- Check that EnableAlerts = true (this is the master switch)
- For push notifications: verify your MetaQuotes ID is configured in Tools > Options > Notifications and that AlertPush = true
- For email alerts: verify SMTP settings in Tools > Options > Email and that AlertEmail = true
- Alerts fire only once per bar per event type. If you missed the alert, you will not receive a duplicate on the same bar
Different Results Between MT4 and MT5
- The underlying calculation logic is identical, but minor differences in warmup behavior between MT4 and MT5 can cause the first few signals in history to appear at slightly different bar positions
- Tick volume data may differ between MT4 and MT5 feeds, which can affect the Volume filter
- These differences are expected and diminish as more historical bars are processed
Support and Contact
If you need assistance with Apex Break PRO:
| Contact Method | Details |
|---|---|
| support@forexobroker.com | |
| Website | www.forexobroker.com |
| MQL5 Market | Use the Comments section on the product page |
When contacting support, please include:
- Your MetaTrader version (MT4 or MT5)
- Broker name and symbol format
- A description of the issue
- Screenshots of the chart and the indicator settings dialog
- The exact parameter values you are using
CONTACT & SUPPORT
- Email: info@forexobroker.com
- Questions: Use the Comments section on the product page or send a private message
- Bug Reports: Please include your broker name, account type, and a screenshot
-
✅ All MQL Tools: https://www.mql5.com/en/users/forexobroker/ ✅
--------------------------------------------------------------------------------------------------------------
🏦 **Broker I use**: https://icmarkets.com/?camp=55869
🏦 **Broker For EU Traders I use 1**: https://www.ictrading.com?camp=91414
🏦 **Broker I use 2**: https://one.exnessonelink.com/boarding/sign-up/a/c_thuv62ocfq
💻 **VPS**: https://chocoping.com/processing/aff.php?aff=738
💼 **Companies I use for getting funded**:
Fundednext: https://fundednext.com/?fpr=kestutis39
The5ers: https://www.the5ers.com/?afmc=16kl
FTMO: https://trader.ftmo.com/?affiliates=nRAyOhmFRnEnFdOpdLeh


")
")
")