")

Introduction
The Stealth Vein Indicator is an adaptive dynamic-length moving average system for MetaTrader 4 and MetaTrader 5. It expands the moving-average length automatically based on a nine-mode reset engine, layers a two-pole adaptive filter on top, and confirms sustained trend periods with ATR-banded circles and transition triangles. Two on-chart info tables provide real-time state and reset-mode guidance, and a complete alert package covers all major events.
Key Features:
- Adaptive Dynamic-Length MA: counter-driven moving average that grows during persistent regimes and resets at regime changes
- Nine Reset Modes: Slope, RSI, Volume, Bollinger, MACD, Stochastic, CCI, Momentum, None
- Two-Pole Adaptive Filter: smoother trend reference for confirmation logic
- ATR-Banded Confirmation Circles: plot at filteredTrend ± ATR(200) during sustained trends
- Transition Triangles: mark the start of each confirmed trend run
- Three-Color MA Line: up, down, and neutral colours based on stride confirmation
- Trend Cloud Fill: auto-coloured fill between MA and EMA(close, 10)
- Two Info Tables: Trend Strength (top-right) and Reset Mode Guidance (bottom-right)
- Five Alert Events x Four Channels: trend flip, confirmed up start, confirmed down start, counter break, reset state change via popup, sound, push, email
- Non-Repainting: all values computed from closed bars only
Download the indicator:
- MetaTrader 5: Stealth Vein MT5
- MetaTrader 4: Stealth Vein MT4
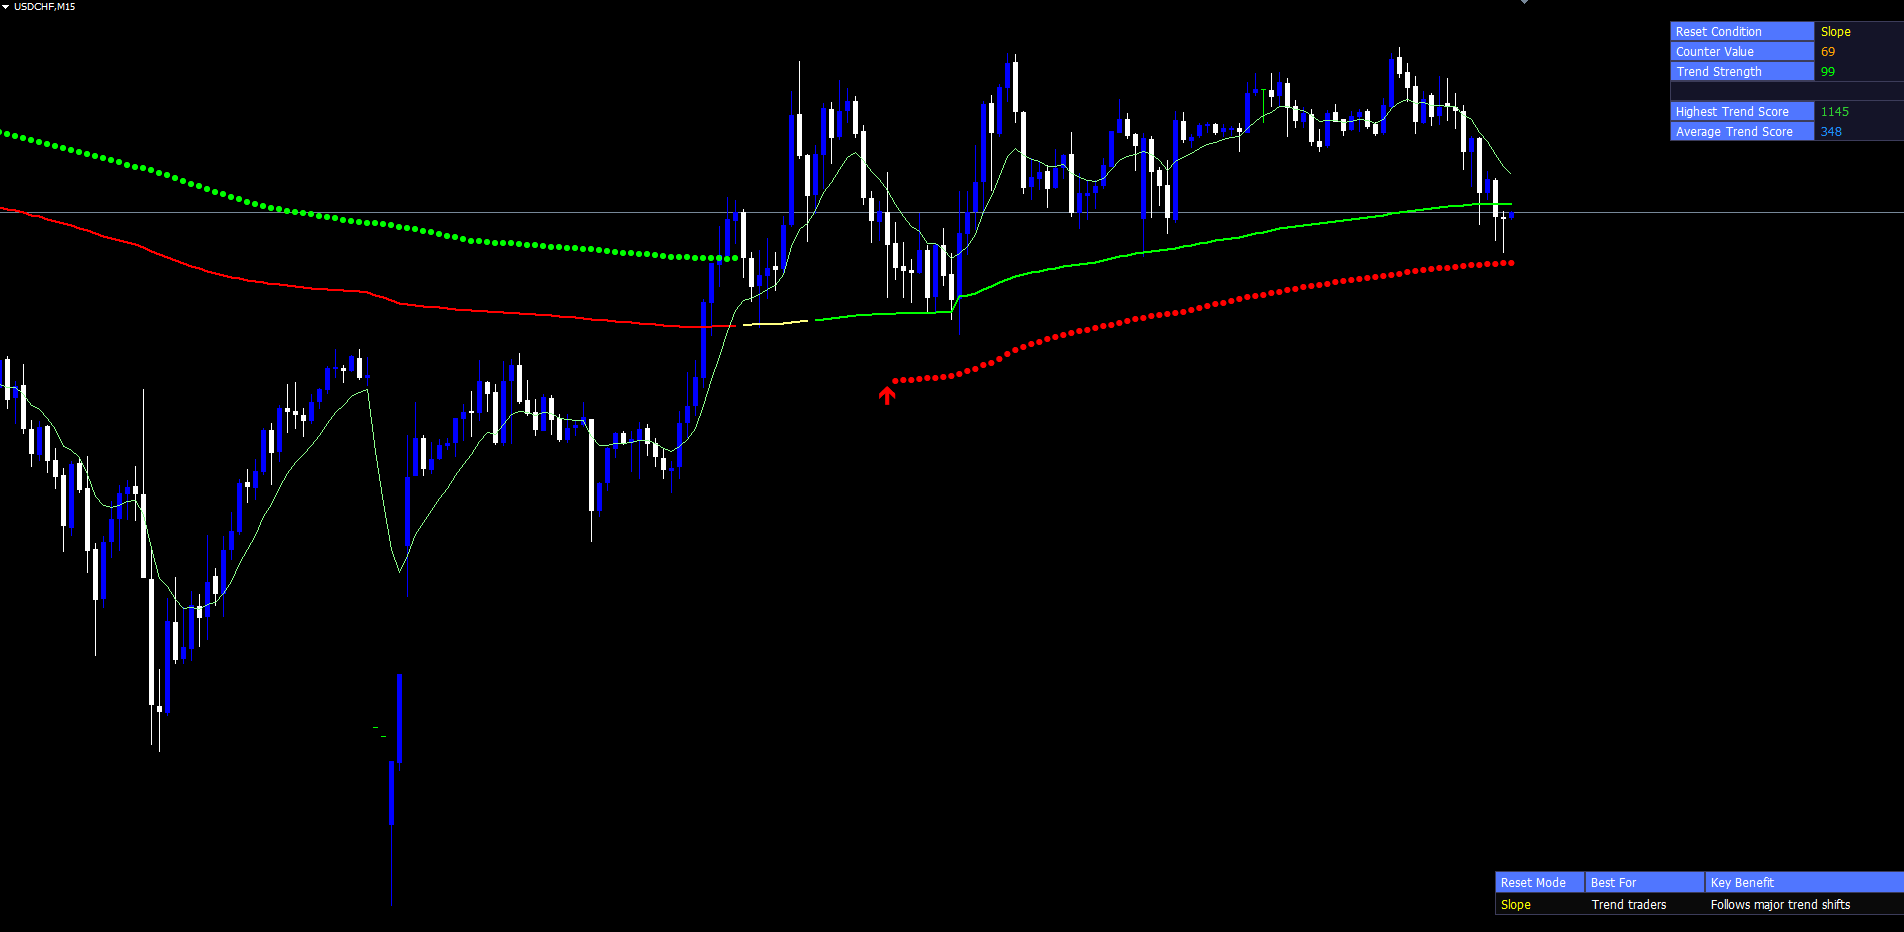
TIP: This indicator works on every symbol and every timeframe in MetaTrader. Default settings are tuned for H1 and H4 forex; lower timeframes may benefit from shorter base lengths and tighter thresholds.
Understanding the Dynamic-Length Moving Average
A standard simple moving average uses a fixed period N. If you choose N = 50 to react quickly, the same average whipsaws inside wide trends. If you choose N = 200 to filter noise, the average lags badly behind reversals. The trade-off is fundamental — until you let N change.
The Stealth Vein Indicator counts how long the market has remained in a single state. The state is defined by the active reset mode. While the state stays the same, the counter increments by 1 each bar, and the dynamic length is set to BaseLen + (counter - 1) . When the state flips, the counter snaps back to 1 and the length returns to base.
How signals are generated:
- Each bar, the active reset mode produces a state value: +1 (bullish bias), -1 (bearish bias), or 0 (neutral)
- The counter increments if the state matches the prior bar's state, or resets to 1 if not
- The dynamic moving-average length is computed as BaseLen + counter - 1 , capped by MaxDynLen
- The dynamic SMA is computed using this adaptive length
- The two-pole filter is applied to produce filteredTrend
- Trend-up and trend-down strides are incremented based on filteredTrend slope
- Once strides exceed thresholds, the line colours change and confirmation circles appear
NOTE: This is a non-repainting indicator. All stateful values are computed from closed bars and persisted into series arrays, so historical signals are stable across chart reloads.
Installation Guide
Stealth Vein Indicator is distributed through the MQL5.com Market. Installation is automatic.
Steps:
- Purchase the indicator from the MQL5 Market product page
- The indicator installs automatically into your MetaTrader terminal
- Open MetaTrader and press Ctrl+N to open the Navigator panel
- Expand Indicators > Market
- Locate Stealth Vein Indicator in the list
- Drag the indicator onto any chart, or double-click its name
- The settings dialog appears -- adjust parameters as needed
- Click OK to apply
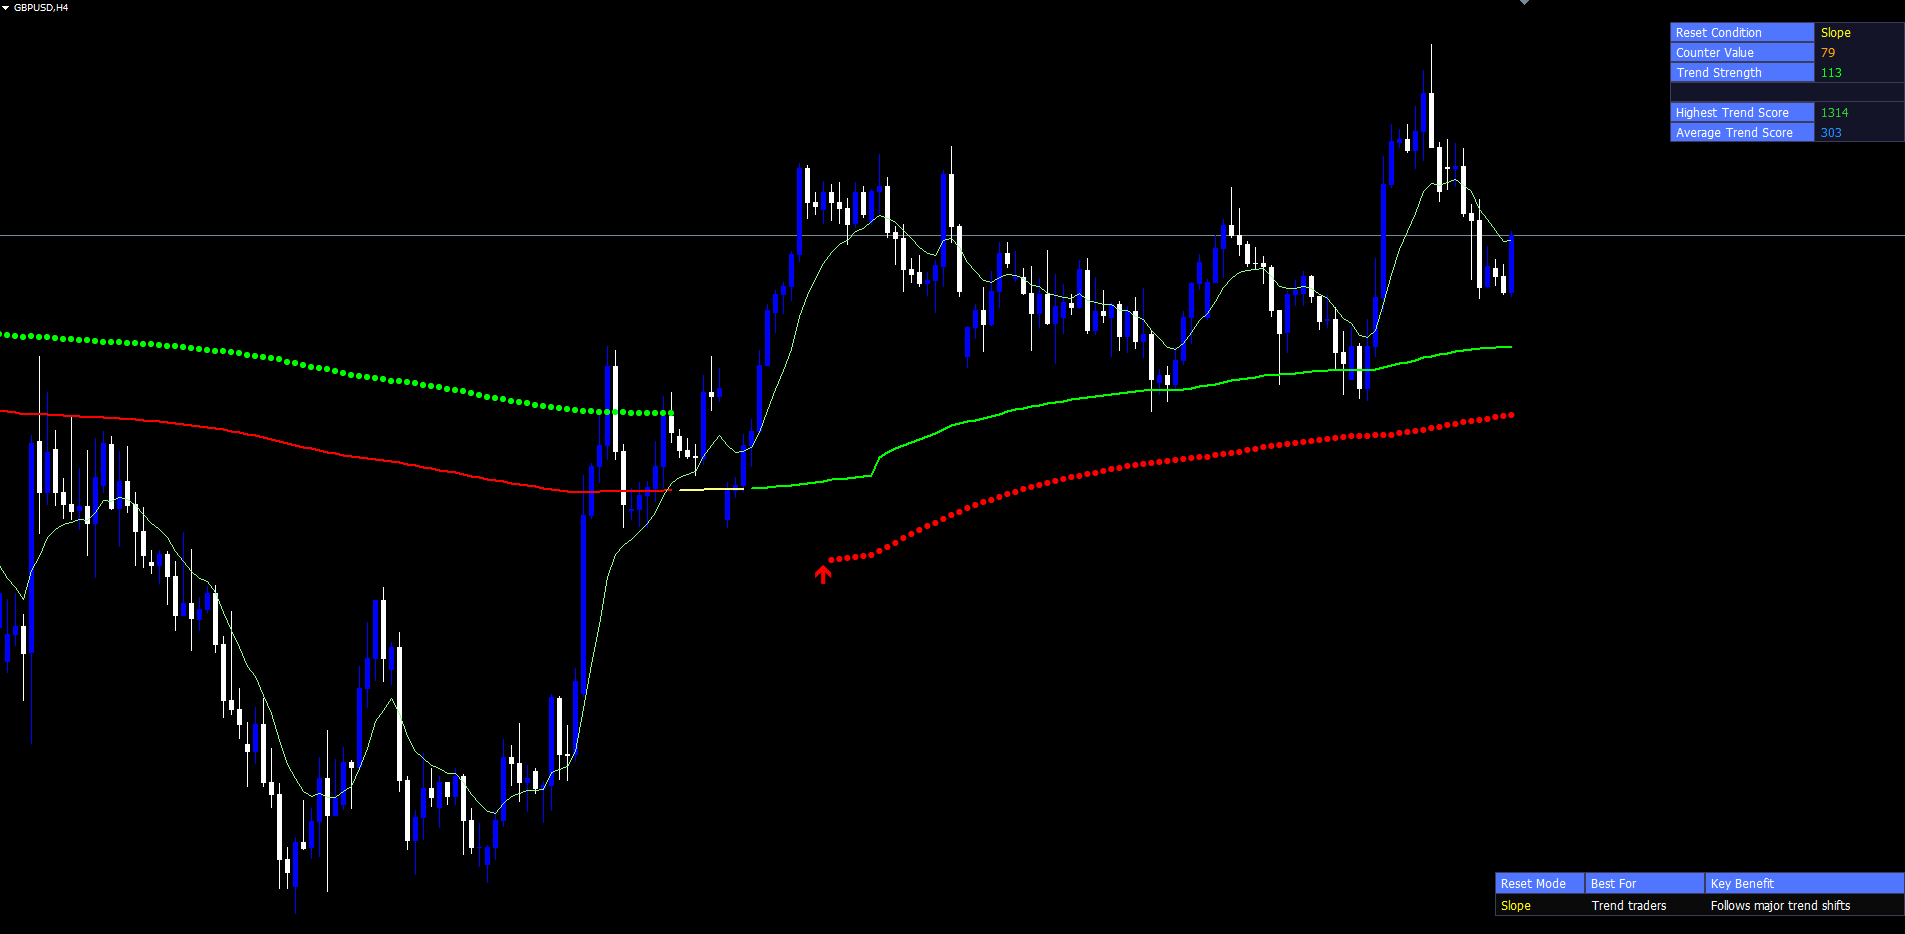
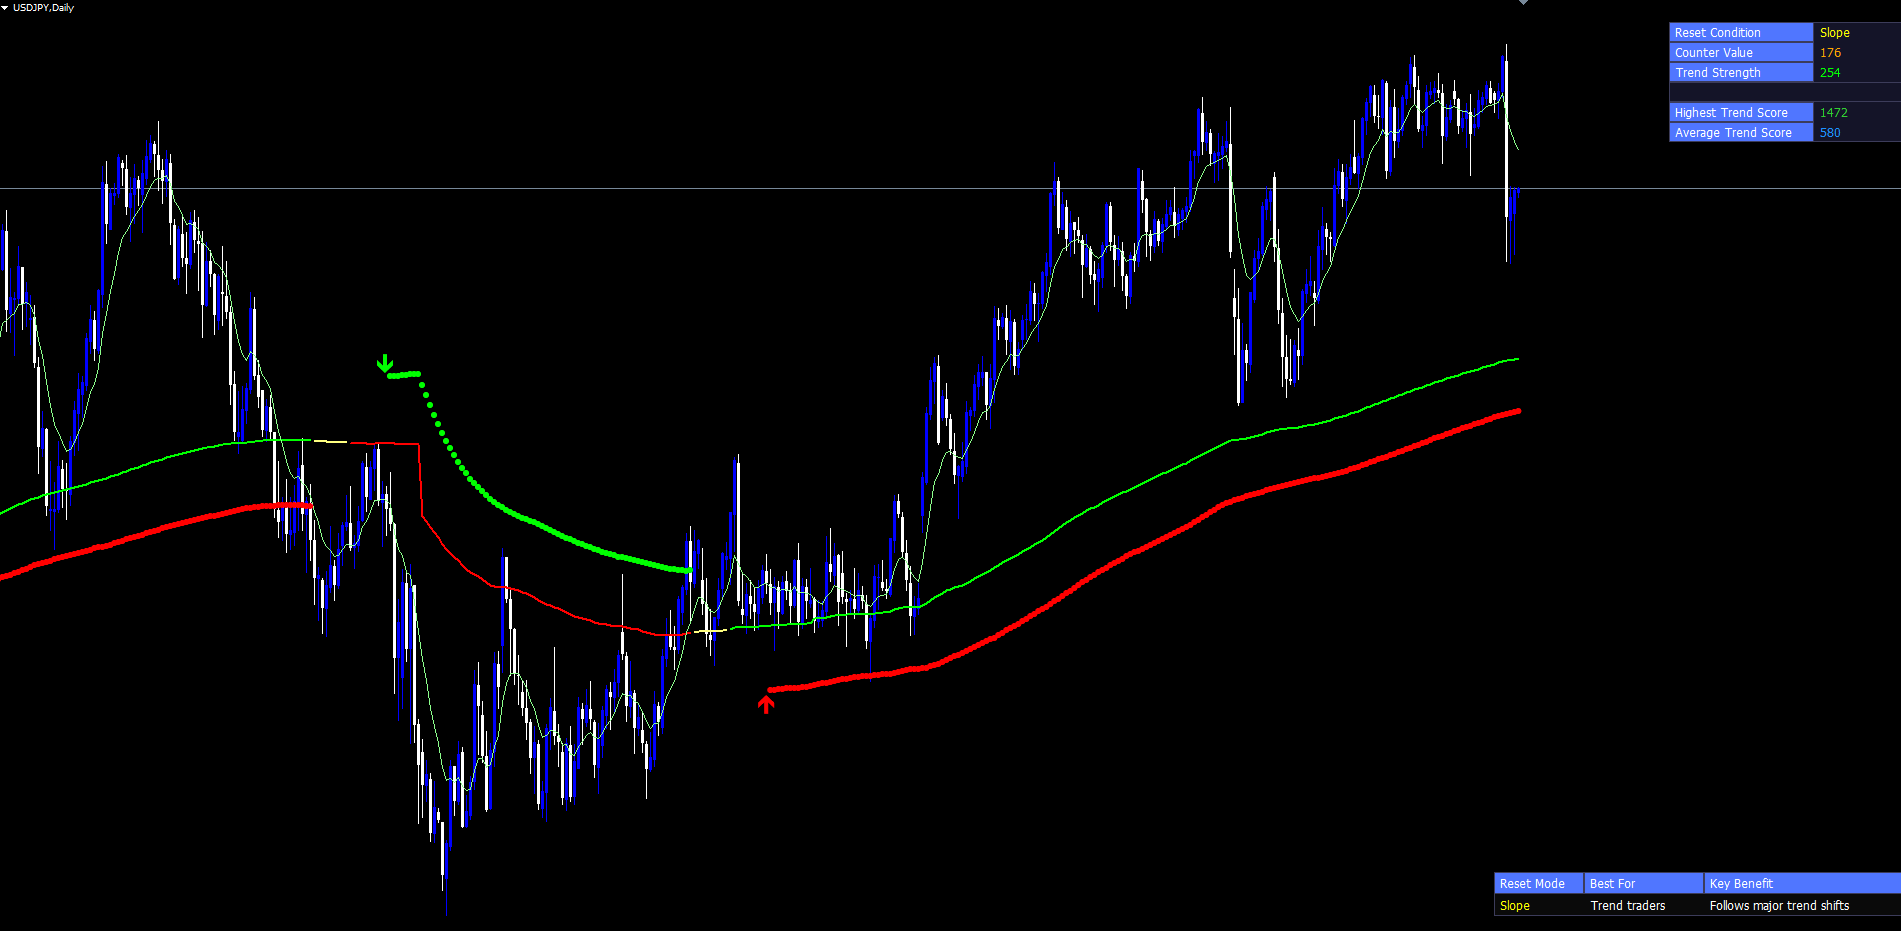
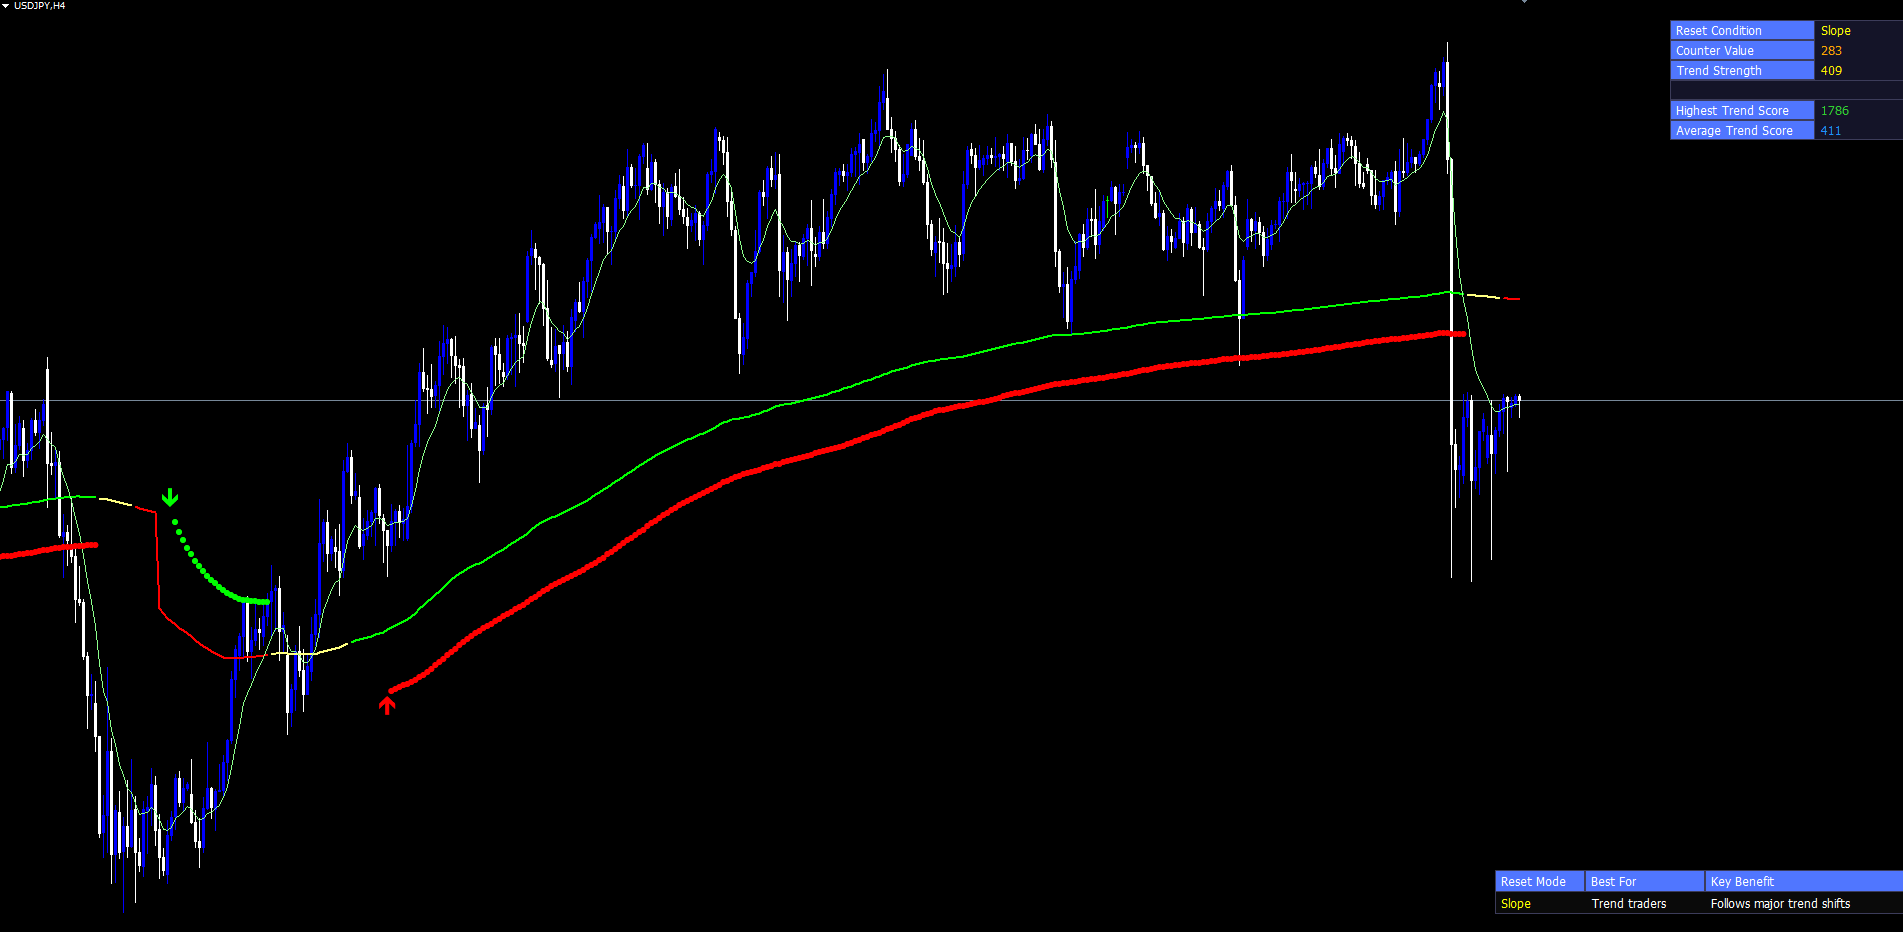
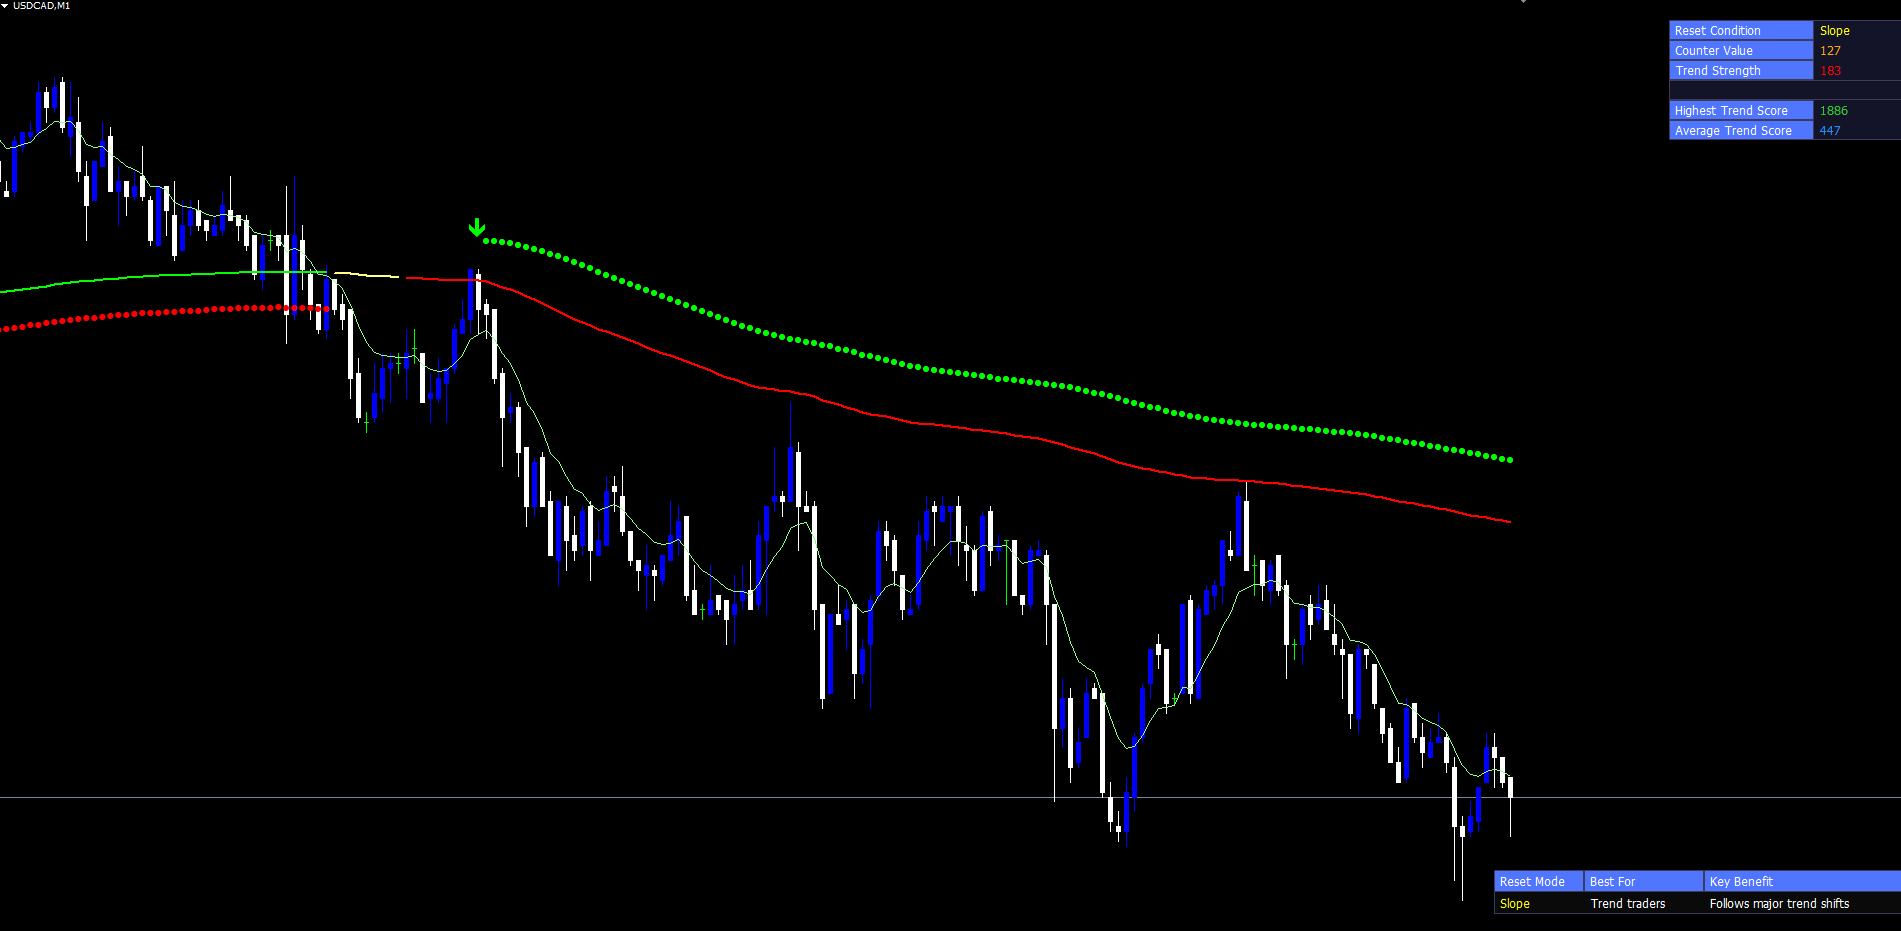
After loading, you will see:
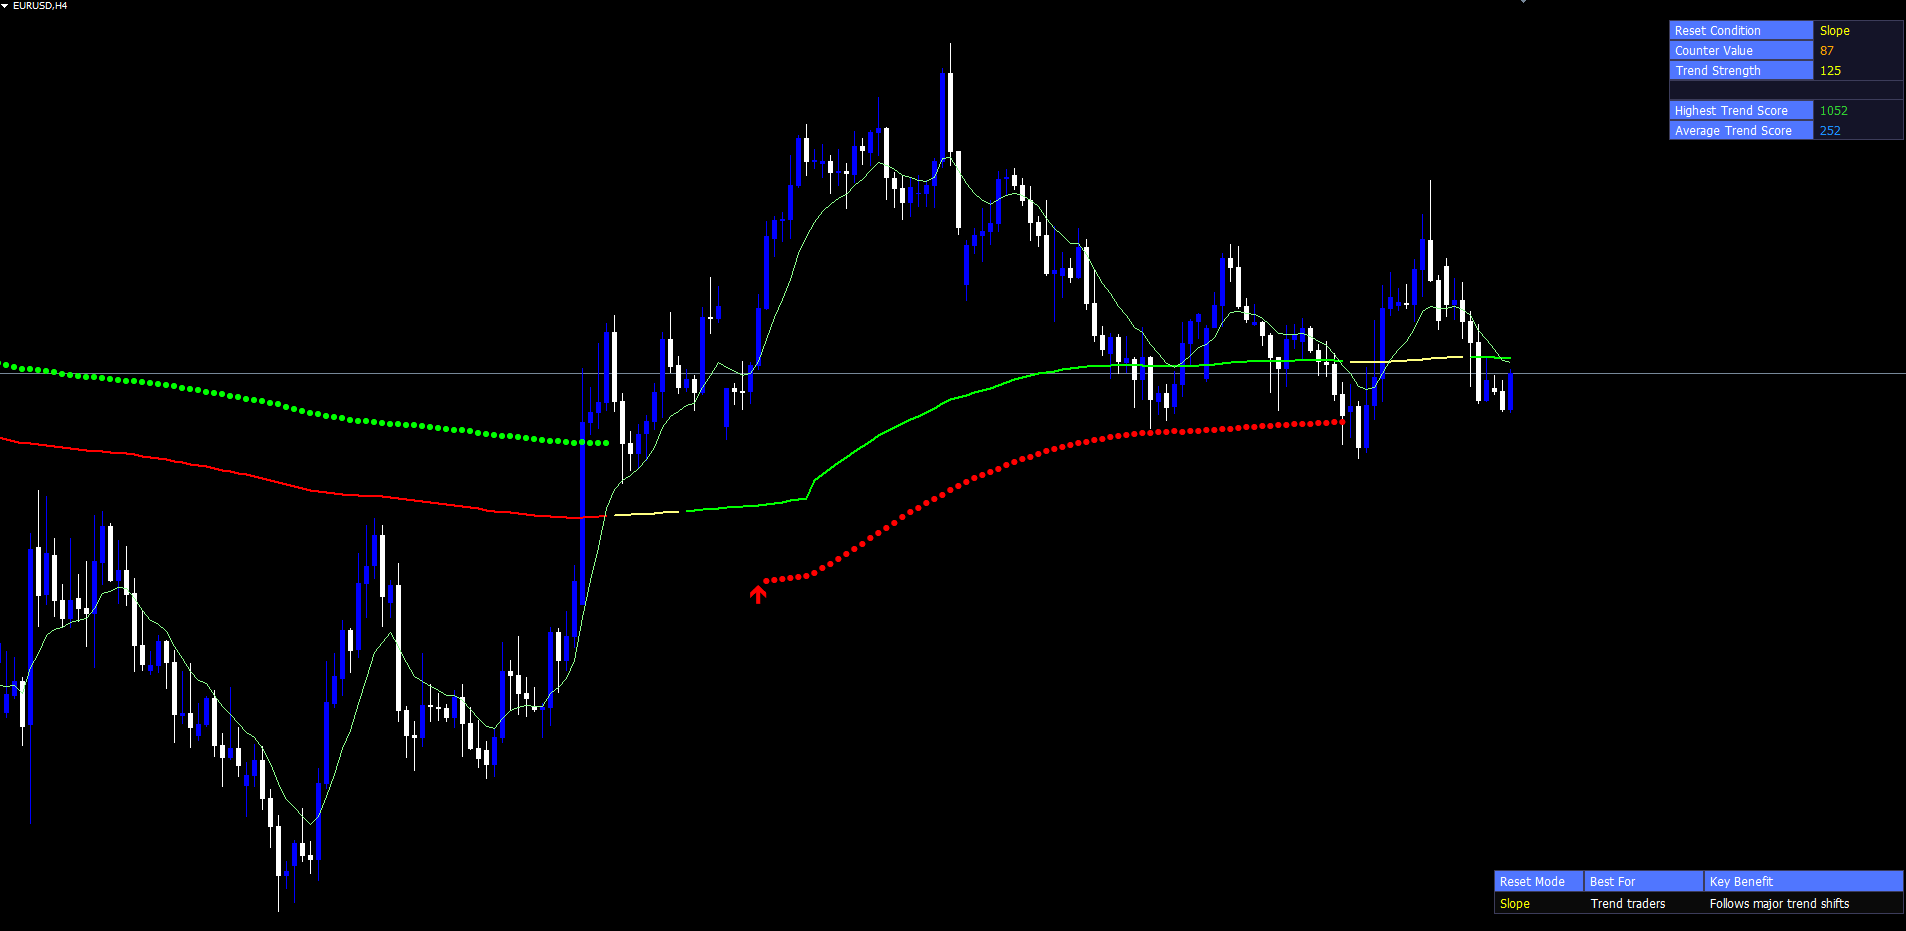
- Three-color MA line drawn in lime, red, or yellow depending on confirmation state
- Trend cloud fill in green when MA is below EMA(10), red when MA is above
- Confirmation circles at filteredTrend ± ATR during sustained trend periods
- Transition triangles at the start of each new confirmed trend
- Trend Strength table in the top-right corner showing reset condition, counter, and scores
- Reset Mode Guidance table in the bottom-right showing audience and benefit
IMPORTANT: Do not manually copy files to the data folder. The MQL5 Market handles all file placement and updates automatically.
Reset Mode Selection
The reset mode is the single most important configuration choice. It determines what signal drives the counter. Each mode targets a different trading style.
| Mode | Best For | Behaviour |
|---|---|---|
| Slope (default) | Trend traders | Counter grows while the dynamic MA slopes consistently in one direction |
| RSI | Reversal traders | Counter grows when RSI stays beyond overbought/oversold thresholds |
| Volume | Breakout traders | Counter grows during sustained above-average volume |
| Bollinger | Volatility traders | Counter grows when close stays outside the Bollinger Bands |
| MACD | Momentum traders | Counter grows while MACD remains on one side of its signal line |
| Stochastic | Short-term traders | Counter grows when raw %K stays beyond overbought/oversold |
| CCI | Cycle traders | Counter grows when CCI deviates from its midpoint band |
| Momentum | Trend traders | Counter grows when rate of change retains its sign |
| None | Baseline reference | Counter resets every bar — fixed-length SMA at BaseLen |
The bottom-right Reset Mode Guidance table updates automatically when you change modes, providing a quick reminder of each mode's intended audience.
TIP: Slope mode is the safest default. If you find that signals occur too rarely on your instrument, try Volume or RSI. If signals occur too frequently, try Slope with a longer Slope Lookback.
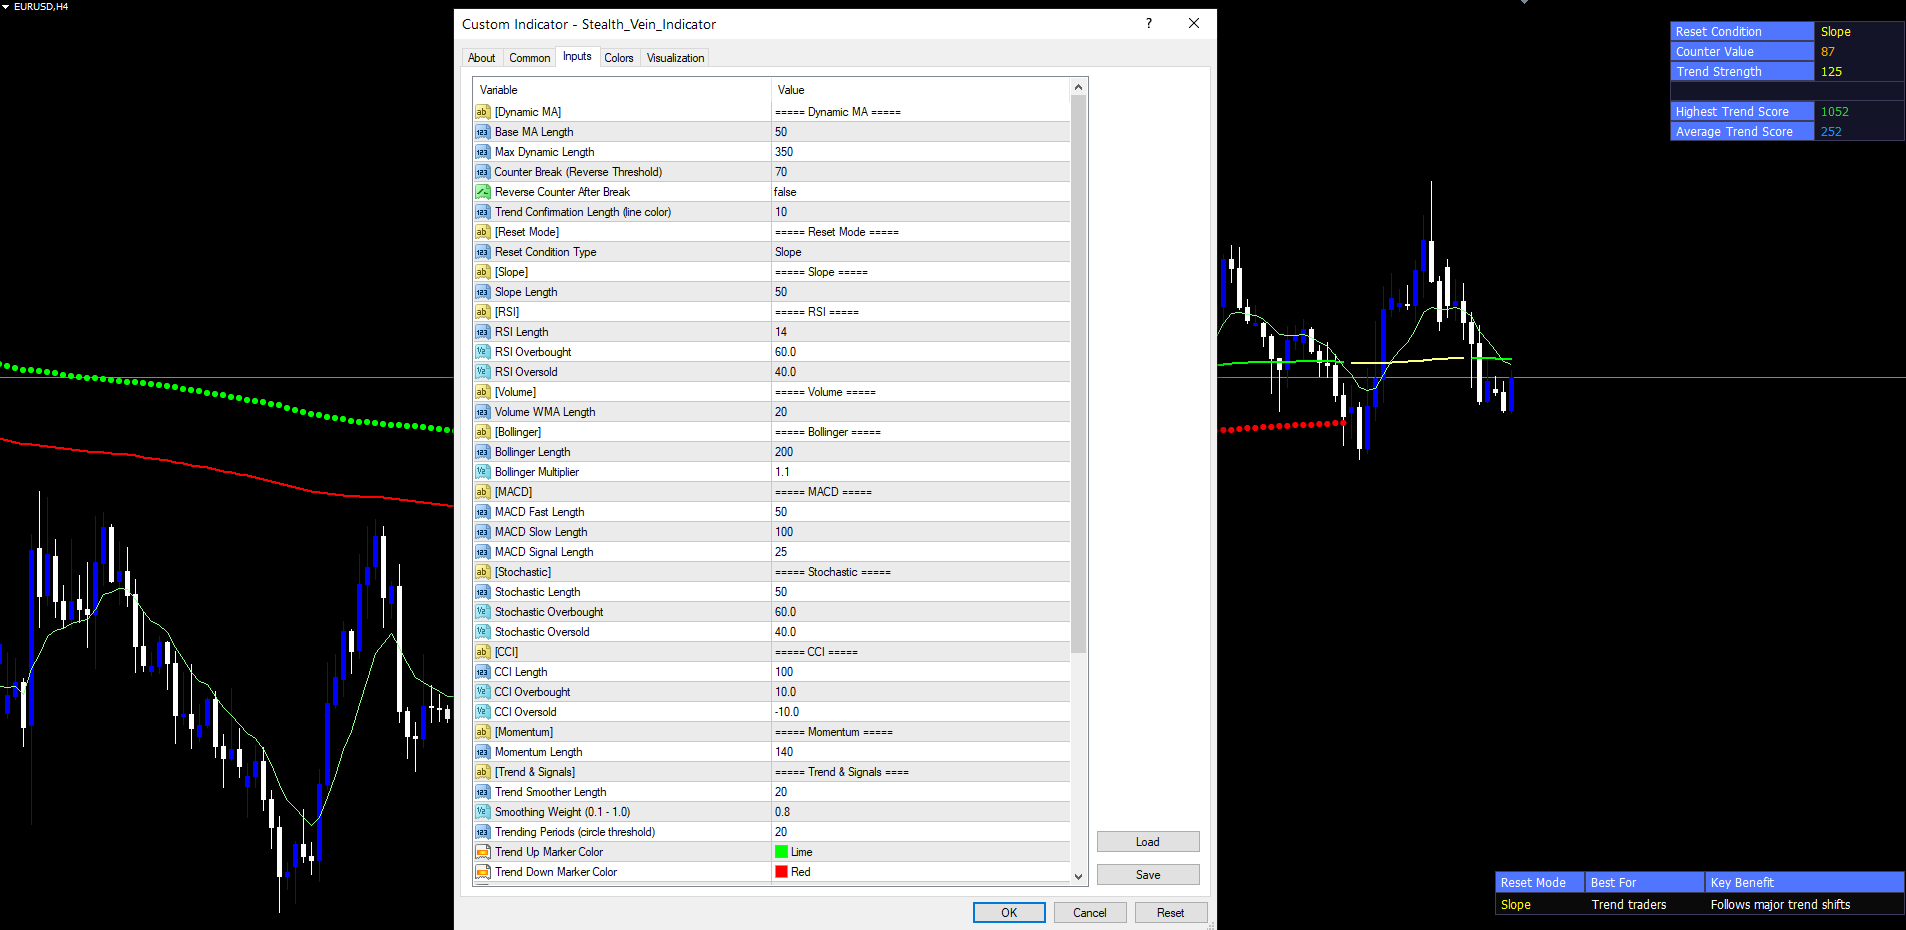
Dynamic MA Settings
These parameters control the moving average's base length, maximum length, and how the counter behaves.
| Parameter | Default | Description |
|---|---|---|
| InpBaseLen | 50 | Starting length of the dynamic moving average |
| InpMaxDynLen | 350 | Maximum length the MA can grow to |
| InpCounterBreak | 70 | Counter threshold at which reverse-counter mode flips direction |
| InpReverseCounter | false | When true, counter ping-pongs between 1 and CounterBreak |
| InpTrendingCol | 10 | Bars of one-direction filter slope to colour the MA up or down |
How the counter behaves:
- With InpReverseCounter = false (default), the counter grows by 1 each matching-state bar until it reaches BaseLen + counter - 1 = MaxDynLen . From then on, length stays at MaxDynLen.
- With InpReverseCounter = true , the counter grows up to CounterBreak , then decrements back to 1, then grows again. The MA length oscillates rhythmically inside any persistent state.
TIP: For scalping on M5-M15, reduce InpBaseLen to 20 and InpMaxDynLen to 100. For swing trading on H4-D1, the defaults are well tuned. For position trading on D1-W1, consider raising InpBaseLen to 100.
Reset Mode Specific Settings
Each reset mode has its own configuration parameters. Only the parameters for the active mode have any effect.
Slope
| Parameter | Default | Description |
|---|---|---|
| InpSlopeLookback | 50 | Bars back to compare the dynamic MA against |
RSI
| Parameter | Default | Description |
|---|---|---|
| InpRsiLength | 14 | RSI calculation period |
| InpRsiOB | 60.0 | RSI level above which the bullish state activates |
| InpRsiOS | 40.0 | RSI level below which the bearish state activates |
Volume
| Parameter | Default | Description |
|---|---|---|
| InpVolSmaLength | 20 | Length of the volume weighted moving average baseline |
Bollinger
| Parameter | Default | Description |
|---|---|---|
| InpBbLength | 200 | Bollinger Bands lookback period |
| InpBbMult | 1.1 | Standard deviation multiplier for band width |
MACD
| Parameter | Default | Description |
|---|---|---|
| InpMacdFast | 50 | MACD fast EMA length |
| InpMacdSlow | 100 | MACD slow EMA length |
| InpMacdSignal | 25 | MACD signal line length |
Stochastic
| Parameter | Default | Description |
|---|---|---|
| InpStochLength | 50 | Stochastic %K period |
| InpStochOB | 60.0 | Stochastic level above which the bullish state activates |
| InpStochOS | 40.0 | Stochastic level below which the bearish state activates |
CCI
| Parameter | Default | Description |
|---|---|---|
| InpCciLength | 100 | Commodity Channel Index period |
| InpCciOB | 10.0 | CCI level above which the bullish state activates |
| InpCciOS | -10.0 | CCI level below which the bearish state activates |
Momentum
| Parameter | Default | Description |
|---|---|---|
| InpMomentumLength | 140 | Rate of change period |
None
No additional parameters. The counter resets to 1 every bar.
TIP: When experimenting with modes, change only one parameter at a time and observe the effect on the chart before adjusting the next one.
Trend & Signals Settings
These parameters control the two-pole filter, confirmation thresholds, and marker colours.
| Parameter | Default | Description |
|---|---|---|
| InpFilterLength | 20 | Two-pole filter dominant cycle period |
| InpTrendSmoothing | 0.8 | Two-pole filter damping coefficient (0.1 - 1.0) |
| InpTrendingPeriods | 20 | Stride threshold for ATR-banded confirmation circles |
| InpTrendUpColor | clrLime | Colour for up-trend circles, triangles, and MA |
| InpTrendDnColor | clrRed | Colour for down-trend circles, triangles, and MA |
| InpGradColor | clrYellow | Neutral colour and Trend Strength gradient anchor |
Filter behaviour:
- Larger InpTrendSmoothing (closer to 1.0) produces stronger damping and a smoother filteredTrend
- Smaller values let more high-frequency content through
- InpFilterLength controls the dominant cycle: shorter values track price more closely, longer values produce a slower-moving reference
Confirmation thresholds:
- InpTrendingCol (in Dynamic MA settings, default 10) controls when the MA line changes colour
- InpTrendingPeriods (default 20) controls when ATR-banded circles appear
The MA always changes colour first, then circles appear once strides reach the higher threshold. This dual-threshold design provides early-warning colour transitions plus high-confidence circle confirmations.
Tables and Display
| Parameter | Default | Description |
|---|---|---|
| InpShowTrendStrengthTable | true | Show the Trend Strength table (top-right) |
| InpShowGuidanceTable | true | Show the Reset Mode Guidance table (bottom-right) |
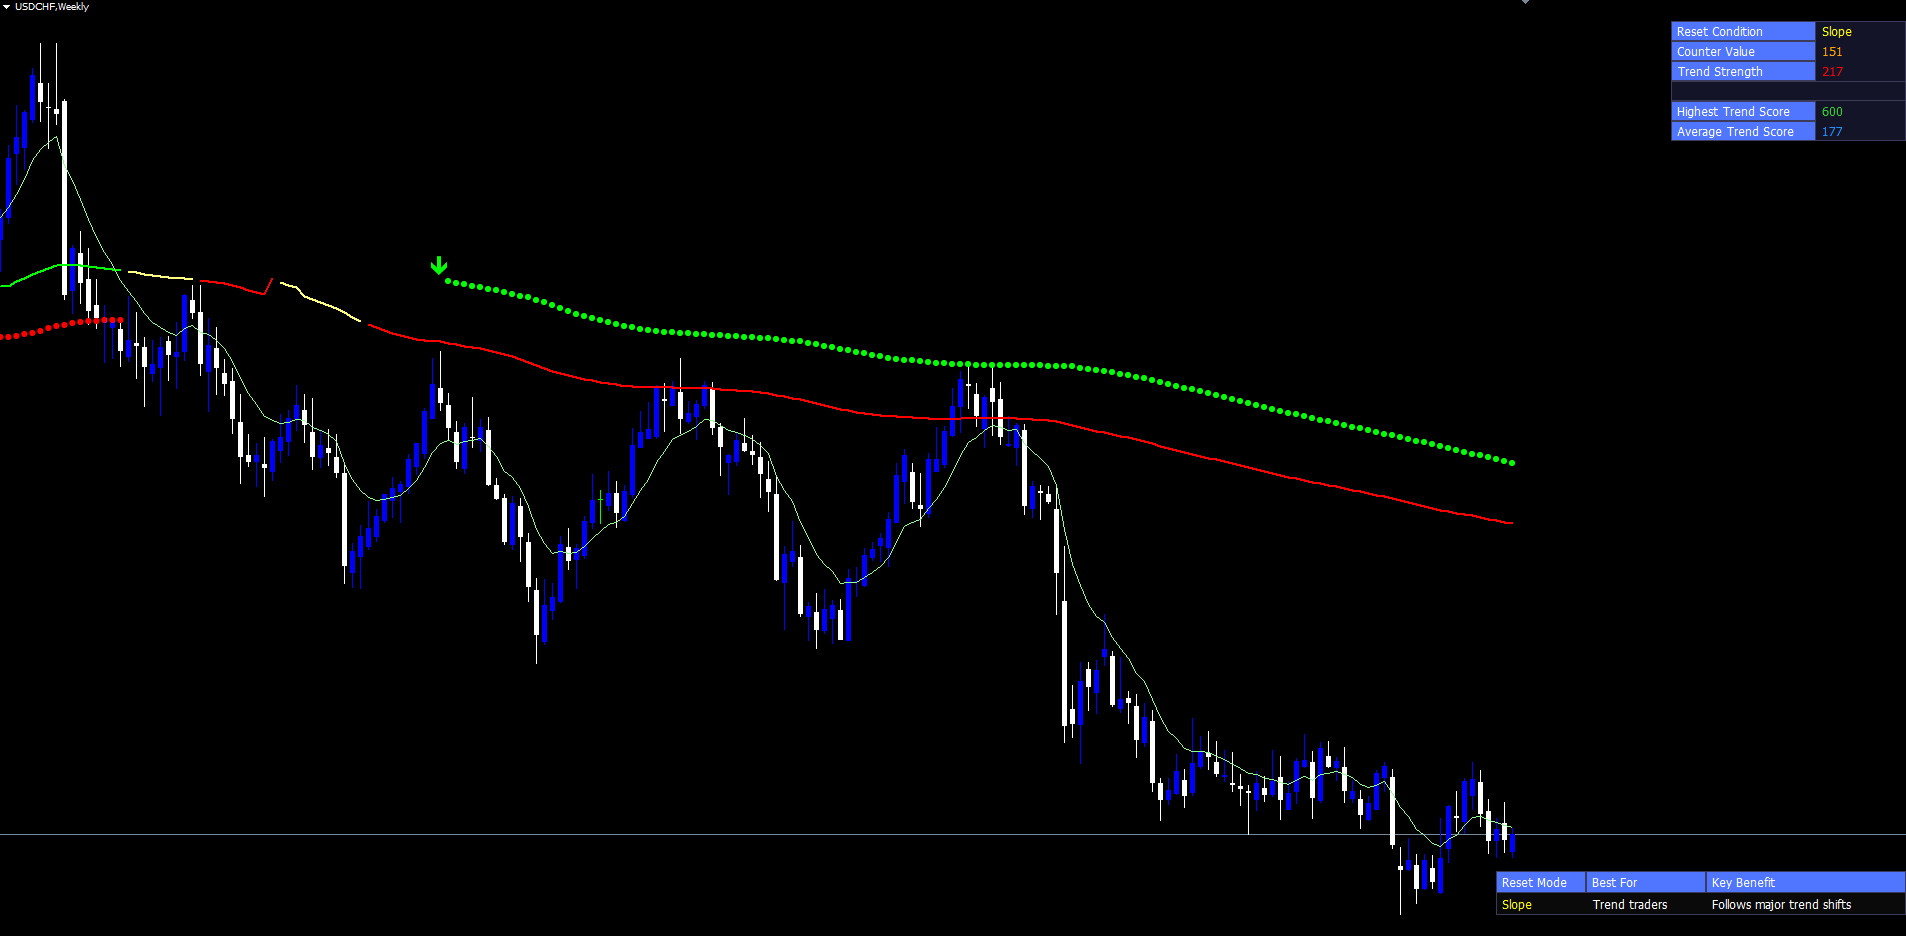
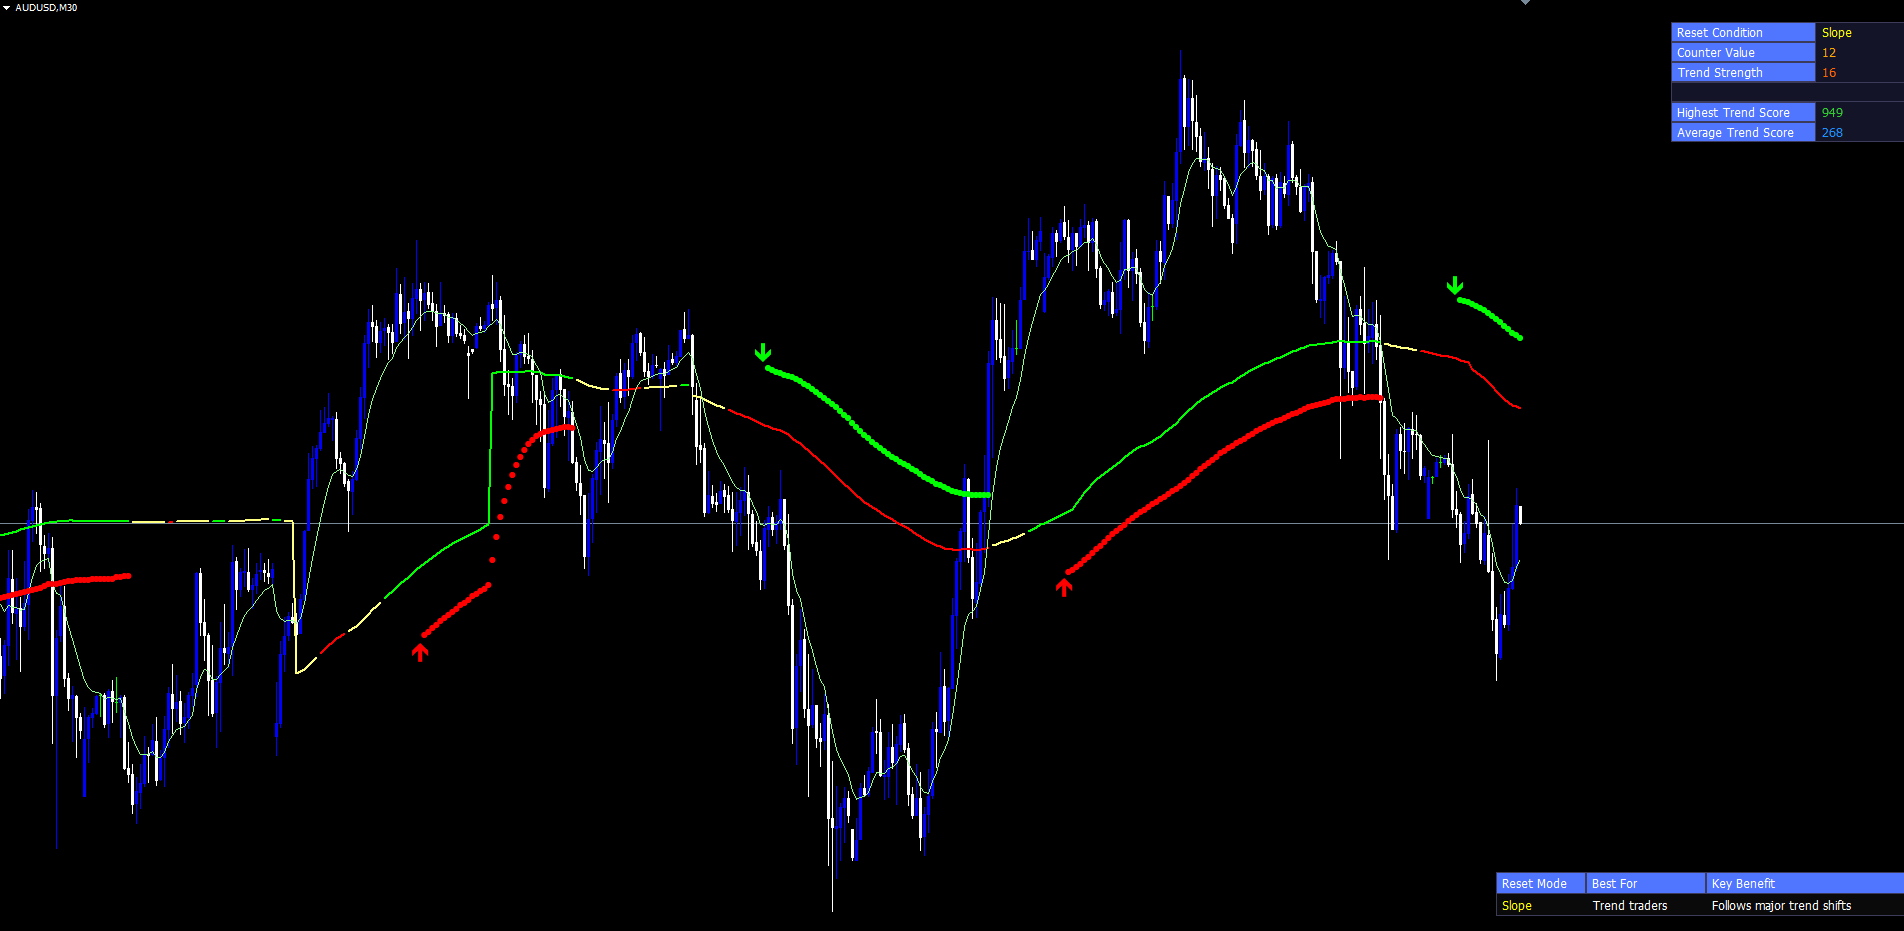
Trend Strength Table (top-right)
Six rows organized as label-value pairs (row 3 intentionally empty to match the Pine Script source):
| Row | Description |
|---|---|
| Reset Condition | Active reset mode name (Slope, RSI, Volume, etc.) |
| Counter Value | Current counter as integer, displayed in orange |
| Trend Strength | Normalized trend score (0-100) with gradient color |
| (Row 3) | Intentionally empty for visual spacing |
| Highest Trend Score | Maximum score observed since indicator started, in lime |
| Average Trend Score | Running average across all processed bars, in dodger blue |
The Trend Strength row's colour is computed through linear RGB interpolation between the neutral gradient anchor and the up-trend or down-trend colour, scaled by the corresponding stride.
Reset Mode Guidance Table (bottom-right)
Three columns showing the active mode's information:
| Column | Description |
|---|---|
| Reset Mode | Active mode name in yellow |
| Best For | Trader audience for this mode |
| Key Benefit | One-line description of the mode's strength |
TIP: Both tables can be toggled off if they overlap chart elements you need to see. The tables redraw automatically when the chart is resized.
Alert Configuration
The Stealth Vein Indicator supports five alert events and four delivery channels.
Alert Events
| Event | Default | Description |
|---|---|---|
| InpAlertTrendFlip | true | Fires when close crosses the dynamic MA |
| InpAlertConfirmedUp | true | Fires at the start of a confirmed up-trend (PosTrendStart) |
| InpAlertConfirmedDn | true | Fires at the start of a confirmed down-trend (NegTrendStart) |
| InpAlertCounterBreak | false | Fires when counter reaches CounterBreak |
| InpAlertResetState | false | Fires when the reset state value changes |
Alert Channels
| Channel | Default | Description |
|---|---|---|
| InpAlertPopup | true | Show on-screen popup dialog |
| InpAlertPush | false | Send push notification to MetaTrader mobile app |
| InpAlertEmail | false | Send email notification |
| InpAlertSound | false | Play sound file |
| InpAlertSoundFile | alert.wav | Sound file used by AlertSound channel |
Each alert fires once per bar to prevent duplicate notifications.
Enabling Push Notifications
- Install the MetaTrader mobile app on your phone (iOS or Android)
- Open the app and navigate to Settings > Messages
- Copy your MetaQuotes ID
- In the desktop MetaTrader, go to Tools > Options > Notifications
- Enter your MetaQuotes ID and enable notifications
- Set InpAlertPush = true in the indicator settings
Enabling Email Notifications
- In MetaTrader, go to Tools > Options > Email
- Check Enable
- Enter SMTP server, port, login, password, and destination email
- Click Test to verify
- Set InpAlertEmail = true in the indicator settings
Trading Strategies
The following three approaches demonstrate different ways to use the Stealth Vein Indicator. All strategies assume default filter settings unless stated otherwise.
WARNING: Trading involves significant risk of loss. These strategies are provided for educational purposes only. Always test on a demo account first and never trade with money you cannot afford to lose.
Strategy A: Trend Following with Slope Mode
Goal: Ride established trends using sustained directional persistence.
Recommended settings:
- Reset Mode = Slope (default)
- InpSlopeLookback = 50
- InpTrendingCol = 10
- InpTrendingPeriods = 20
- All alerts enabled
Trade management:
- Wait for the MA line to colour lime (up-trend confirmation)
- Enter long after the first confirmation circle appears at filteredTrend - ATR
- Place stop loss below the confirmation circle (or below the prior swing low)
- Trail the stop along subsequent confirmation circles as they form
- Exit when the line colour shifts to yellow (neutral) or red (downtrend), or when a transition triangle marks a new run in the opposite direction
Strategy B: Reversal Trading with RSI Mode
Goal: Catch turning points after extreme momentum readings.
Recommended settings:
- Reset Mode = RSI
- InpRsiLength = 14, InpRsiOB = 70, InpRsiOS = 30
- InpTrendingPeriods = 10
- Alert on Confirmed Up/Down Start enabled
Trade management:
- Watch for transition triangles in the direction opposite to the prior trend
- Confirm the new trend direction with the line colour change
- Enter at the close of the bar where the triangle appears
- Place stop loss beyond the most recent extreme price (swing high for shorts, swing low for longs)
- Take profit at the first confirmation circle in the new direction or at fixed risk-reward (e.g., 1:2)
Strategy C: Multi-Mode Confirmation
Goal: Use multiple modes simultaneously across multiple chart instances for high-conviction entries.
Setup:
- Open the same chart in three windows
- On chart 1, set Reset Mode = Slope
- On chart 2, set Reset Mode = MACD
- On chart 3, set Reset Mode = RSI
- Enable Confirmed Up/Down Start alerts on all three
Trade rule:
- Enter only when at least two of the three charts show alignment (same trend direction confirmed by their respective indicators)
- This compound confirmation reduces false signals at the cost of fewer trades per session
TIP: Strategy C works best when paired with a clear higher-timeframe bias (for example, only take longs when the daily MA is sloping up).
Parameter Tuning Presets
The following preset tables provide starting points for different trading styles.
Scalping Preset (M5 - M15)
| Parameter | Scalping Value |
|---|---|
| InpBaseLen | 20 |
| InpMaxDynLen | 100 |
| InpCounterBreak | 30 |
| InpFilterLength | 10 |
| InpTrendingCol | 5 |
| InpTrendingPeriods | 10 |
| InpResetMode | Slope or Stochastic |
Swing Trading Preset (H1 - H4)
| Parameter | Swing Value |
|---|---|
| InpBaseLen | 50 |
| InpMaxDynLen | 350 |
| InpCounterBreak | 70 |
| InpFilterLength | 20 |
| InpTrendingCol | 10 |
| InpTrendingPeriods | 20 |
| InpResetMode | Slope or MACD |
Position / Conservative Preset (H4 - D1)
| Parameter | Conservative Value |
|---|---|
| InpBaseLen | 100 |
| InpMaxDynLen | 500 |
| InpCounterBreak | 100 |
| InpFilterLength | 30 |
| InpTrendingCol | 15 |
| InpTrendingPeriods | 30 |
| InpResetMode | Slope or Bollinger |
TIP: Start with the Swing Trading preset and adjust one parameter at a time. Observe the effect on signal frequency and quality before changing additional values.
Troubleshooting
Indicator Does Not Display Anything
- Ensure the chart has at least 250 bars of history. The indicator's warmup covers Bollinger length, momentum length, and ATR(200).
- Wait a few seconds after loading on a fresh chart for MT5 indicator handles to populate.
- Verify the indicator name in Navigator > Indicators > Market matches Stealth Vein Indicator .
No Confirmation Circles Visible
- Strides may not have reached the threshold. Reduce InpTrendingPeriods to 10 to lower the requirement.
- The active reset mode may produce frequent state changes that prevent strides from accumulating. Try Slope mode with a longer InpSlopeLookback .
- Verify that InpTrendingPeriods is not set higher than the typical trend duration on your timeframe.
MA Line Stays Mostly Yellow (Neutral)
- InpTrendingCol may be too high for the active filter length. Reduce to 5.
- The two-pole filter may be too damped. Reduce InpTrendSmoothing to 0.5 to allow more high-frequency content through.
Counter Never Grows Beyond Small Values
- The active reset mode is producing frequent state flips. Try a longer-lookback mode (Bollinger 200, MACD 50/100, or Slope 50).
- Volume mode may show frequent flips on quiet sessions; switch to Slope or RSI on instruments with low or stable volume.
Tables Overlap Chart Action
- Both tables anchor to the right corners. Resize the chart wider or set InpShowTrendStrengthTable and InpShowGuidanceTable to false.
- Tables redraw automatically when the chart is resized.
Alerts Not Firing
- Check that the specific event flag (e.g., InpAlertTrendFlip ) is enabled
- For push notifications: verify your MetaQuotes ID in Tools > Options > Notifications and that InpAlertPush = true
- For email: verify SMTP settings in Tools > Options > Email and that InpAlertEmail = true
- Alerts fire only once per bar per event. If you missed an alert, you will not receive a duplicate on the same bar
Different Visuals on MT4 vs MT5
- The internal calculation logic is identical, but minor differences in tick volume feeds between MT4 and MT5 brokers can cause Volume mode to behave slightly differently
- Cloud and line colours are locked at compile time through #property directives, ensuring identical rendering across both platforms
Frequently Asked Questions
Does the indicator repaint?
No. All stateful values are computed from closed bars only. The forward-walk processing model populates persistent series arrays so historical signals remain stable across chart reloads, timeframe switches, and broker reconnects.
Can I use it on cryptocurrency or stock charts?
Yes. The indicator is symbol-agnostic. The volatility-adjusted ATR bands automatically scale to the instrument's typical range. For symbols without reliable tick volume data (some CFDs, some crypto pairs), avoid Volume mode and choose Slope, MACD, or RSI instead.
Does it work in Strategy Tester?
Yes. The indicator runs in MetaTrader's built-in Strategy Tester. Note that Tester uses tick volume from the modelled tick data, which may differ from live tick volume on some brokers.
What's the best timeframe?
H1 and H4 give the best balance between signal frequency and noise reduction with default settings. M30 works well with the Scalping preset. D1 and W1 work with the Conservative preset.
Why are the circles plotted on the "wrong" side?
The circle mapping is intentionally inverted, faithful to the Pine Script source. When the trend-down stride is high (many bars of falling filteredTrend = strong down-trend confirmation), the up-circle appears at filteredTrend + ATR(200) marking where price would need to travel to invalidate the trend. The opposite mapping applies to up-strides.
Can I disable individual visual elements?
Tables can be toggled via InpShowGuidanceTable and InpShowTrendStrengthTable . The line colours, cloud fill, circles, and triangles are part of the core visual design and can be hidden by setting their colour to clrNone in MetaTrader's Colors tab after attaching the indicator.
Download the indicator:
- MetaTrader 5: Stealth Vein MT5
- MetaTrader 4: Stealth Vein MT4
CONTACT & SUPPORT
- Email: info@forexobroker.com
- Questions: Use the Comments section on the product page or send a private message
- Bug Reports: Please include your broker name, account type, and a screenshot
-
✅ All MQL Tools: https://www.mql5.com/en/users/forexobroker/ ✅
--------------------------------------------------------------------------------------------------------------
🏦 **Broker I use**: https://icmarkets.com/?camp=55869
🏦 **Broker For EU Traders I use 1**: https://www.ictrading.com?camp=91414
🏦 **Broker I use 2**: https://one.exnessonelink.com/boarding/sign-up/a/c_thuv62ocfq
💻 **VPS**: https://chocoping.com/processing/aff.php?aff=738
💼 **Companies I use for getting funded**:
Fundednext: https://fundednext.com/?fpr=kestutis39
The5ers: https://www.the5ers.com/?afmc=16kl
FTMO: https://trader.ftmo.com/?affiliates=nRAyOhmFRnEnFdOpdLeh
Risk Disclaimer
Trading foreign exchange and CFDs on margin carries a high level of risk and may not be suitable for all investors. You may sustain a loss exceeding your initial investment. Trend Quorum is a technical analysis tool and does not guarantee profitable trades. Past performance is not indicative of future results. The authors accept no liability for any loss arising from use of the indicator. By using Trend Quorum you acknowledge sole responsibility for your trading decisions.


")
![[XAUUSD]: Weekly Liquidity Activation Points (timings), June 22-26, 2026](https://c.mql5.com/6/1013/splash-preview-771790.png "[XAUUSD]: Weekly Liquidity Activation Points (timings), June 22-26, 2026")
")