Seven years, 1,425 trades: what one gold backtest can tell you (and what it cannot)

A backtest is not a promise. It is a measurement of how a fixed set of rules behaved on historical data. Read that way, it is one of the most useful documents a trader can study. Read as a preview of future profits, it is one of the most dangerous. This post walks through one concrete example: the MT5 backtest of our upcoming six-engine gold portfolio, and what each number does and does not mean.
The raw numbers, all from the backtest
Every figure below comes from a single MT5 Strategy Tester run on XAUUSD, 2020 to 2026, with a fixed 0.01 lot per engine. These are backtest results: past performance does not guarantee future results.
- 1,425 trades over roughly seven years.
- Net profit of +4,512 USD at 0.01 lot per engine.
- Profit factor 1.67.
- Maximum drawdown 326 USD.
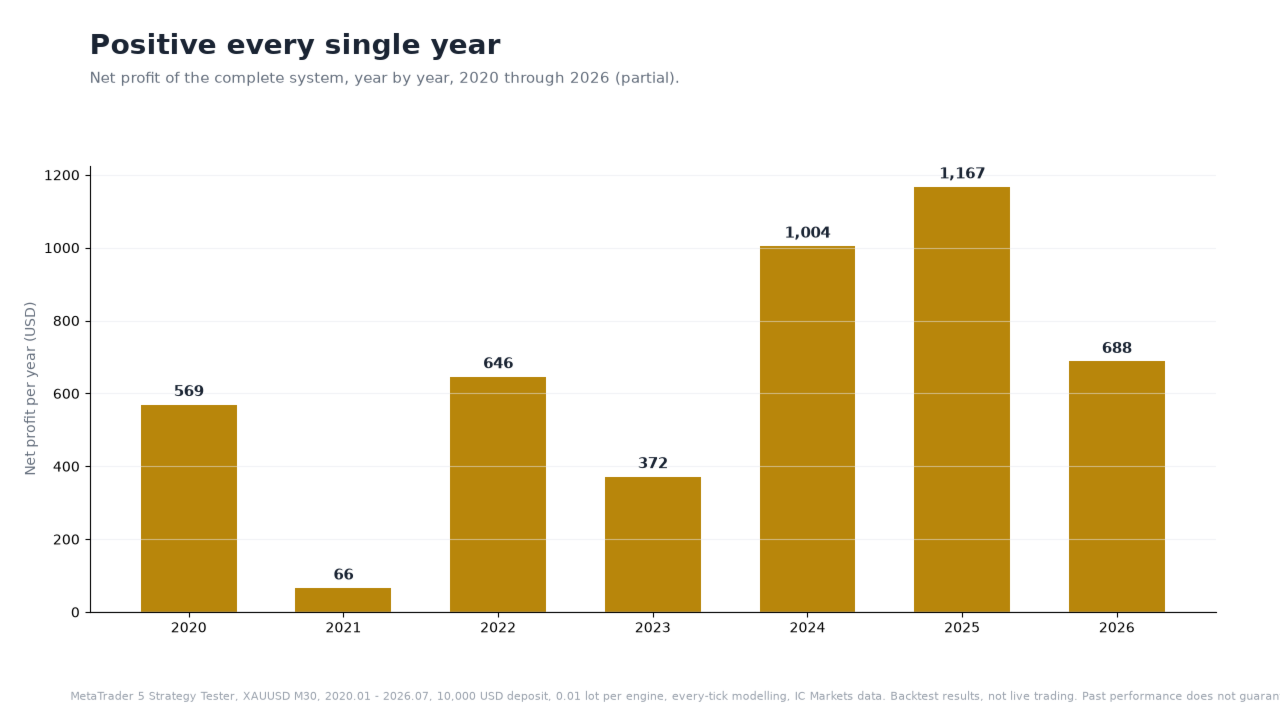
- Positive result in 7 years out of 7.
What the trade count tells you
1,425 trades is a sample, not an anecdote. With 30 trades, a lucky streak can dress up a broken system. With more than a thousand, the law of large numbers starts to work for you: the average behavior of the rules becomes measurable, and single outliers stop dominating the statistics. It still proves nothing about the future, but it makes the historical measurement itself trustworthy.
What profit factor and drawdown tell you together
A profit factor of 1.67 means that, in the test, gross profits were 1.67 times gross losses. Alone, that number can hide ugly paths. That is why it must be read next to the maximum drawdown: 326 USD against a net result of +4,512 USD describes a historical path where the worst valley stayed small relative to the overall climb. The ratio between what you historically made and what you historically had to sit through is, for us, more informative than either number alone.
What the yearly breakdown tells you
Seven positive years out of seven, in the backtest, is the statistic we care about most. Gold from 2020 to 2026 went through very different regimes: quiet ranges, a pandemic, rate hikes, strong trends. A rule set that stayed positive across all of them, in testing, at least demonstrated that it was not fitted to one single market mood. One spectacular year and six flat ones would tell a very different story than the one in the chart below.
What no backtest can tell you
Here is the honest part, and it applies to our tests exactly as it applies to anyone else's.
- Real slippage. The tester fills you at the price the model proposes. A live server fills you at the price available when your order arrives. On gold, during fast moves, those are not always the same price.
- Variable spread. Historical testing simplifies spread behavior. Live spread on XAUUSD widens around news and rollover, and every widening is a small tax the backtest did not fully pay.
- The future itself. The market that produced 2020 to 2026 is under no obligation to repeat. New regimes can and will appear. A backtest measures the past by definition; it cannot measure what has not happened yet.
Our answer to that gap: a live signal
Because those three gaps are real, we do not ask anyone to trust the tester alone. The portfolio is already running live on a demo account, and the signal will be public shortly, so the forward results, with real spread and real fills, can be watched trade by trade and compared against the backtest. If the live behavior drifts far from the tested behavior, that is exactly the kind of thing a public track record is meant to expose.
How to use this yourself
Whenever you evaluate an EA, ours or anyone's, ask the same four questions: how many trades is the claim based on, what was the worst drawdown relative to the result, was it positive across different years, and is there a live record you can follow forward. If you want to practice on something free, our Wonder 8 EA for USDJPY costs nothing and can be backtested and demo-traded with the exact method above.
All performance figures in this post are backtest results. Past performance does not guarantee future results, and no automated strategy removes the risk of loss.