")

Introduction
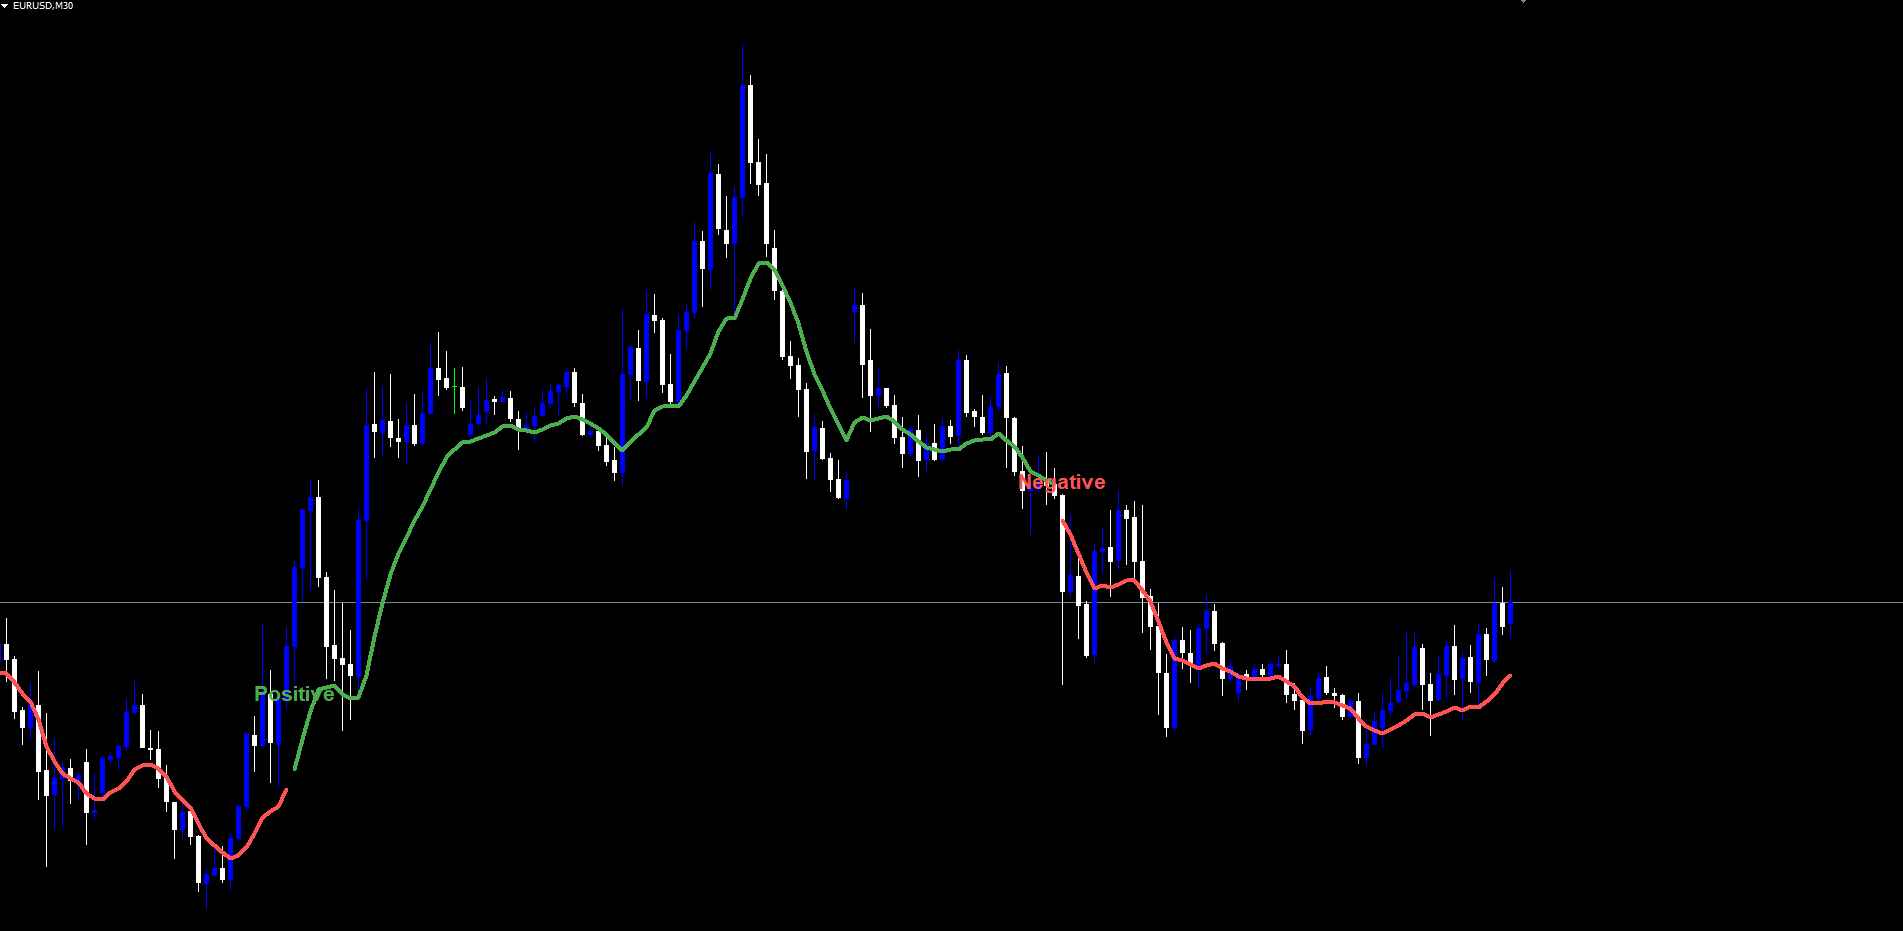
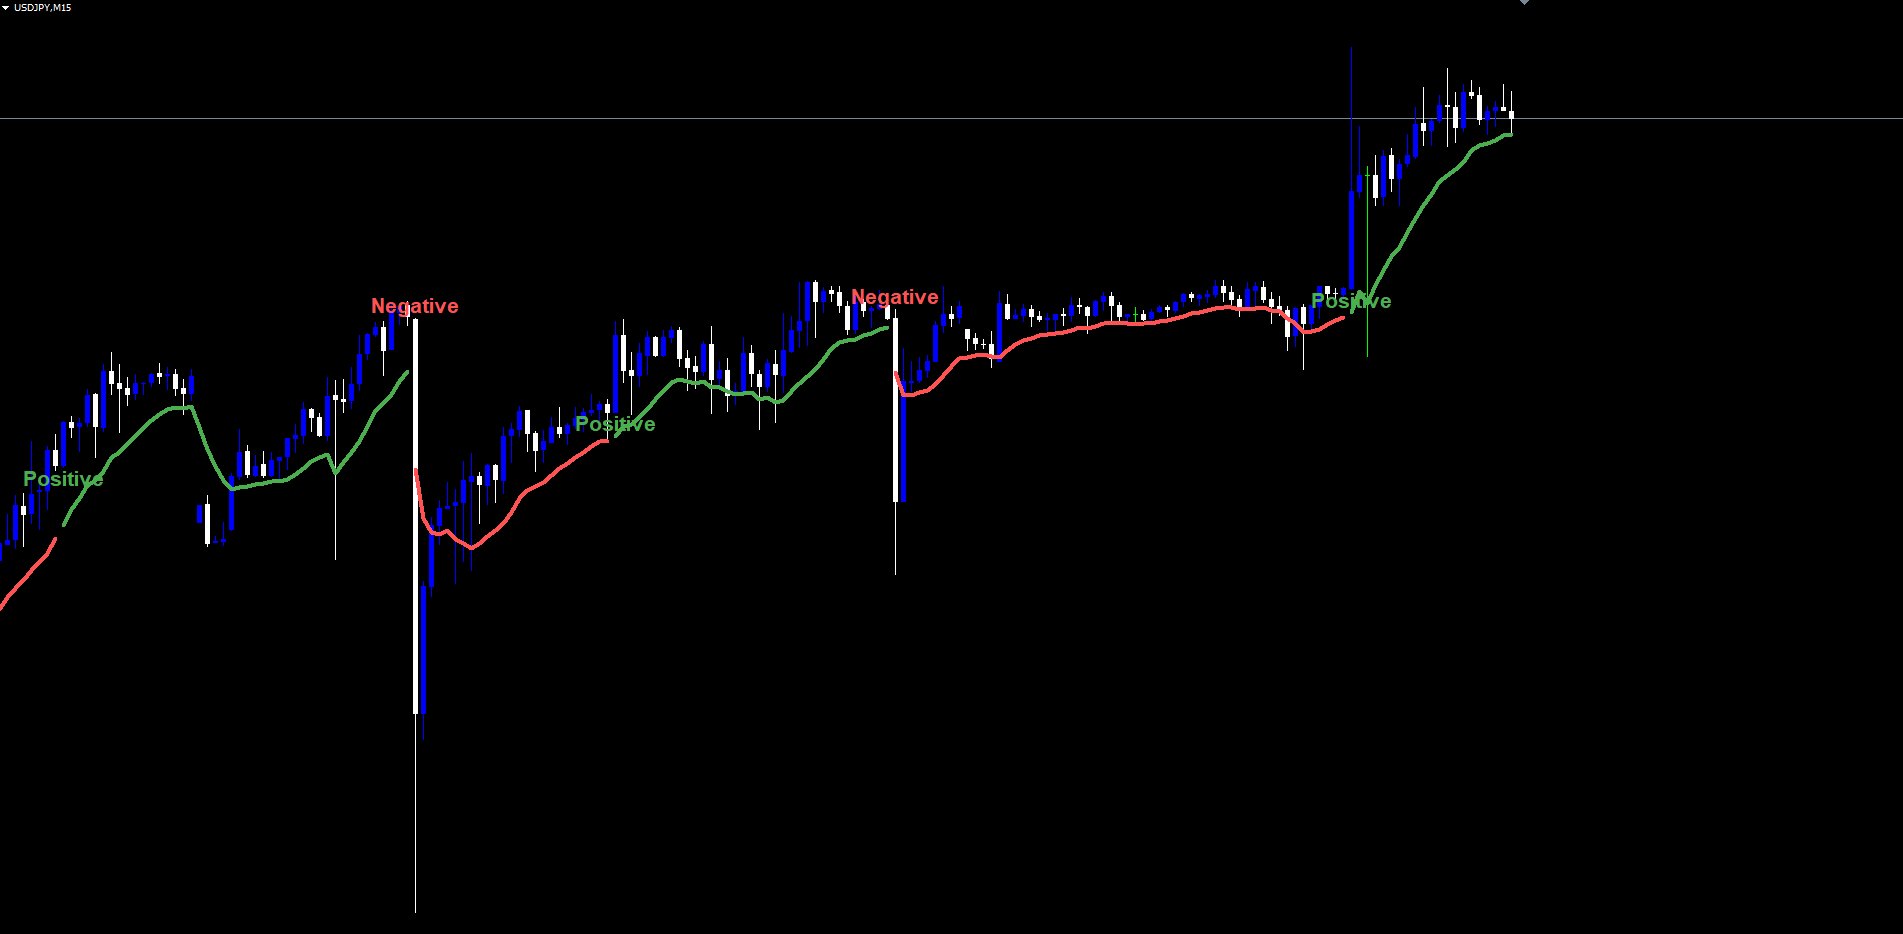
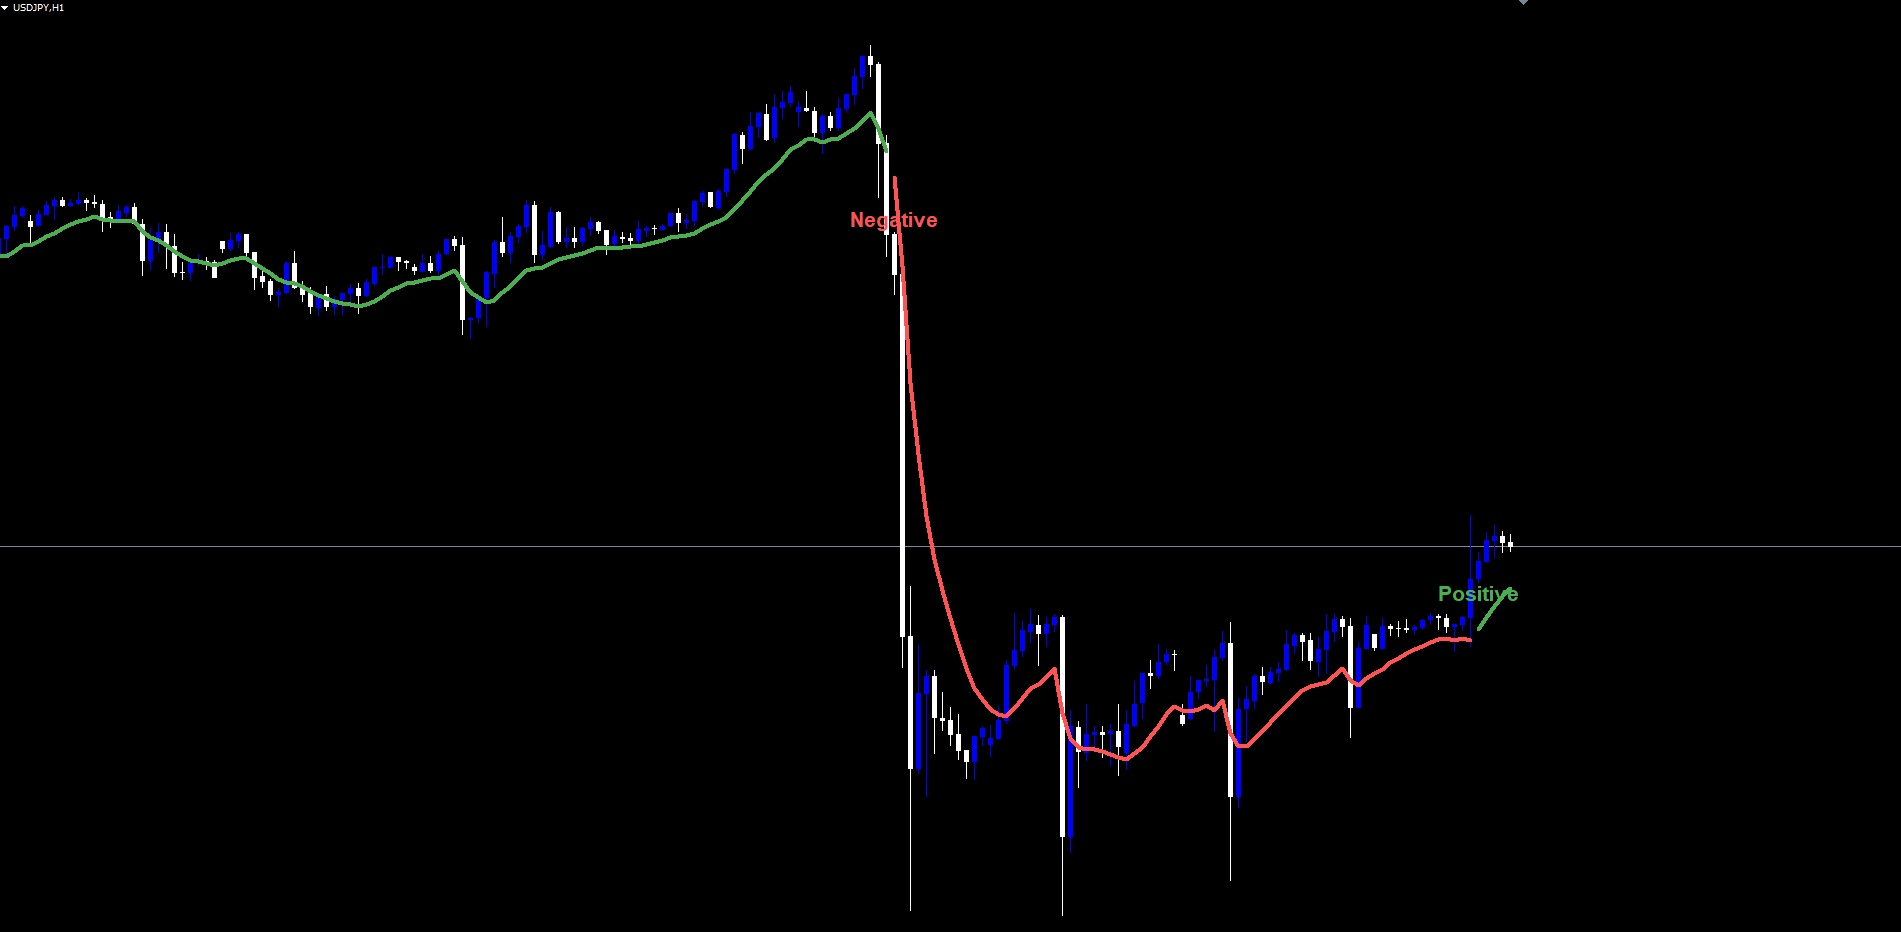
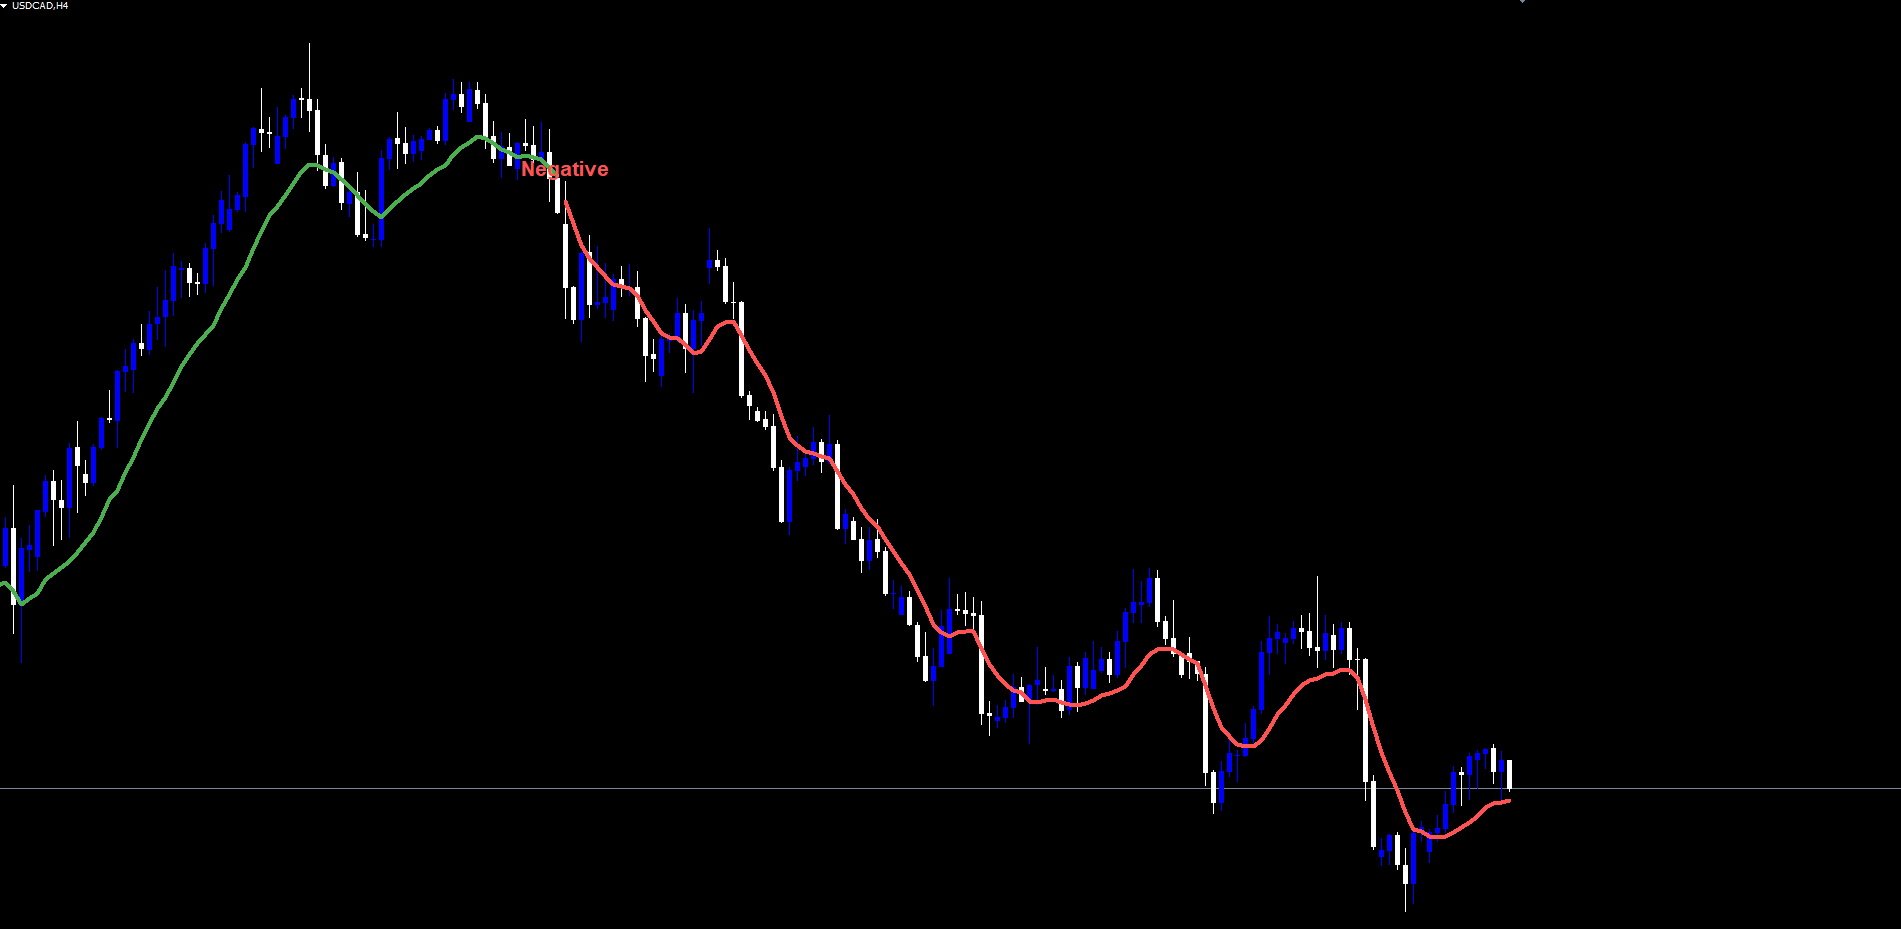
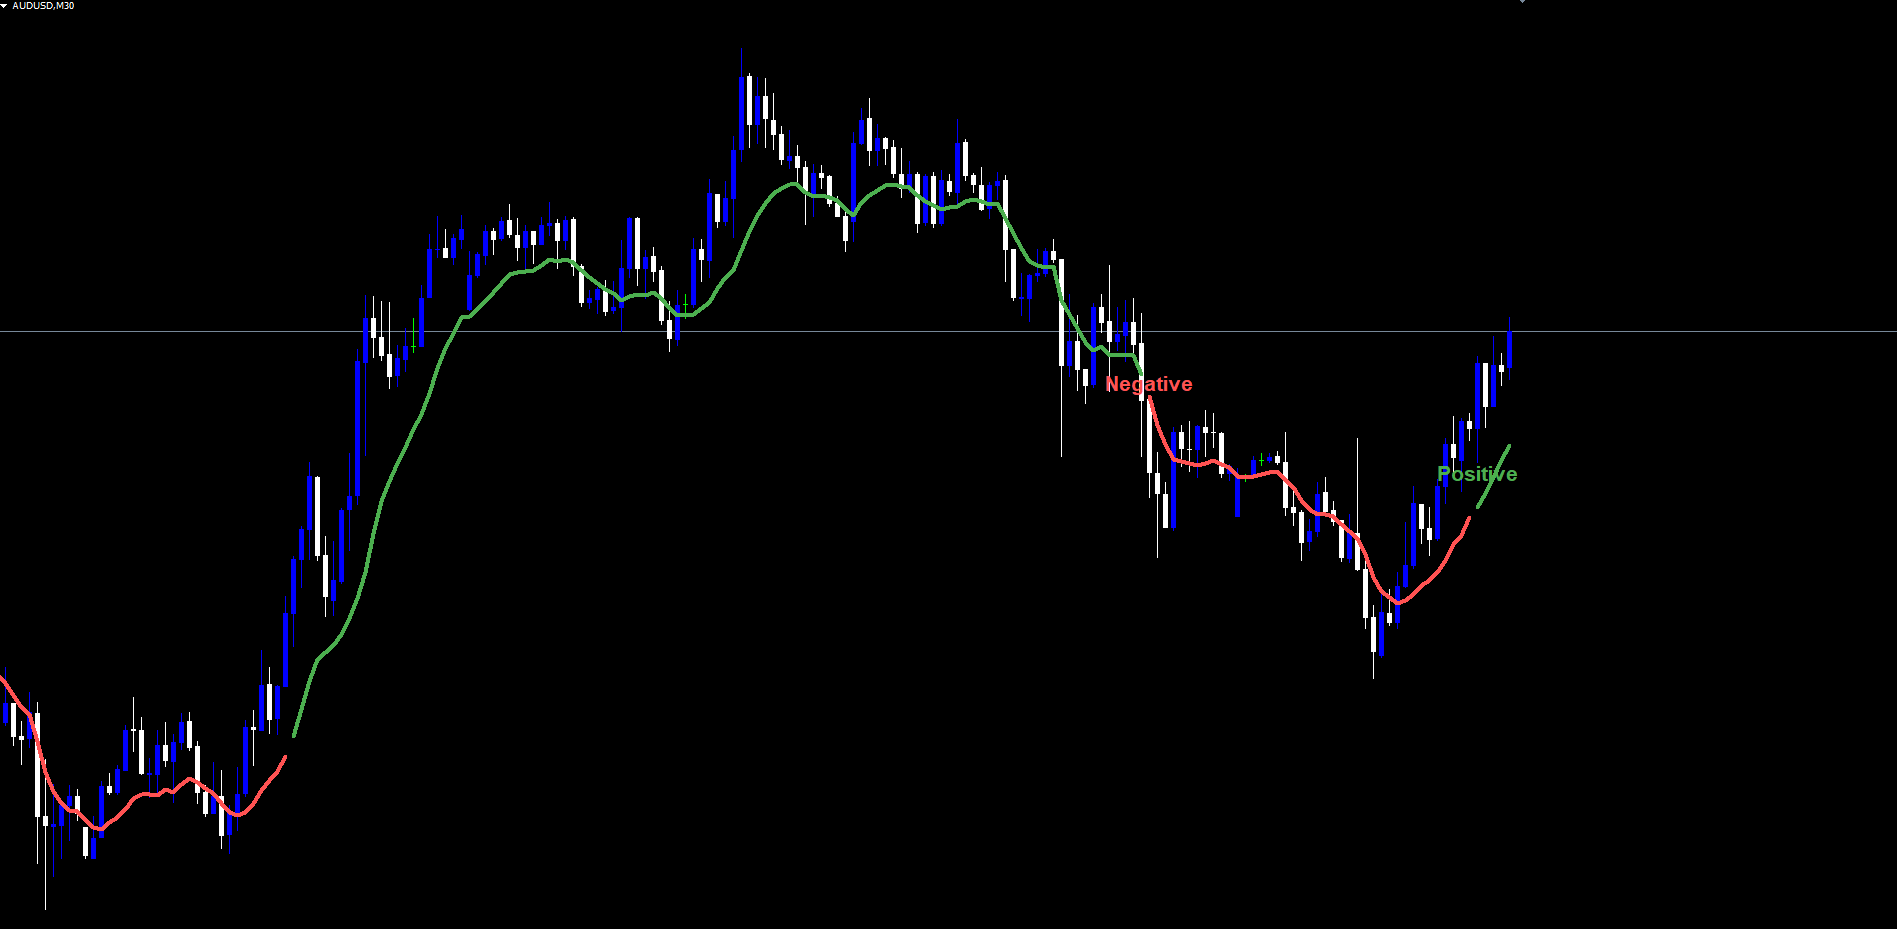
The RSI Turn Finder Indicator is a non-repainting RSI momentum-turn detection system for MetaTrader 4 and MetaTrader 5. It watches for the precise moment a 14-period RSI crosses up through a configurable Positive threshold (default 65) confirmed by a rising 5-period close-EMA, latches the resulting trend bias, and renders the active state as a bicolor EMA(low, 10) trend line on the chart. A "Positive" or "Negative" label is printed at every state transition and a four-channel alert is fired in real time.
Key Features:
- RSI Cross-Up + Momentum Confirmation: Positive turn = RSI crosses above 65 AND EMA(close,5) is rising. Negative turn = RSI below 32 AND EMA(close,5) is falling.
- Latched State Machine: Trend bias persists from one transition to the next. The line color stays the same color for as many bars as needed.
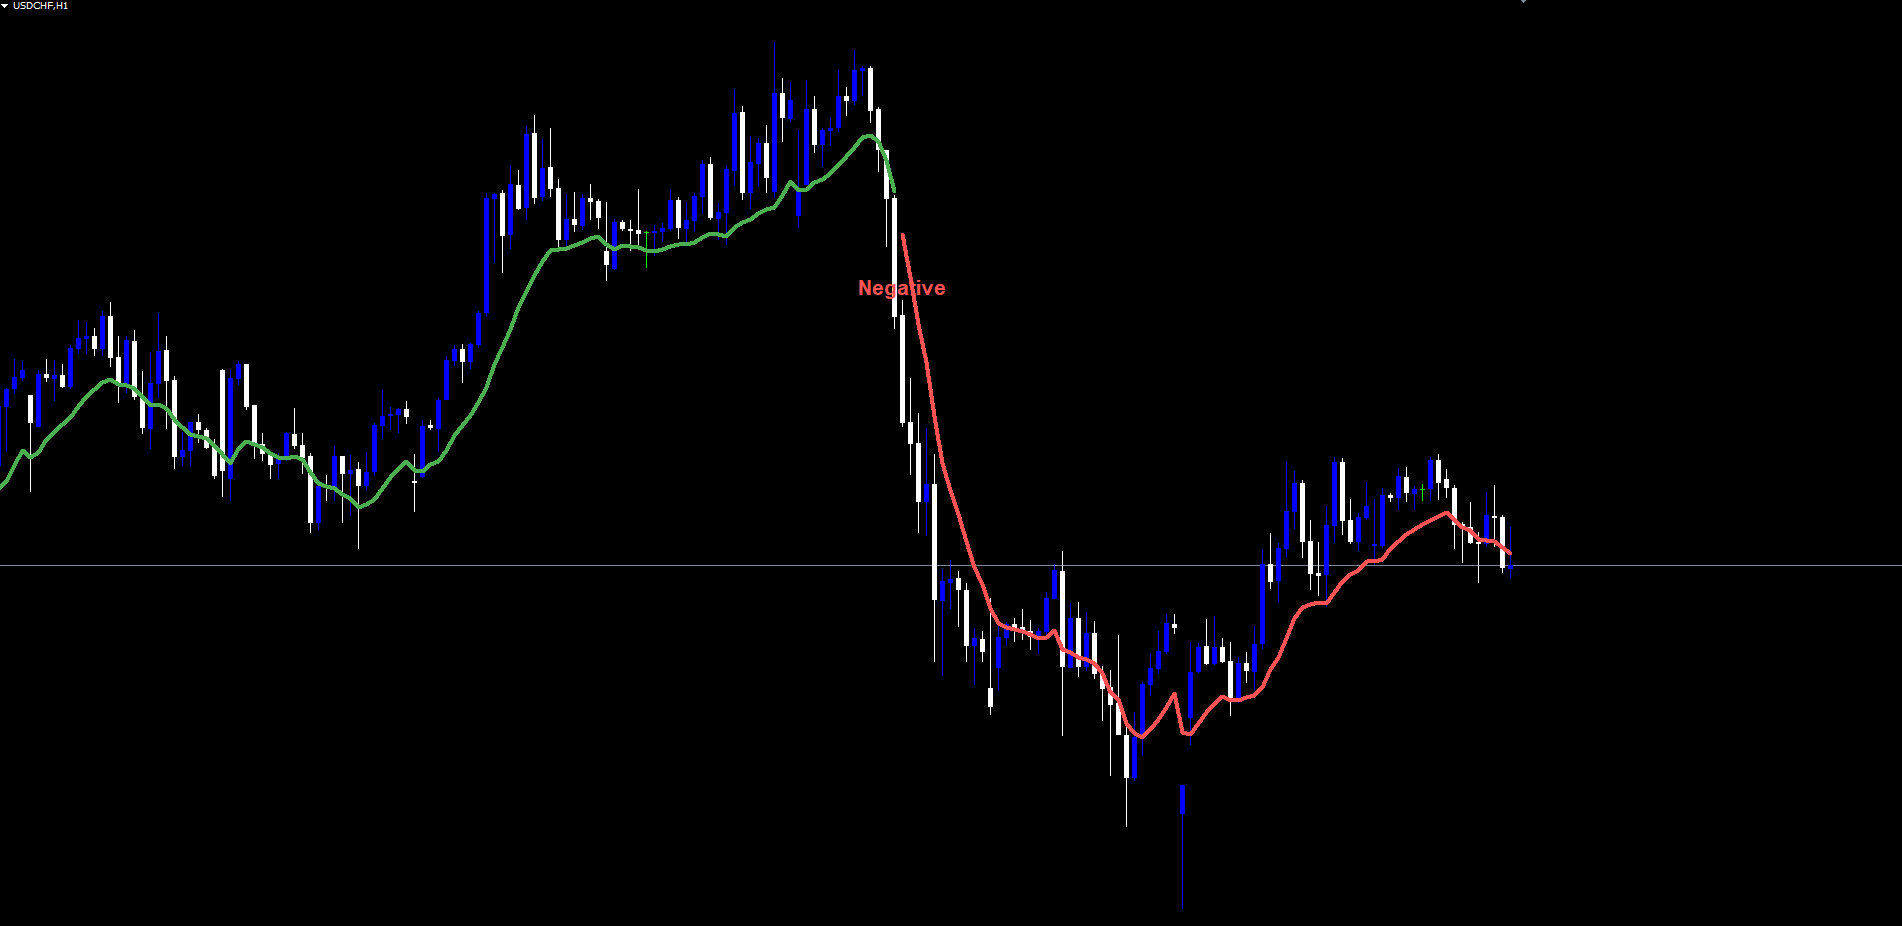
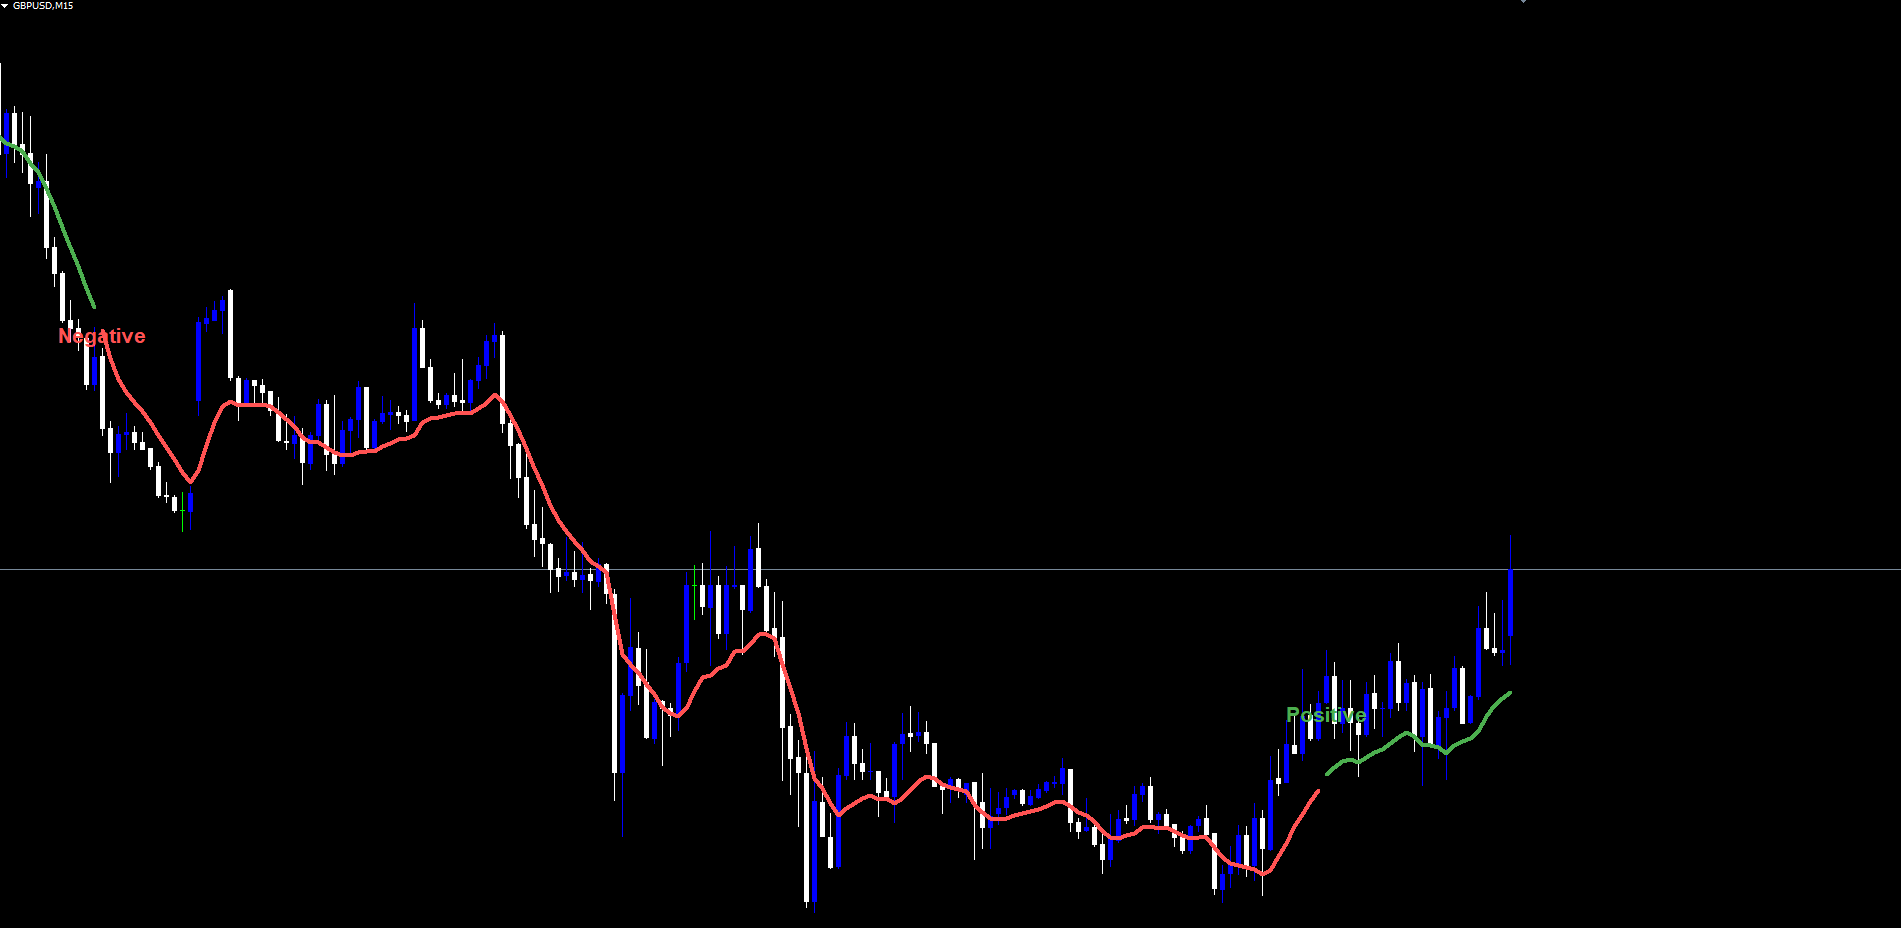
- Bicolor EMA(low, 10) Trend Line: Single 3-pixel line, green when state is Positive, red when state is Negative or neutral.
- Non-Repainting: State only changes on closed bars. Labels, once drawn, are permanent.
- Four-Channel Alerts: Popup, Sound, Push notification, Email -- all individually toggleable.
- MT4 / MT5 Visual & Logic Parity: Both builds render identical output on the same data.
Download the indicator:
- MetaTrader 5: RSI Turn Finder MT5
- MetaTrader 4: RSI Turn Finder MT4
TIP: This indicator is designed for traders who want a clean, rule-based momentum-turn detector. It works on any symbol and any timeframe in MetaTrader.
How RSI Turn Finder Indicator Works
The indicator combines three classic technical concepts -- the Relative Strength Index, an exponential moving average slope test, and a latched state machine -- into one clean signal flow.
Step-by-step signal generation:
- On every closed bar, the indicator computes the 14-period RSI on close prices.
- It also computes the 5-period EMA of close prices for momentum confirmation.
- It checks the Positive cross condition: RSI on the previous bar below the Positive Level AND RSI on the current bar above the Positive Level AND RSI above the Negative Level AND EMA(close, 5) is rising.
- If the Positive condition is true, the internal state flips to Positive (1). The trend line color switches to green from this bar forward and a green "Positive" label is anchored below the trigger bar's low.
- It checks the Negative condition: RSI on the current bar below the Negative Level AND EMA(close, 5) is falling.
- If the Negative condition is true, the state flips to Negative (-1). The line switches to red and a red "Negative" label is anchored above the trigger bar's high.
- If neither condition is true, the state remains unchanged.
- The line is extended to the most recently closed bar (or to the current live bar if InpShowLine = true ).
- If a state transition occurred on the most recent closed bar, the alert routine fires through every enabled channel.
NOTE: Both conditions are evaluated only on closed bars (shift >= 1). The forming bar (shift 0) inherits the state of the most recently closed bar -- it never independently triggers a transition. This is the architectural reason the indicator does not repaint.
Installation
The indicator is distributed exclusively through the MQL5.com Market and installs automatically. No manual file copying is required.
Steps:
- Purchase RSI Turn Finder Indicator from the MQL5 Market product page.
- The indicator installs automatically into your MetaTrader terminal.
- Open MetaTrader 4 or MetaTrader 5.
- Press Ctrl+N to open the Navigator panel.
- Expand Indicators > Market.
- Locate RSI Turn Finder Indicator in the list.
- Drag it onto any chart, or double-click its name.
- The settings dialog appears -- adjust the eleven inputs as needed (see Parameter Reference below).
- Click OK to apply.
After loading you will see:
- The bicolor trend line drawn from the earliest valid bar to the current bar (or the most recent closed bar).
- One or more "Positive" (green) and "Negative" (red) text labels marking historical state transitions.
- The line color reflecting the latched state at every point in history.
IMPORTANT: Do not copy .ex4 / .ex5 files manually to the data folder. The MQL5 Market handles all file placement and updates automatically. References online to File > Open Data Folder are for free indicators only -- this is a Market product and installs differently.
Signal System Overview
There are two visible signal events: Positive and Negative transitions. Each transition consists of three components.
1. The State Flag (internal). The internal g_state value flips from one of {-1, 0, +1} to another. State 0 is the neutral starting state before any transition has fired. State +1 is Positive (bullish bias). State -1 is Negative (bearish bias).
2. The Trend Line Color. The 3-pixel bicolor line tracks the EMA(low, 10) value at every bar. Its color reflects the current latched state:
- State +1 (Positive): line is green
- State -1 (Negative): line is red
- State 0 (neutral, before any transition): line is red (treated as bear-default)
The line uses two internal buffers -- one for green, one for red -- with a one-bar overlap at every color change to prevent visible gaps.
3. The Text Label. A "Positive" or "Negative" label is anchored to the trigger bar at the moment of state change.
- "Positive" label: green text, anchored below the bar's low (the bar where the Positive condition fired).
- "Negative" label: red text, anchored above the bar's high.
- Both use Arial Bold size 16.
The label text is fixed -- it does not include price or other dynamic content. The label position itself communicates the trigger location.
Non-Repainting Confirmation:
- State evaluation runs only on bars with shift >= 1 (i.e., closed bars).
- Once a label object is created on the chart, it is never deleted by the indicator unless the indicator is removed from the chart.
- Once a state value is written to a historical bar's g_state slot, it is never overwritten.
What you see on the chart in historical data is exactly what would have appeared in real time when those bars closed.
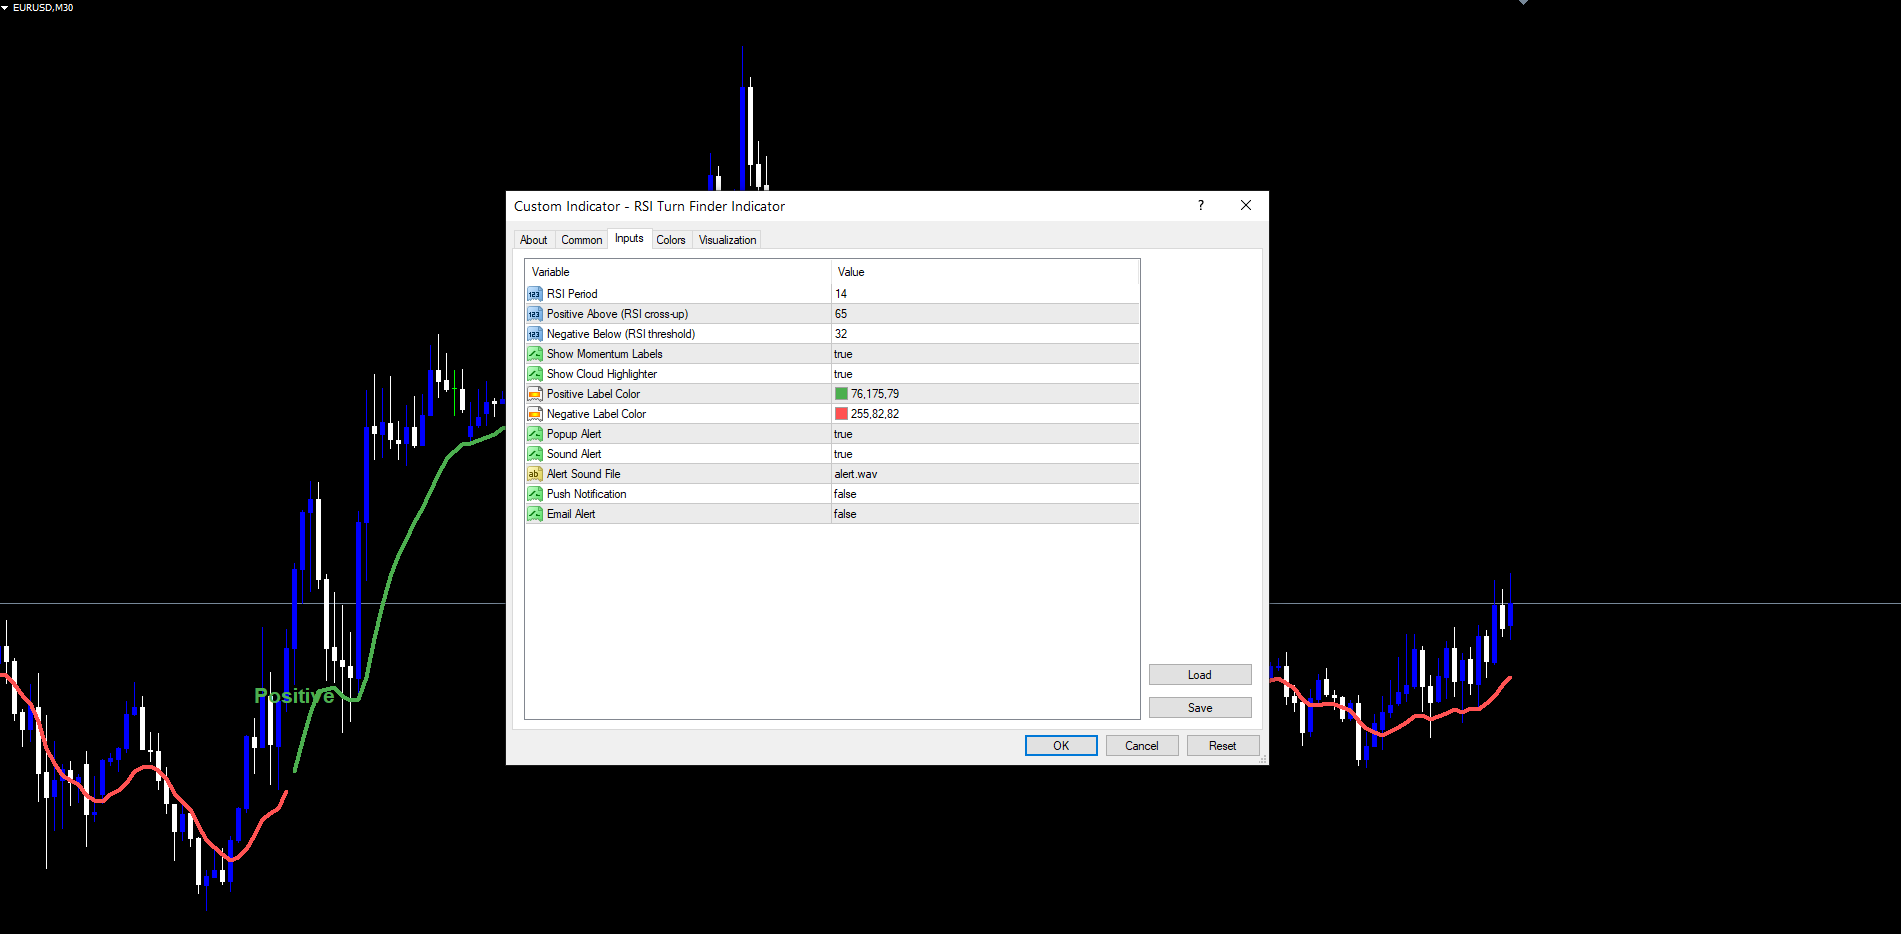
Parameter Reference
The indicator has exactly eleven input parameters. Defaults match the source code.
RSI Settings
| Parameter | Default | Description |
|---|---|---|
| InpRSIPeriod | 14 | Period of the underlying Wilder's RSI. Standard configuration is 14. Values in the range 7-25 are reasonable depending on timeframe. The input validator accepts 2 to 1000. |
| InpPositiveLevel | 65 | The RSI level the calculation must cross UP through to trigger a Positive transition. Standard 70 can be used for stricter signals; 60 for earlier entries. Validator accepts 1-99. |
| InpNegativeLevel | 32 | The RSI level the calculation must be BELOW (with falling EMA) to trigger a Negative transition. Standard 30 can be used; 35 captures bearish turns earlier. Validator accepts 1-99 and requires Positive Level > Negative Level. |
Visuals
| Parameter | Default | Description |
|---|---|---|
| InpShowLabels | true | Draw the "Positive" / "Negative" text labels at state transitions. Set to false for line-only mode. |
| InpShowLine | true | Render the bicolor EMA(low, 10) trend line. Set to false for labels-only mode. |
| InpPosLabelColor | C'76,175,79' (green) | Text color for "Positive" labels. |
| InpNegLabelColor | C'255,82,82' (red) | Text color for "Negative" labels. |
NOTE: The trend line colors themselves (green and red) are fixed at compile time -- they cannot be changed via inputs. This guarantees pixel-perfect MT4 / MT5 visual parity. Only the label colors are user-configurable.
Alerts
| Parameter | Default | Description |
|---|---|---|
| InpAlertPopup | true | Trigger MetaTrader's standard on-screen popup alert dialog. |
| InpAlertSound | true | Play the sound file specified in InpAlertSoundFile . |
| InpAlertSoundFile | alert.wav | Name of the sound file. Must exist in MetaTrader's Sounds folder. Custom .wav files can be placed there. |
| InpAlertPush | false | Send a push notification to the MetaTrader mobile app. Requires MetaQuotes ID configuration. |
| InpAlertEmail | false | Send an email alert via configured SMTP. Requires SMTP credentials in MetaTrader options. |
Complete Input List
| # | Parameter | Type | Default | Category |
|---|---|---|---|---|
| 1 | InpRSIPeriod | int | 14 | RSI Settings |
| 2 | InpPositiveLevel | int | 65 | RSI Settings |
| 3 | InpNegativeLevel | int | 32 | RSI Settings |
| 4 | InpShowLabels | bool | true | Visuals |
| 5 | InpShowLine | bool | true | Visuals |
| 6 | InpPosLabelColor | color | C'76,175,79' | Visuals |
| 7 | InpNegLabelColor | color | C'255,82,82' | Visuals |
| 8 | InpAlertPopup | bool | true | Alerts |
| 9 | InpAlertSound | bool | true | Alerts |
| 10 | InpAlertSoundFile | string | alert.wav | Alerts |
| 11 | InpAlertPush | bool | false | Alerts |
| 12 | InpAlertEmail | bool | false | Alerts |
Reading the Chart
The chart's bicolor trend line and text labels tell you the indicator state at any point in history without needing to open a separate panel.
Reading the line:
- Line is green -> state is currently Positive. Bullish bias is active.
- Line is red -> state is currently Negative (or neutral if no transition has occurred yet). Bearish bias is active.
- Line color changes from red to green -> a Positive turn has fired. A "Positive" label appears at this bar.
- Line color changes from green to red -> a Negative turn has fired. A "Negative" label appears at this bar.
Reading the labels:
- A "Positive" label means the conditions for a Positive turn were all true on the bar where the label is anchored. Label is anchored at the bar's LOW with text below.
- A "Negative" label means the conditions for a Negative turn were all true on the bar where the label is anchored. Label is anchored at the bar's HIGH with text above.
- Each label is independent -- it has no expiry and is never removed once drawn.
Live bar behavior:
- The line extends to the live bar position because EMA(low, 10) on the live bar updates with each tick.
- The state of the live bar mirrors the state of the most recent closed bar -- it does NOT independently change as the bar forms.
- A new label cannot appear on the live bar; it only appears once the live bar closes and the next OnCalculate cycle confirms the state transition.
Alert Configuration
The indicator supports four alert delivery channels. Each is toggleable independently.
Channel Setup
| Channel | Setting | What It Does |
|---|---|---|
| Popup Alert | InpAlertPopup = true | Triggers MetaTrader's standard Alert() modal dialog. Displays an on-screen window with the alert message. The message is also added to the Alerts tab in the Terminal. |
| Sound Alert | InpAlertSound = true | Plays the sound file specified in InpAlertSoundFile via PlaySound() . The file must exist in the Sounds folder of your MetaTrader installation. |
| Push Notification | InpAlertPush = true | Sends the alert to the MetaTrader mobile app via SendNotification() . Requires the trader's MetaQuotes ID to be configured. |
| Email Alert | InpAlertEmail = true | Sends the alert via SMTP using SendMail() . Requires SMTP server settings in Tools > Options > Email. |
Alert Events
The indicator fires alerts on every state transition that occurs on the most recently closed bar. There are two event types:
| Event | Example Message |
|---|---|
| Positive Trend | RSI Turn Finder: Positive Trend on EURUSD M15 |
| Negative Trend | RSI Turn Finder: Negative Trend on EURUSD M15 |
The message format is consistent: RSI Turn Finder: <direction> Trend on <symbol> <timeframe> . All enabled channels receive the same message text.
Alert Deduplication
- Alerts only fire when a state transition occurs on the most recently closed bar (shift = 1) AND the bar's timestamp is strictly greater than the last alert's bar timestamp.
- This prevents duplicate alerts during the historical scan that runs when the indicator first loads on a chart.
- It also prevents the same closed-bar transition from firing alerts repeatedly on subsequent ticks.
- Every alert is also logged via Print() to the Experts tab regardless of which channels are enabled.
Enabling Push Notifications
- Install the MetaTrader mobile app on your phone (iOS or Android).
- Open the app and navigate to Settings > Messages.
- Copy your MetaQuotes ID (an 8-digit number).
- In the desktop MetaTrader, go to Tools > Options > Notifications.
- Tick Enable Push Notifications, paste your MetaQuotes ID, and click Test to verify.
- Set InpAlertPush = true in the indicator settings.
Enabling Email Alerts
- In MetaTrader, go to Tools > Options > Email.
- Check Enable.
- Enter your SMTP server, port, login, password, sender email, and destination email.
- Click Test to verify the configuration sends a test message successfully.
- Set InpAlertEmail = true in the indicator settings.
Trading Strategies
The indicator is a momentum-trend detector, not a complete trading system. The following three strategies show common ways traders integrate it into their workflow.
WARNING: Trading involves significant risk of loss. The strategies below are educational examples only. Always test on a demo account before risking real capital.
Strategy A: Fresh Turn Entry
Goal: Enter at the precise moment of a confirmed momentum turn.
Setup:
- Use the indicator with default settings.
- Wait for a fresh "Positive" or "Negative" label to appear at the close of a bar.
- Enter at the OPEN of the next bar (do not enter on the trigger bar itself -- you cannot know the state has flipped until that bar closes).
- Place stop loss beyond the most recent swing low (for longs after a Positive label) or swing high (for shorts after a Negative label).
- Take profit at a multiple of the stop loss distance, or trail behind the bicolor line.
Why it works:
- The trigger bar is the bar where both RSI and EMA slope agreed -- this is the strongest moment of the new bias.
- Entering on the next bar's open avoids the no-knowledge zone of trading inside the trigger bar.
- The line provides a natural trailing reference once the trade is in profit.
Strategy B: Pullback to the Line
Goal: Enter on retracements within an active trend, using the line as dynamic support / resistance.
Setup:
- Wait for the line to be in your desired color (green for longs, red for shorts) for at least 5-10 bars after the most recent label.
- Wait for price to pull back toward the line.
- Enter when price touches or slightly penetrates the line and shows a rejection candle in the trend direction.
- Stop loss beyond the most recent swing.
- Hold while line color is unchanged; exit when an opposite-color label appears.
Why it works:
- The line is a 10-period EMA on lows, which often acts as dynamic support during uptrends and dynamic resistance during downtrends.
- Pullback entries reduce drawdown compared to fresh-turn entries.
- The opposite-color label provides a clean exit trigger.
Strategy C: Multi-Timeframe Confirmation (Set and Forget)
Goal: Trade only when both H1 and H4 timeframes agree on direction. Monitor multiple instruments via push notifications.
Setup:
- Open H1 and H4 charts of each instrument you want to monitor (e.g., 5-10 majors).
- Apply RSI Turn Finder Indicator to every chart.
- On all H1 charts, enable InpAlertPush = true and disable InpAlertPopup to avoid distraction.
- When a push notification arrives for a Positive turn on the H1, open the H4 chart of the same instrument.
- If the H4 line is also green, take the long. If it is still red, skip the signal.
- Mirror logic for Negative turns.
Why it works:
- Higher timeframe agreement filters out countertrend H1 turns that have low success rates.
- Push notifications free you from sitting at the screen.
- The dual-timeframe rule typically reduces signal frequency by 60-70% but greatly improves average outcome.
TIP: For Strategy C, consider raising the Positive level by 5 points and lowering the Negative level by 5 points to reduce notification noise during ranging periods.
Parameter Tuning Presets
The defaults are designed for major Forex pairs on M15 to H4. The following presets provide alternative starting points for other use cases.
Default Preset (M15 - H4 majors)
| Parameter | Value |
|---|---|
| InpRSIPeriod | 14 |
| InpPositiveLevel | 65 |
| InpNegativeLevel | 32 |
| InpShowLabels | true |
| InpShowLine | true |
Sensitive Preset (fast / volatile markets)
| Parameter | Value |
|---|---|
| InpRSIPeriod | 14 |
| InpPositiveLevel | 60 |
| InpNegativeLevel | 35 |
| InpShowLabels | true |
| InpShowLine | true |
Captures momentum turns earlier. More frequent transitions, more whipsaws during chop. Best for trending fast markets like crypto or major news periods.
Strict Preset (ranging instruments)
| Parameter | Value |
|---|---|
| InpRSIPeriod | 14 |
| InpPositiveLevel | 70 |
| InpNegativeLevel | 28 |
| InpShowLabels | true |
| InpShowLine | true |
Requires stronger RSI extension before flipping state. Fewer signals but higher conviction per signal.
Higher Timeframe Preset (D1 / W1)
| Parameter | Value |
|---|---|
| InpRSIPeriod | 14 |
| InpPositiveLevel | 60 |
| InpNegativeLevel | 35 |
| InpShowLabels | true |
| InpShowLine | true |
Compensates for the lower frequency of RSI cross events on slow-moving daily and weekly bars. Each transition typically marks a multi-week trend change.
Scalping Preset (M5)
| Parameter | Value |
|---|---|
| InpRSIPeriod | 9 |
| InpPositiveLevel | 65 |
| InpNegativeLevel | 32 |
| InpShowLabels | true |
| InpShowLine | true |
Shorter RSI period gives a faster reading suitable for very short holding periods. Use with tight risk controls.
TIP: Start with the Default preset and only adjust one parameter at a time to observe its effect on signal frequency and quality.
Frequently Asked Questions
Does the indicator repaint?
No. State transitions are evaluated only on closed bars (shift >= 1). The forming bar inherits the state of the most recently closed bar but never independently triggers a transition. Once a "Positive" or "Negative" label is drawn on the chart, it is permanent. Once a state value is written for a historical bar, it is never overwritten on subsequent ticks.
Why is the trend line green from the start of my chart even though I have not seen any signals yet?
The state machine has three values: -1 (Negative), 0 (neutral), and +1 (Positive). On a fresh chart load before any transitions have fired, every historical bar's state is 0. The line drawing routine treats state 0 as "bear default" -- the line is rendered as red until the first Positive transition fires. If you see green from the chart start, it means the first historical Positive transition has already occurred earlier in the chart's history.
Why are some labels close together while others are far apart?
The indicator only flips state when both RSI and EMA slope conditions agree. During strong trends both conditions remain on the same side for many bars, so the state stays the same and no new labels appear. During choppy conditions the labels can appear closer together. The spacing reflects underlying market structure.
Does the indicator work on crypto, indices, commodities?
Yes. The logic is symbol-agnostic. The defaults work well on most instruments. For high-volatility instruments use the Sensitive Preset; for low-volatility instruments use the Strict Preset.
Can I backtest a strategy in the Strategy Tester?
Yes. The indicator is non-repainting, so its historical signals are an accurate record of what would have appeared in real time. Build an Expert Advisor that calls iCustom() to read the state buffers and act on transitions. Chart objects use the FXOB_RTF_ prefix.
What happens when I switch timeframes?
The indicator reinitializes. Internal state arrays are rebuilt and all FXOB_RTF_ chart objects are recreated for the new timeframe. Each chart is independent; there is no state persistence across timeframes.
Troubleshooting
No signals appearing on my chart
Possible causes:
- The chart history is too short. The indicator needs at least InpRSIPeriod + 10 bars (default 24 bars) before any signals can fire. Scroll back in history or wait for more bars.
- The market is ranging tightly. If RSI never crosses above the Positive Level or stays above the Negative Level, no transitions are possible. Check the RSI values manually on a separate RSI indicator.
- The Positive Level is too high. Try lowering it from 65 to 60.
- The Negative Level is too low. Try raising it from 32 to 35.
The trend line is not visible
- Verify InpShowLine = true .
- The line uses fixed compile-time colors -- if your chart background matches one of the colors (very dark red or very dark green), the line may be hard to see. Change the chart background color.
- Verify that #property indicator_buffers 2 has not been edited or recompiled with fewer buffers.
Labels are not visible
- Verify InpShowLabels = true .
- The labels use the InpPosLabelColor and InpNegLabelColor inputs. If you have changed these to colors close to your chart background, the labels will be hard to see. Reset to the defaults (green / red).
- The label font is "Arial Bold" size 16. If your MetaTrader has a custom theme that overrides font rendering, the labels may render at a different size.
Alerts are not firing
- Verify the master toggle for the channel you want is enabled (e.g., InpAlertPopup = true ).
- For push notifications: verify the MetaQuotes ID is correctly configured in Tools > Options > Notifications and that InpAlertPush = true . Use the "Test" button on the Notifications tab to confirm push delivery works independently of the indicator.
- For email: verify SMTP settings in Tools > Options > Email and click "Test" to confirm. Set InpAlertEmail = true .
- Alerts only fire on the most recent closed-bar transition. If you reload the indicator, alerts do NOT re-fire for historical transitions.
Different signals between MT4 and MT5
The underlying logic is identical between the two builds. Minor differences in the very first signals on a fresh chart can occur because:
- MT4 and MT5 may have slightly different historical bar counts loaded by default.
- The EMA seed values during the warmup period (first 14 bars) differ slightly between the two platforms.
These differences are confined to the earliest bars on the chart and disappear once both platforms have processed enough history. Within the visible trading range of any reasonable chart, the indicators produce identical signals.
MT4 / MT5 Differences
The two builds are deliberately built to produce identical visual and logical output. There are however internal differences forced by the platform APIs.
| Concern | MT4 build | MT5 build |
|---|---|---|
| #property strict | Required and present | Not used (MT5 is always strict) |
| Indicator short name | IndicatorShortName(...) | IndicatorSetString(INDICATOR_SHORTNAME, ...) |
| Chart digits | IndicatorDigits(Digits) | IndicatorSetInteger(INDICATOR_DIGITS, _Digits) |
| Buffer binding | SetIndexBuffer(0, PosBuf) + SetIndexStyle(0, DRAW_LINE) | SetIndexBuffer(0, PosBuf, INDICATOR_DATA) + #property indicator_typeN DRAW_LINE |
| iRSI / iMA | Per-shift iRSI(NULL, 0, ...) calls | iRSI(_Symbol, _Period, ...) to create a handle in OnInit + CopyBuffer in OnCalculate |
| Bar arrays | Predefined Time[] , High[] , Low[] series globals | time / high / low parameters from OnCalculate + ArraySetAsSeries(...) to series-index them |
| Object API | ObjectCreate(name, ...) and ObjectSetText(...) etc. | ObjectCreate(0, name, ...) and ObjectSetString(0, name, ...) etc. |
| Symbol / Period | Symbol() , Period() functions | _Symbol , _Period predefined |
| Handle cleanup | Not applicable | IndicatorRelease(handle) in OnDeinit |
Identical between builds: All eleven inputs, default values, RSI cross logic, EMA slope logic, state machine, label rendering (Arial Bold, size 16, anchored above-bar / below-bar), line colors, alert message format, alert deduplication logic, and the FXOB_RTF_ object name prefix.
Compatibility and Performance
- Platforms: MetaTrader 4 (build 1380+) and MetaTrader 5 (build 3550+).
- Symbols: All -- Forex, indices, commodities, crypto, stocks. Symbol-agnostic logic.
- Timeframes: All -- M1 through MN1. Each chart maintains independent state.
- Brokers: All -- no broker-specific dependencies, no custom symbol handling.
- CPU usage: Negligible. The first calculation after loading processes the entire history in one pass (typically a fraction of a second). Subsequent ticks process only newly closed bars.
- Memory: ~16 bytes per chart bar for the state array, plus 16 bytes per labeled transition for the chart object. A typical chart with 5000 bars and 50 transitions uses well under 100 KB.
Download the indicator:
- MetaTrader 5: RSI Turn Finder MT5
- MetaTrader 4: RSI Turn Finder MT4
CONTACT & SUPPORT
- Email: info@forexobroker.com
- Questions: Use the Comments section on the product page or send a private message
- Bug Reports: Please include your broker name, account type, and a screenshot
-
✅ All MQL Tools: https://www.mql5.com/en/users/forexobroker/ ✅
--------------------------------------------------------------------------------------------------------------
🏦 **Broker I use**: https://icmarkets.com/?camp=55869
🏦 **Broker For EU Traders I use 1**: https://www.ictrading.com?camp=91414
🏦 **Broker I use 2**: https://one.exnessonelink.com/boarding/sign-up/a/c_thuv62ocfq
💻 **VPS**: https://chocoping.com/processing/aff.php?aff=738
💼 **Companies I use for getting funded**:
Fundednext: https://fundednext.com/?fpr=kestutis39
The5ers: https://www.the5ers.com/?afmc=16kl
FTMO: https://trader.ftmo.com/?affiliates=nRAyOhmFRnEnFdOpdLeh
Risk Disclaimer
Trading foreign exchange and CFDs on margin carries a high level of risk and may not be suitable for all investors. You may sustain a loss exceeding your initial investment. Trend Quorum is a technical analysis tool and does not guarantee profitable trades. Past performance is not indicative of future results. The authors accept no liability for any loss arising from use of the indicator. By using Trend Quorum you acknowledge sole responsibility for your trading decisions.


")
![[XAUUSD]: Weekly Liquidity Activation Points (timings), June 22-26, 2026](https://c.mql5.com/6/1013/splash-preview-771790.png "[XAUUSD]: Weekly Liquidity Activation Points (timings), June 22-26, 2026")
")