")

Introduction
The Pulse Echo Indicator is a non-repainting volatility-adaptive trend envelope for MetaTrader 4 and MetaTrader 5. It blends a fast and slow EMA into a single trend spine using realized volatility as the blend weight, builds an EWMA-variance band around that spine, runs a three-state regime machine, and fires Buy or Sell signals at every confirmed regime transition.
Key Features:
- Volatility-Adaptive Spine: Self-tuning blend of fast (default 7) and slow (default 34) EMA driven by short vs long-term volatility ratio
- EWMA-Variance Envelope: Dynamic upper/lower bands sized by current realized volatility and a configurable multiplier
- Three-State Regime Machine: Bull / Bear / Neutral states with confirmation bars and spine-cross exit logic
- Trend Candle Painting: Each candle body recolored in the active regime color (default lime / red)
- Energy Fills + Rim Band: Filled regions between price and the trend spine, plus a thin rim hugging close
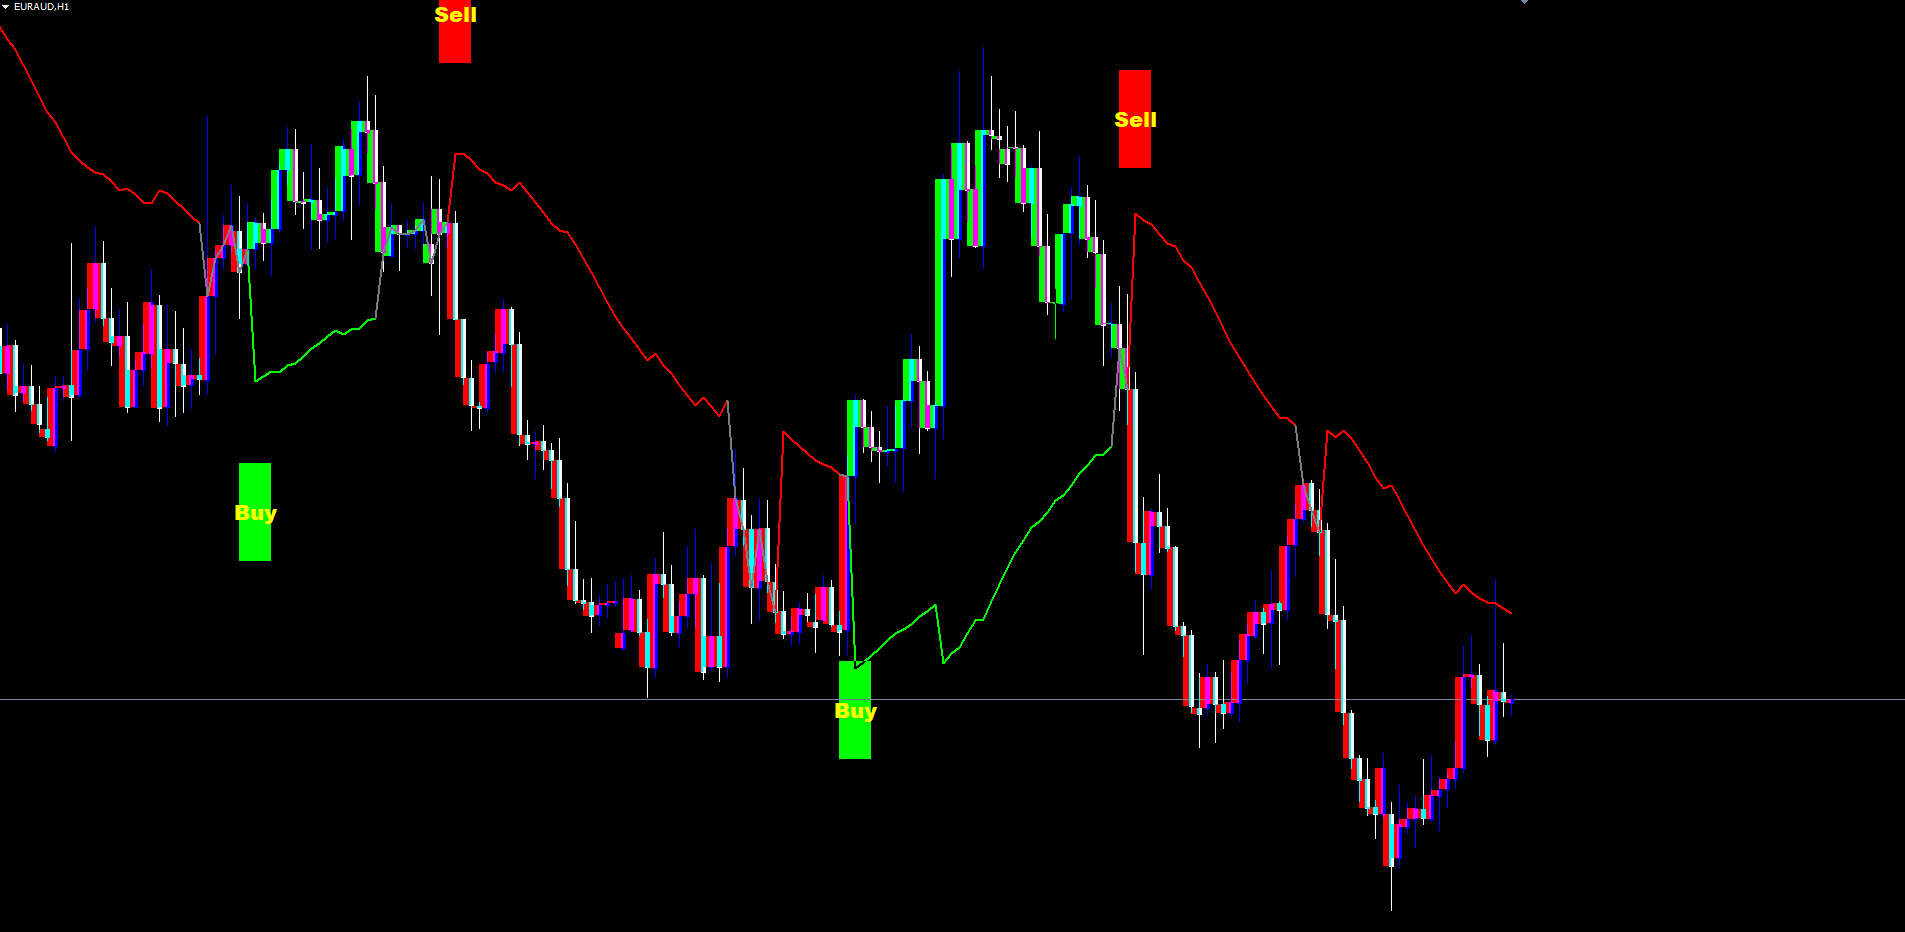
- Yellow Buy/Sell Labels: High-contrast pill-style labels at every regime transition, far enough above/below price to never overlap candles
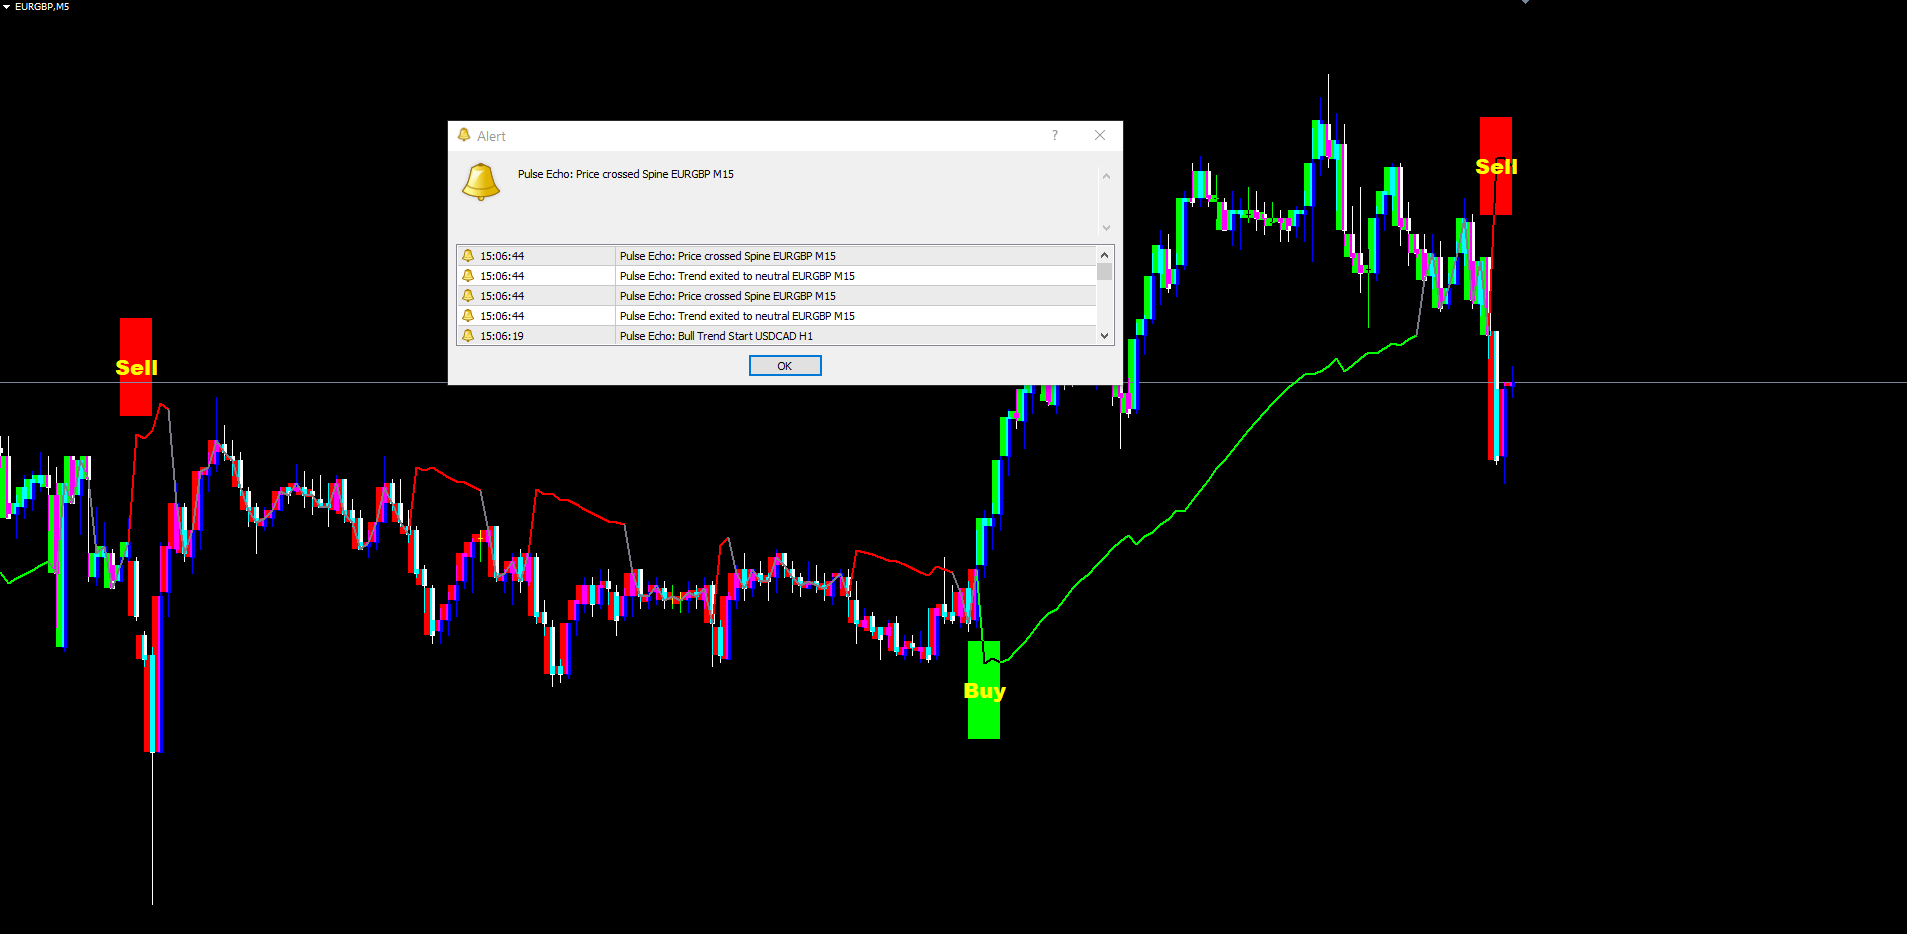
- 4 Alert Conditions: Bull Trend Start, Bear Trend Start, Trend Exit (to neutral), Spine Cross
- 4 Delivery Channels: Popup, Sound, Push notification, Email
- MT4 + MT5 Parity: Identical math and visual output across both platforms
Download the indicator:
- MetaTrader 5: Pulse Echo MT5
- MetaTrader 4: Pulse Echo MT4
TIP: The indicator works on any symbol and any timeframe. Defaults are tuned for H1 and H4 Forex pairs but adapt automatically to other markets through the volatility-driven blend.
Understanding Volatility-Adaptive Trend Detection
The trend spine in Pulse Echo is not a fixed-length moving average. It is a continuously rebalanced blend of a fast EMA and a slow EMA, with the blend weight driven by the ratio of short-term to long-term return volatility.
How signals are generated:
- The indicator computes log returns of the source price (default close) at every bar
- Two rolling standard deviations are calculated: a short-term volatility (20 bars) and a long-term volatility (80 bars)
- The volatility ratio vr = volS / volL is mapped to a blend weight using wRaw = clamp(1 - (vr - 0.7) / 0.9, 0, 1)
- The weight is smoothed by a 30-bar EMA, then used to blend the fast (7) and slow (34) EMAs into a raw spine
- The raw spine is itself smoothed by another 30-bar EMA to produce the visible trend line
- An EWMA variance of log returns produces a sigma value that, multiplied by the spine and the band multiplier (1.9), defines the upper and lower envelope levels
- When close crosses above the upper envelope, the regime transitions to bull (+1); below the lower envelope, to bear (-1)
- When the regime is bull and close drops below the spine, the regime returns to neutral (0). Same applies in reverse for bear.
- A Buy or Sell label is generated only when the regime transitions from a non-bull state to bull, or non-bear to bear
The non-repainting guarantee comes from gating signal detection to closed bars only. A label printed on a historical bar will never disappear, never move, and will reproduce identically across reloads.
NOTE: The spine, fills, and rim DO update on the live (still-forming) bar with each tick. This is correct behavior, not repainting -- the live bar's close is changing, so the indicator's visualizations attached to that bar must update too. Historical bars never change.
Installation Guide
Pulse Echo Indicator is distributed through the MQL5.com Market. Installation is automatic.
Steps:
- Purchase the indicator from the MQL5 Market product page
- The indicator installs automatically into your MetaTrader terminal
- Open MetaTrader and press Ctrl+N to open the Navigator panel
- Expand Indicators > Market
- Locate Pulse_Echo_Indicator in the list
- Drag the indicator onto any chart, or double-click its name
- The settings dialog appears -- adjust parameters as needed (see sections below)
- Click OK to apply
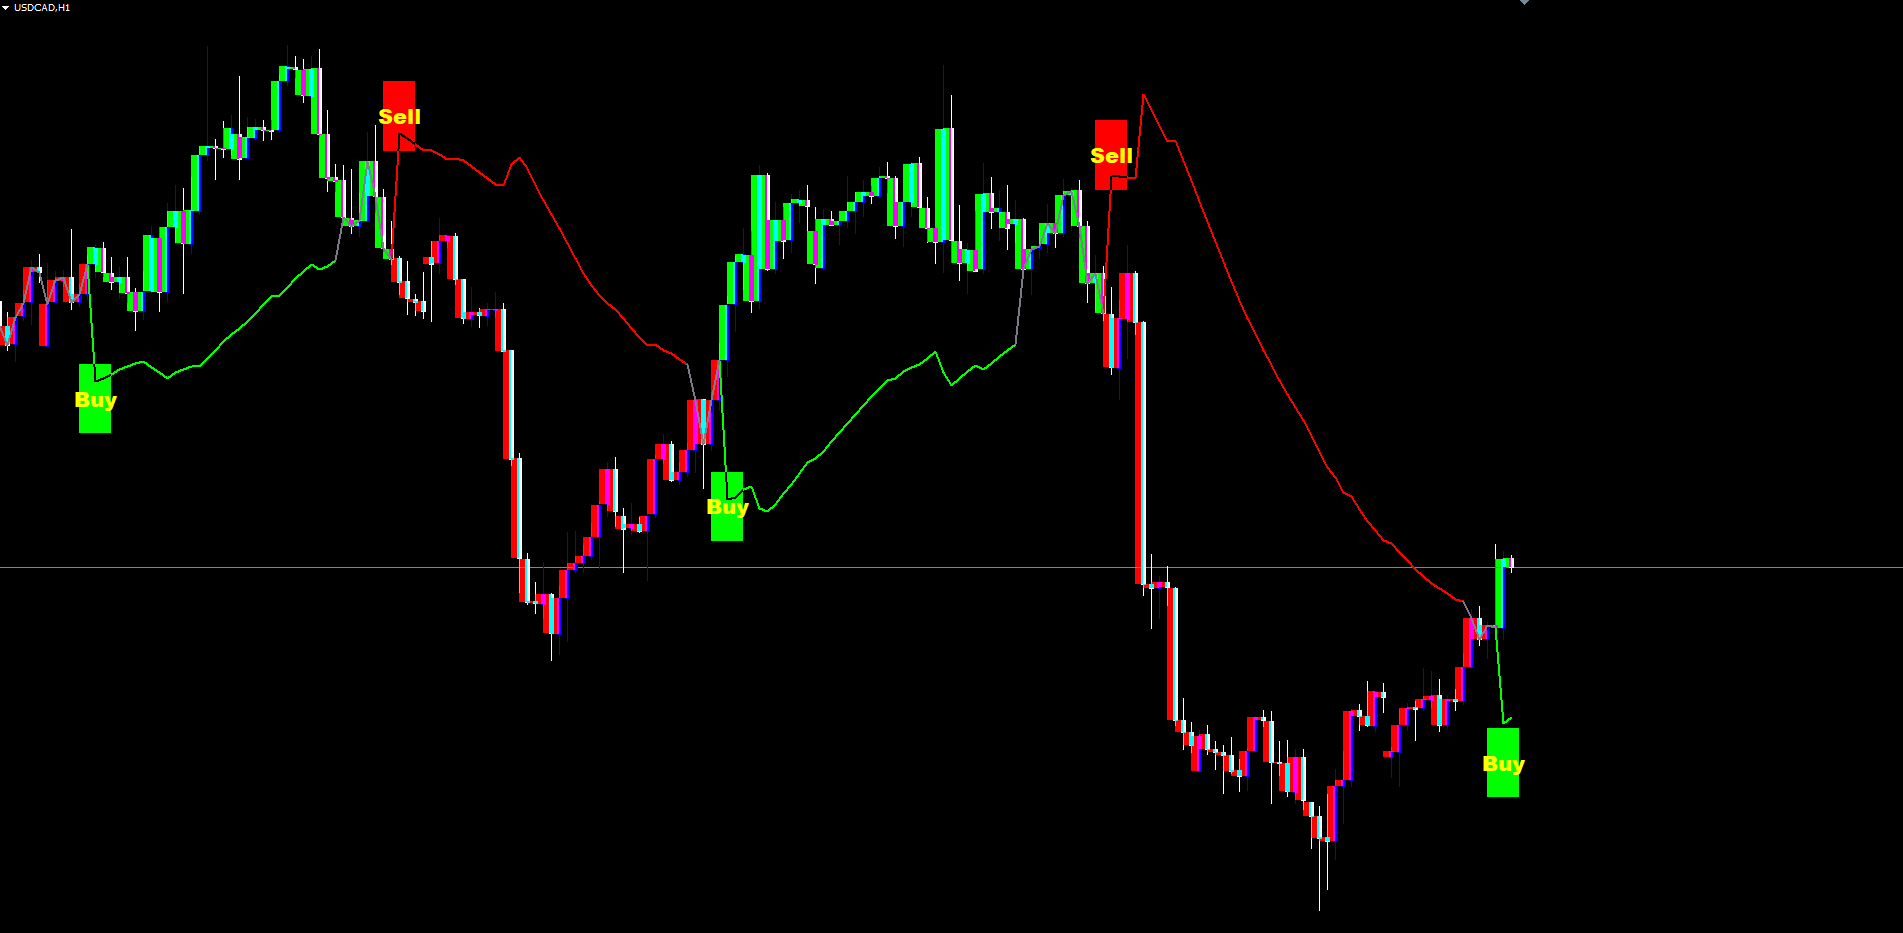
After loading, you will see:
- Trend Spine drawn on the chart in green (bull regime), red (bear regime), or gray (neutral)
- Trend Candles repainted in the active regime color (last 500 bars by default)
- Energy Fill between close and the trend line, colored by direction
- Rim Band hugging close, just below it in bull regime or just above it in bear regime
- Buy / Sell Labels at confirmed regime transitions, with yellow text on a colored pill 2.5 ATRs above or below the bar's high or low
IMPORTANT: Do not manually copy files to the data folder. The MQL5 Market handles all file placement and updates automatically.
Signal System Overview
Each signal consists of two visual components on the chart:
1. The Pill
A colored OBJ_RECTANGLE rendered in the bull or bear color. The pill is positioned 2.5 ATRs above the signal bar's high (Sell) or below the signal bar's low (Buy), so it never overlaps candle wicks. Width spans approximately 4 bars in time.
2. The Text
The word "Buy" or "Sell" rendered in yellow Arial Black 16pt, centered on the pill. Plain ASCII so it renders identically across all MetaTrader builds and operating systems.
Signals appear only at the bar where regime first becomes +1 (Buy) or -1 (Sell), gated by the lastSignal state machine. Once a Buy label is printed, no further Buy labels can appear until the regime has transitioned away from bull and a new bull regime is established.
Non-Repainting Confirmation:
- Signal detection runs only on confirmed bars (shift >= 1 in the indicator's internal loop)
- Once a label is created on the chart, the OBJ_RECTANGLE and OBJ_TEXT objects remain in place permanently
- The label persists across indicator reloads, refreshes, and chart timeframe switches (the underlying state machine is stored in indicator buffers and reproduces identically every time)
Visual Components Explained
The Trend Spine
The trend spine is a single line plotted on the chart, color-coded by the current regime:
| Regime | Spine Color | Meaning |
|---|---|---|
| Bull (+1) | InpLongCol (default lime) | Price is above the upper envelope; spine drawn at lower envelope |
| Bear (-1) | InpShortCol (default red) | Price is below the lower envelope; spine drawn at upper envelope |
| Neutral (0) | InpNeutralCol (default gray) | No directional bias; spine drawn at close |
The line bridges across regime transitions to avoid 1-bar gaps -- when the regime changes, the previous bar's value is also written into the new regime's color buffer so the line appears continuous.
Trend Candles
When InpPaintCandles is enabled, each candle body is recolored by the active lastSignal value (which mirrors the source TradingView indicator's barcolor() rule). The recoloring is applied to the most recent InpMaxPaintedBars bars (default 500). Older bars retain the broker's default candle color.
Energy Fills
The area between the close and the trend spine's anchor point is filled in the regime color:
- When close > baseLine (typically during a bull run), a green-colored fill connects close down to baseLine
- When close < baseLine (typically during a bear move), a red-colored fill connects close up to baseLine
- When close is exactly at baseLine (rare), no fill is rendered
The fill is dynamic -- on every tick, the live bar's fill extends to the current close.
Rim Band
A thin colored band sized at 6% of the 14-period ATR is drawn directly under the close (when bull) or over the close (when bear). The rim provides a constant low-noise visual marker of the current regime, even when energy fills are minimal because price is sitting right on the spine. The rim disappears in the neutral state.
Trend & Envelope Settings
These parameters control the volatility-adaptive spine and envelope.
Core Trend
| Parameter | Default | Description |
|---|---|---|
| InpSrc | PRICE_CLOSE | Applied price for all calculations (close, open, high, low, hl2, hlc3, weighted) |
| InpFastLen | 7 | Length of the fast EMA |
| InpSlowLen | 34 | Length of the slow EMA |
| InpBlendLen | 30 | Smoothing length for both the blend weight and the final spine EMA |
Logic: The fast EMA tracks recent price changes closely. The slow EMA filters noise. The blend weight, driven by realized volatility, determines how much of each contributes to the final spine on each bar.
Adaptive Envelope
| Parameter | Default | Description |
|---|---|---|
| InpRetLenS | 20 | Rolling window for short-term log-return volatility |
| InpRetLenL | 80 | Rolling window for long-term log-return volatility |
| InpBandMult | 1.9 | Half-width multiplier for the volatility envelope |
| InpEwmaAlpha | 0.09 | Decay constant for the EWMA variance recursion |
Logic: The ratio of short to long volatility ( volS / volL ) drives the blend weight. EWMA variance produces sigma; the envelope half-width is spine * sigma * BandMult .
TIP: For lower timeframes (M5, M15), reduce InpRetLenS to 10 and InpRetLenL to 40. For higher timeframes (D1, W1), keep defaults or increase to 30 / 120 for stronger volatility benchmarking.
Regime Logic
| Parameter | Default | Description |
|---|---|---|
| InpConfirmBars | 1 | Number of consecutive breakout bars required to commit a regime change |
| InpHysteresis | 0.35 | Hysteresis fraction (declared input mirroring source TradingView script) |
Logic: A value of 1 for InpConfirmBars means a single bar closing beyond the envelope is enough to flip the regime. Raising it to 2 or 3 produces more selective signals at the cost of slower entries. The hysteresis input is preserved for fidelity with the source script.
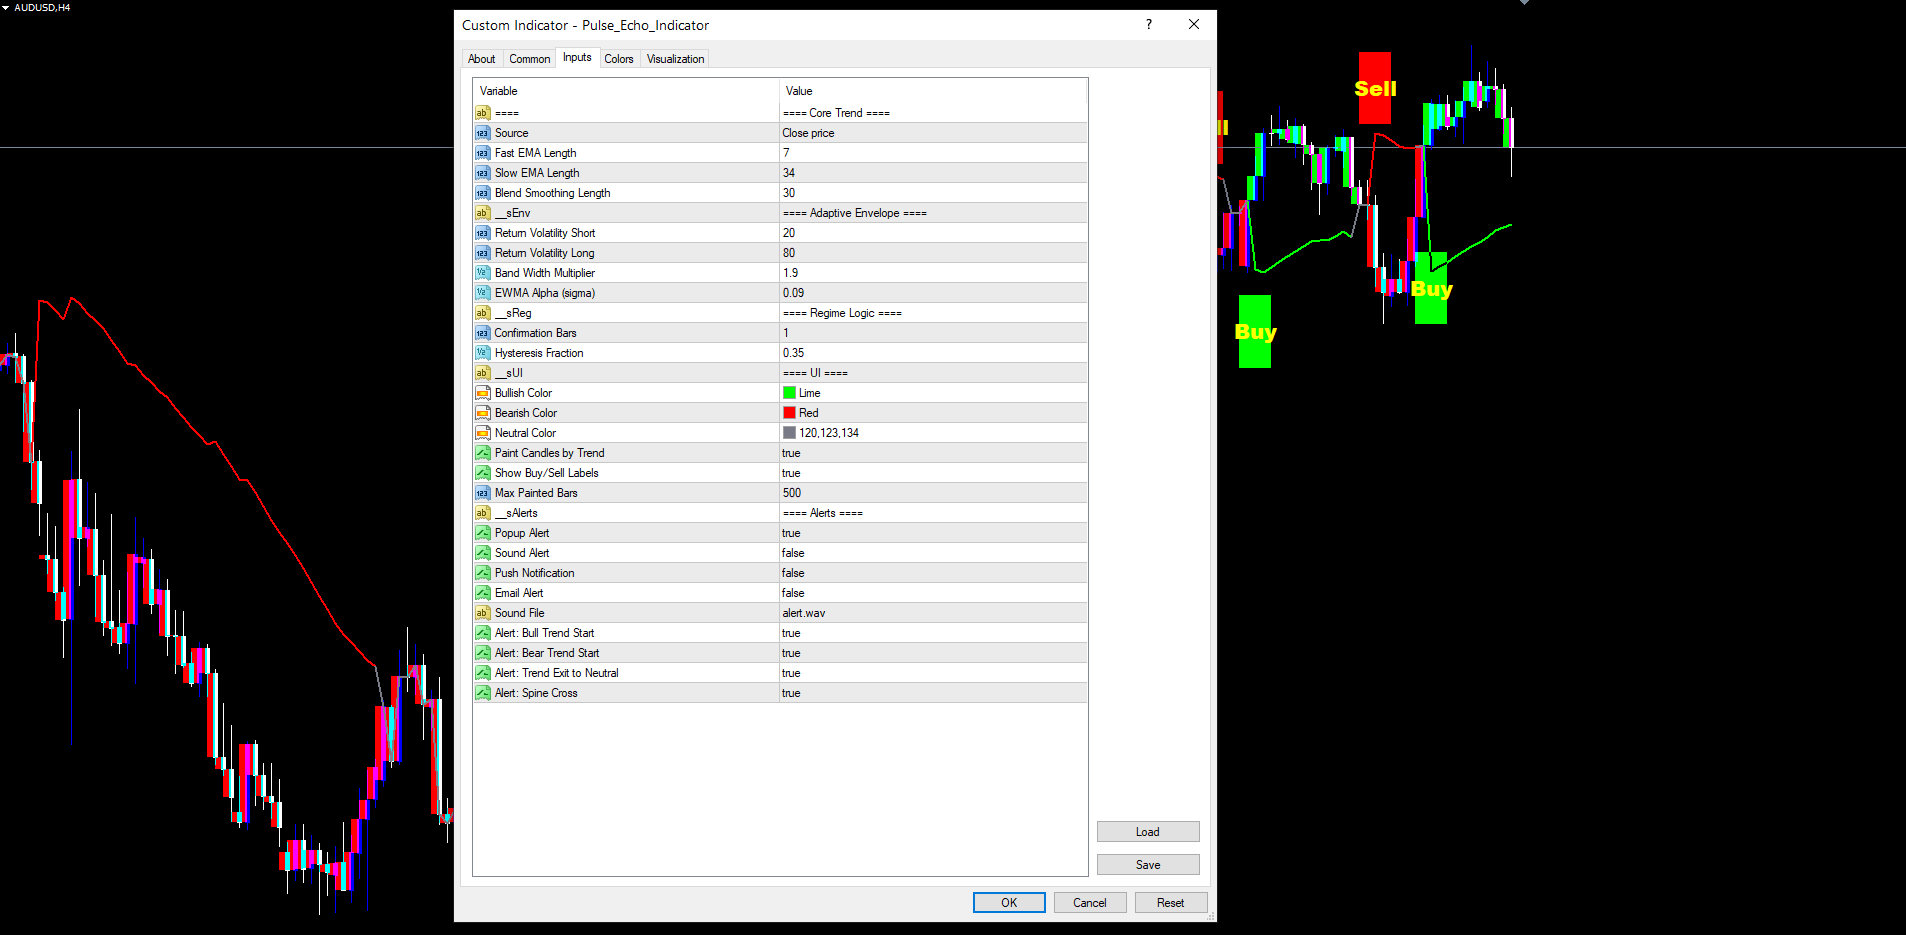
UI Settings
These parameters control the visual output on the chart.
| Parameter | Default | Description |
|---|---|---|
| InpLongCol | clrLime | Color for bullish regime spine, candles, fills, and labels |
| InpShortCol | clrRed | Color for bearish regime |
| InpNeutralCol | C'120,123,134' | Color for neutral regime spine |
| InpPaintCandles | true | Recolor candle bodies according to the current lastSignal |
| InpShowSignals | true | Show the Buy/Sell text labels at regime transitions |
| InpMaxPaintedBars | 500 | Maximum number of recent bars whose candles are recolored |
Visual layering:
- Trend spine sits on top of energy fills (so the line is always visible)
- Energy fills sit behind candles (BACK = true) so the broker's candles overlay the fill
- Painted candles sit on top (BACK = false) and replace the broker's default candle color
- Buy/Sell pill and text sit on top of everything
TIP: If you prefer to see the broker's original candles, set InpPaintCandles = false. The trend spine, energy fills, rim, and Buy/Sell labels will still render normally.
Alert Configuration
Pulse Echo Indicator supports four alert conditions and four delivery channels, each independently configurable.
Alert Channels
| Parameter | Default | Description |
|---|---|---|
| InpAlertPopup | true | Show a popup dialog in MetaTrader |
| InpAlertSound | false | Play a sound file (default alert.wav) |
| InpAlertPush | false | Send push notification to the MetaTrader mobile app |
| InpAlertEmail | false | Send email through MetaTrader's configured SMTP |
| InpAlertSoundFile | alert.wav | Sound file path (relative to MetaTrader's Sounds folder) |
Alert Conditions
| Parameter | Default | Fires When |
|---|---|---|
| InpAlertBullStart | true | Regime transitions from any state to bull (+1). Same moment a Buy label appears |
| InpAlertBearStart | true | Regime transitions from any state to bear (-1). Same moment a Sell label appears |
| InpAlertTrendExit | true | An existing bull or bear regime returns to neutral (typically because price crossed back through the spine) |
| InpAlertSpineCross | true | The close of a confirmed bar crosses the spine in either direction. More sensitive than the regime transitions |
Alert Examples
| Condition | Sample Message |
|---|---|
| Bull Trend Start | Pulse Echo: Bull Trend Start EURUSD H1 |
| Bear Trend Start | Pulse Echo: Bear Trend Start GBPUSD H4 |
| Trend Exit | Pulse Echo: Trend exited to neutral USDJPY M30 |
| Spine Cross | Pulse Echo: Price crossed Spine AUDUSD H1 |
Each alert fires at most once per closed bar. Multiple conditions on the same bar will each produce their own notification, but the same condition will not fire twice on the same bar.
Enabling Push Notifications
- Install the MetaTrader mobile app on your phone (iOS or Android)
- Open the app and navigate to Settings > Messages
- Copy your MetaQuotes ID
- In the desktop MetaTrader, go to Tools > Options > Notifications
- Enter your MetaQuotes ID and enable notifications
- Set InpAlertPush = true in the indicator settings
Enabling Email Notifications
- In MetaTrader, go to Tools > Options > Email
- Check Enable
- Enter your SMTP server, port, login, password, and destination email address
- Click Test to verify the configuration works
- Set InpAlertEmail = true in the indicator settings
Complete Parameter Reference
The following table lists all 26 input parameters in the order they appear in the indicator settings dialog.
| # | Parameter | Type | Default | Category |
|---|---|---|---|---|
| 1 | InpSrc | ENUM_APPLIED_PRICE | PRICE_CLOSE | Core Trend |
| 2 | InpFastLen | int | 7 | Core Trend |
| 3 | InpSlowLen | int | 34 | Core Trend |
| 4 | InpBlendLen | int | 30 | Core Trend |
| 5 | InpRetLenS | int | 20 | Adaptive Envelope |
| 6 | InpRetLenL | int | 80 | Adaptive Envelope |
| 7 | InpBandMult | double | 1.9 | Adaptive Envelope |
| 8 | InpEwmaAlpha | double | 0.09 | Adaptive Envelope |
| 9 | InpConfirmBars | int | 1 | Regime Logic |
| 10 | InpHysteresis | double | 0.35 | Regime Logic |
| 11 | InpLongCol | color | clrLime | UI |
| 12 | InpShortCol | color | clrRed | UI |
| 13 | InpNeutralCol | color | C'120,123,134' | UI |
| 14 | InpPaintCandles | bool | true | UI |
| 15 | InpShowSignals | bool | true | UI |
| 16 | InpMaxPaintedBars | int | 500 | UI |
| 17 | InpAlertPopup | bool | true | Alerts |
| 18 | InpAlertSound | bool | false | Alerts |
| 19 | InpAlertPush | bool | false | Alerts |
| 20 | InpAlertEmail | bool | false | Alerts |
| 21 | InpAlertSoundFile | string | alert.wav | Alerts |
| 22 | InpAlertBullStart | bool | true | Alerts |
| 23 | InpAlertBearStart | bool | true | Alerts |
| 24 | InpAlertTrendExit | bool | true | Alerts |
| 25 | InpAlertSpineCross | bool | true | Alerts |
Trading Strategies
The following three approaches demonstrate different ways to use Pulse Echo Indicator. All strategies assume default parameter values unless stated otherwise.
WARNING: Trading involves significant risk of loss. These strategies are provided for educational purposes only. Always test on a demo account first and never trade with money you cannot afford to lose.
Strategy A: Trend Following (H1 - H4)
Goal: Ride sustained trends from the moment of regime confirmation to the eventual neutral exit.
Recommended setup: Default parameters. Enable Bull Trend Start, Bear Trend Start, and Trend Exit alerts. Disable Spine Cross alert (it is too noisy for swing-style trade management).
Trade management:
- Wait for a Buy or Sell label to appear on a closed bar
- Enter at the open of the next bar after the signal
- Set initial stop loss beyond the opposite envelope at signal time (or at 2x ATR distance from entry, whichever is wider)
- Hold the position as long as the spine remains in the signal direction
- When the Trend Exit alert fires (regime returns to neutral), close the position
- If the regime flips directly to the opposite (bull -> bear without passing through neutral, which can happen on strong reversals), close and consider taking the reverse trade
Strategy B: Pullback Entries
Goal: Enter the trend on a pullback to the spine rather than at the initial breakout.
Recommended setup: Default parameters. Enable Spine Cross alert in addition to the trend-start alerts.
Trade management:
- Wait for a Buy label to establish a confirmed bull regime
- Do not enter immediately on the Buy label
- Wait for price to pull back and for the Spine Cross alert to fire (close crossing back below the spine while the bull regime is still active)
- Enter on the next confirmed bar that closes back above the spine
- Stop loss below the most recent swing low or below the lower envelope
- Target the previous high or the upper envelope at the time of pullback completion
This strategy trades fewer signals than Strategy A but typically achieves better risk-reward by entering closer to the trend line rather than at the breakout.
Strategy C: Multi-Timeframe Confluence
Goal: Trade only when multiple timeframes agree on the regime direction.
Recommended setup: Apply Pulse Echo to both H1 and H4 charts of the same symbol. Enable push notifications on both charts.
Trade management:
- Check the H4 chart for the dominant regime (bull or bear)
- On the H1 chart, take only signals that align with the H4 regime (Buy on H1 only when H4 is bull; Sell on H1 only when H4 is bear)
- Enter at the open of the next bar after the H1 signal
- Use the H1 spine as a trailing stop reference -- close the position when the H1 spine flips against you, even if the H4 regime is still aligned
- Take profit at structural swing levels visible on the H4 chart
TIP: For Strategy C, consider a shorter blend setting (InpBlendLen = 20) on the H1 chart to make the lower-timeframe spine more responsive while keeping the H4 chart at defaults.
Parameter Tuning Presets
The following preset tables provide starting points for different trading styles. Adjust based on your symbol, broker conditions, and personal preference.
Aggressive (M5 - M15)
| Parameter | Aggressive Value |
|---|---|
| InpFastLen | 5 |
| InpSlowLen | 21 |
| InpBlendLen | 15 |
| InpRetLenS | 10 |
| InpRetLenL | 40 |
| InpBandMult | 1.7 |
| InpEwmaAlpha | 0.12 |
| InpConfirmBars | 1 |
Balanced (H1 - H4)
| Parameter | Balanced Value |
|---|---|
| InpFastLen | 7 |
| InpSlowLen | 34 |
| InpBlendLen | 30 |
| InpRetLenS | 20 |
| InpRetLenL | 80 |
| InpBandMult | 1.9 |
| InpEwmaAlpha | 0.09 |
| InpConfirmBars | 1 |
Conservative (D1 - W1)
| Parameter | Conservative Value |
|---|---|
| InpFastLen | 12 |
| InpSlowLen | 50 |
| InpBlendLen | 50 |
| InpRetLenS | 30 |
| InpRetLenL | 120 |
| InpBandMult | 2.3 |
| InpEwmaAlpha | 0.06 |
| InpConfirmBars | 2 |
TIP: Start with the Balanced preset and modify one parameter at a time to observe its effect on signal quality and frequency.
Troubleshooting
No Signals Appearing on the Chart
Possible causes and fixes:
- Warmup period not reached. The indicator requires at least 120 bars of history (slow EMA + long volatility window). Scroll back in history or wait for more bars to form.
- Confirmation count too high. If InpConfirmBars is set to 3 or more, very few breakouts produce signals. Reduce to 1 or 2.
- InpShowSignals disabled. Verify InpShowSignals = true.
- Color mismatch. If you set InpLongCol or InpShortCol to your chart background color, the labels become invisible. Restore default colors.
Trend Spine Not Visible
- Verify the chart has enough history (at least 120 bars after the warmup period)
- Check the line widths in the source code (default is 2 pixels) -- if you customized them in the inputs panel, make sure they are at least 1
- Try removing and reattaching the indicator to force a fresh calculation
Painted Candles Not Showing on MT5
- The MT5 version paints candles via OBJ_RECTANGLE objects on top of the broker's candles. If broker candles are still visible, that is expected -- the indicator does not hide them
- For the cleanest visual, change the chart to Line mode (Charts > Line Chart) so only the painted candles are visible
- Verify InpPaintCandles = true and InpMaxPaintedBars > 0
Buy/Sell Labels Overlap with Candles
- The pill is positioned 2.5 ATRs above the high (Sell) or below the low (Buy). On extremely low-ATR instruments, the pill may visually appear close to price action
- Verify the chart has reasonable price range visible
- The label position is fixed in the source for non-repainting consistency. Adjust chart zoom if labels are hard to read
Alerts Not Firing
- Confirm at least one channel is enabled (InpAlertPopup, InpAlertSound, InpAlertPush, or InpAlertEmail)
- Confirm at least one condition is enabled (InpAlertBullStart, InpAlertBearStart, InpAlertTrendExit, or InpAlertSpineCross)
- For push notifications: verify your MetaQuotes ID is configured in Tools > Options > Notifications and that InpAlertPush = true
- For email alerts: verify SMTP settings in Tools > Options > Email and that InpAlertEmail = true
- Alerts fire only on the first OnCalculate call AFTER the historical scan completes -- you will not receive alerts for bars that closed before you attached the indicator
Different Results Between MT4 and MT5
- The math is identical bar-for-bar after the warmup period
- Tick volume and broker price feeds may differ slightly between MT4 and MT5, which can produce minute differences in computed log returns at very early warmup bars
- These differences diminish to zero within the first 100 bars after warmup
Support and Contact
If you need assistance with Pulse Echo Indicator:
| Contact Method | Details |
|---|---|
| support@forexobroker.com | |
| Website | www.forexobroker.com |
| MQL5 Market | Use the Comments section on the product page |
When contacting support, please include:
- Your MetaTrader version (MT4 or MT5)
- Broker name and symbol format
- A description of the issue
- Screenshots of the chart and the indicator settings dialog
- The exact parameter values you are using
Download the indicator:
- MetaTrader 5: Pulse Echo MT5
- MetaTrader 4: Pulse Echo MT4
CONTACT & SUPPORT
- Email: info@forexobroker.com
- Questions: Use the Comments section on the product page or send a private message
- Bug Reports: Please include your broker name, account type, and a screenshot
-
✅ All MQL Tools: https://www.mql5.com/en/users/forexobroker/ ✅
--------------------------------------------------------------------------------------------------------------
🏦 **Broker I use**: https://icmarkets.com/?camp=55869
🏦 **Broker For EU Traders I use 1**: https://www.ictrading.com?camp=91414
🏦 **Broker I use 2**: https://one.exnessonelink.com/boarding/sign-up/a/c_thuv62ocfq
💻 **VPS**: https://chocoping.com/processing/aff.php?aff=738
💼 **Companies I use for getting funded**:
Fundednext: https://fundednext.com/?fpr=kestutis39
The5ers: https://www.the5ers.com/?afmc=16kl
FTMO: https://trader.ftmo.com/?affiliates=nRAyOhmFRnEnFdOpdLeh
Risk Disclaimer
Trading foreign exchange and CFDs on margin carries a high level of risk and may not be suitable for all investors. You may sustain a loss exceeding your initial investment. Trend Quorum is a technical analysis tool and does not guarantee profitable trades. Past performance is not indicative of future results. The authors accept no liability for any loss arising from use of the indicator. By using Trend Quorum you acknowledge sole responsibility for your trading decisions.


")
![[XAUUSD]: Weekly Liquidity Activation Points (timings), June 22-26, 2026](https://c.mql5.com/6/1013/splash-preview-771790.png "[XAUUSD]: Weekly Liquidity Activation Points (timings), June 22-26, 2026")
")