")
SuperTrend Sentinel Levels Indicator -- Complete User Manual (MT4 & MT5)

Introduction
The SuperTrend Sentinel Levels indicator is a non-repainting SuperTrend trend-following system for MetaTrader 4 and MetaTrader 5. It combines the classic ATR-based SuperTrend trail with a configurable five-gate confluence filter, automatic ATR-anchored TP/SL drawing, an 18-row confirmation dashboard, and an 11-channel alert package. This manual covers installation, every input parameter, the dashboard layout, alert configuration, and troubleshooting.
Key Features:
- SuperTrend trend-following engine with closed-bar non-repaint guarantee
- Five independent confluence gates: EMA(100) Bias, RSI Extreme Filter, ADX Trending, Volume Above Average, HTF SuperTrend Agreement
- Three filter modes: Loose (all flips), Balanced (3 of 5 gates), Strict (all gates pass)
- Every trend flip draws Entry + Stop Loss (Fixed or Trailing) + TP1 + TP2 + TP3 ray-right lines
- Confluence gates filter alerts only -- chart visuals always show every flip
- 18-row confirmation dashboard with six corner positions and pixel-tunable offsets
- VWAP horizontal line with daily session reset
- Fibonacci golden zone (50% and 61.8%) with configurable lookback
- 11 alert channels (BUY / SELL / STRONG BUY / STRONG SELL / Trend Flip Up / Down / TP1 / TP2 / TP3 / SL / Any) across 4 delivery modes (popup, sound, email, push)
- Auto-arming alert guards prevent the historical-signal avalanche on chart attach
- Symbol and timeframe agnostic
Download the indicator:
- MetaTrader 5: SuperTrend Sentinel Levels MT5
- MetaTrader 4: SuperTrend Sentinel Levels MT4
TIP: This indicator is designed for traders who want a structured trend-following system with built-in confluence filtering and automatic risk-architecture drawing. It works on any symbol and any timeframe.
Quick Start
Three steps to get the indicator running on a chart:
- Open MetaTrader, press Ctrl+N to open the Navigator panel.
- Expand Indicators > Market, locate SuperTrend Sentinel Levels, and drag it onto your chart.
- Accept the default inputs (or adjust them as described below), click OK. Within a few ticks the chart fills with the colored SuperTrend line, dotted buffer zones, the 18-row dashboard in the top-right corner, and arrows + TP/SL lines for the latest signal.
The indicator is now live. Wait for the next confirmed bar to close, and if the configured filter mode passes, an alert will fire on your configured channels.
Installation Guide
SuperTrend Sentinel Levels is distributed through the MQL5.com Market. Installation is automatic.
Steps:
- Purchase the indicator from the MQL5 Market product page.
- The indicator installs automatically into your MetaTrader terminal.
- Open MetaTrader and press Ctrl+N to open the Navigator panel.
- Expand Indicators > Market.
- Locate SuperTrend_Sentinel_Levels in the list.
- Drag the indicator onto any chart.
- The settings dialog appears -- adjust parameters as needed (see sections below).
- Click OK to apply.
The indicator runs on any symbol and any timeframe. No additional files or configuration are required.
Understanding the Architecture
The indicator runs three layers in parallel on every confirmed bar:
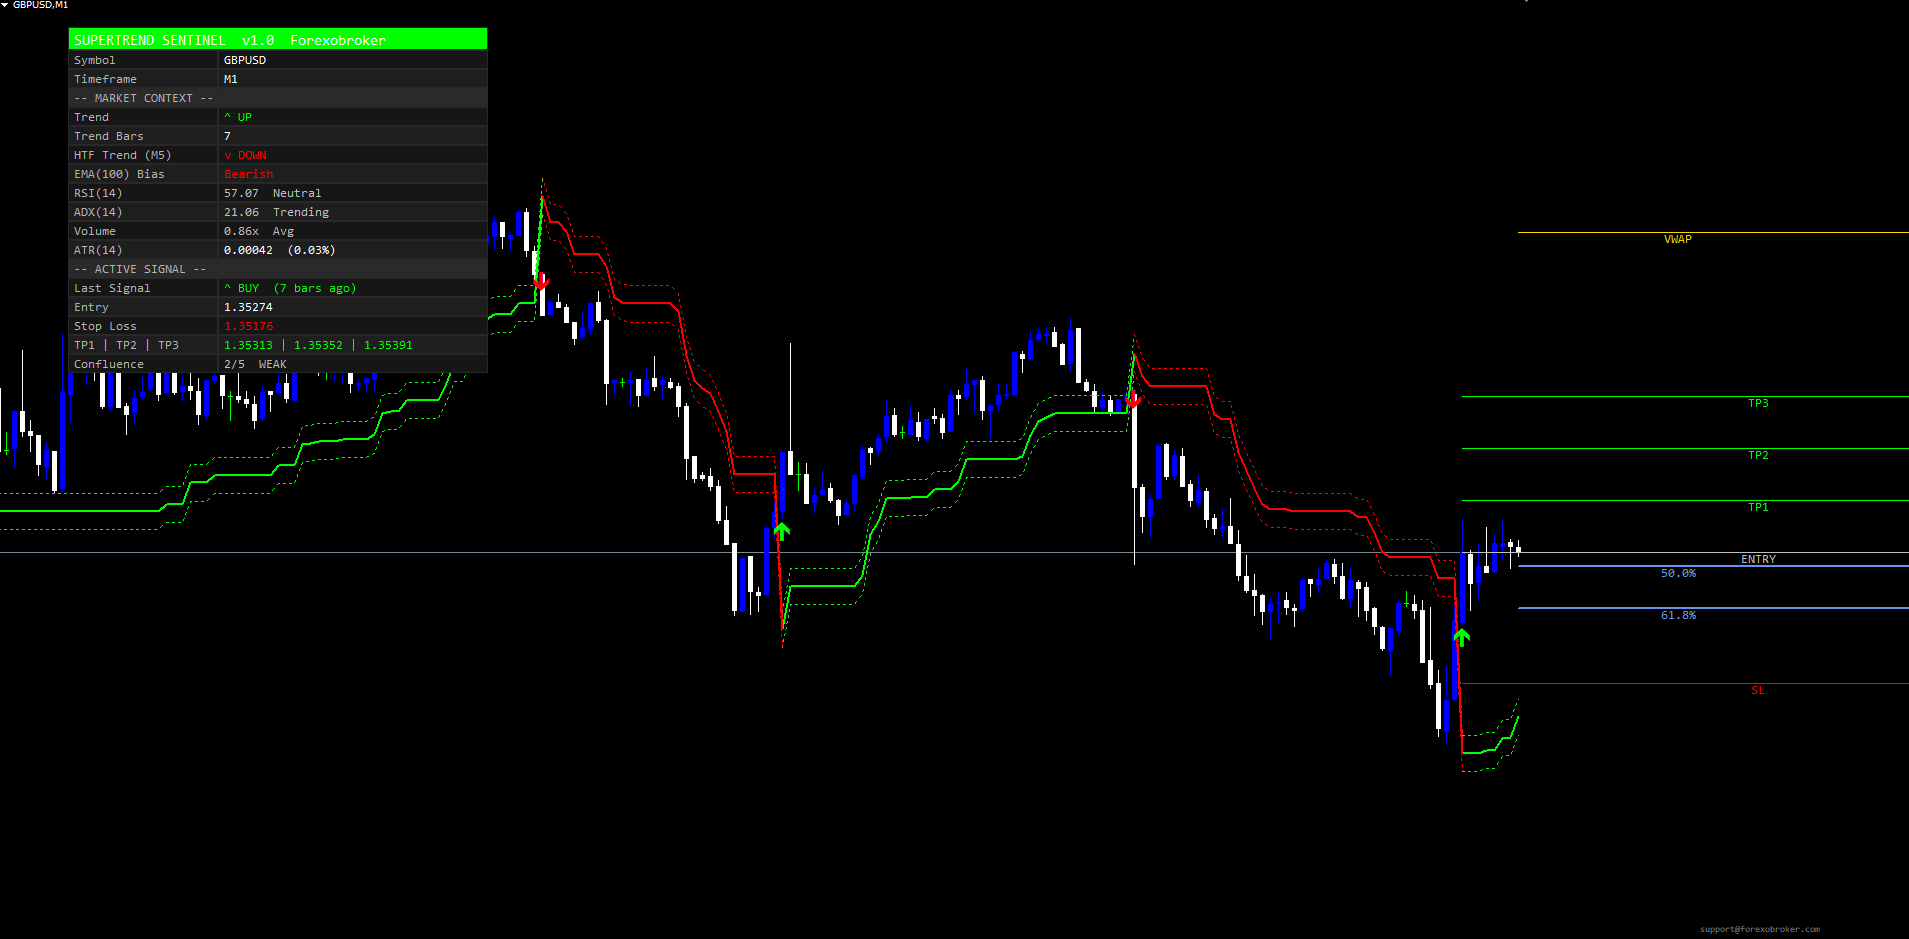
Layer 1: The SuperTrend Trail
A bullish trail and bearish trail are computed from the ATR and (High + Low) / 2 . The trend state flips when the close crosses the opposing trail. The visible SuperTrend line shows the active trail in bull or bear color. A dotted buffer zone is drawn around the line as a visual volatility envelope.
Layer 2: The Confluence Gates
Five independent gates evaluate the current closed bar:
- Gate 1 -- EMA(100) Bias: Blocks longs below EMA(100), blocks shorts above. Catches counter-medium-term-trend reversals.
- Gate 2 -- RSI Extreme: Blocks longs at RSI overbought, blocks shorts at oversold. Prevents late entries into exhausted moves.
- Gate 3 -- ADX Trending: Blocks signals when ADX is below the minimum threshold (default 20). Filters out ranging conditions.
- Gate 4 -- Volume Above Average: Blocks signals when current tick volume is below its N-bar average. Filters out thin-market flips.
- Gate 5 -- HTF SuperTrend Agreement: Blocks signals against the higher-timeframe SuperTrend direction. Eliminates counter-HTF trades.
Each gate can be enabled or disabled individually. The Filter Mode input controls how many enabled gates must pass for a signal to be alert-worthy.
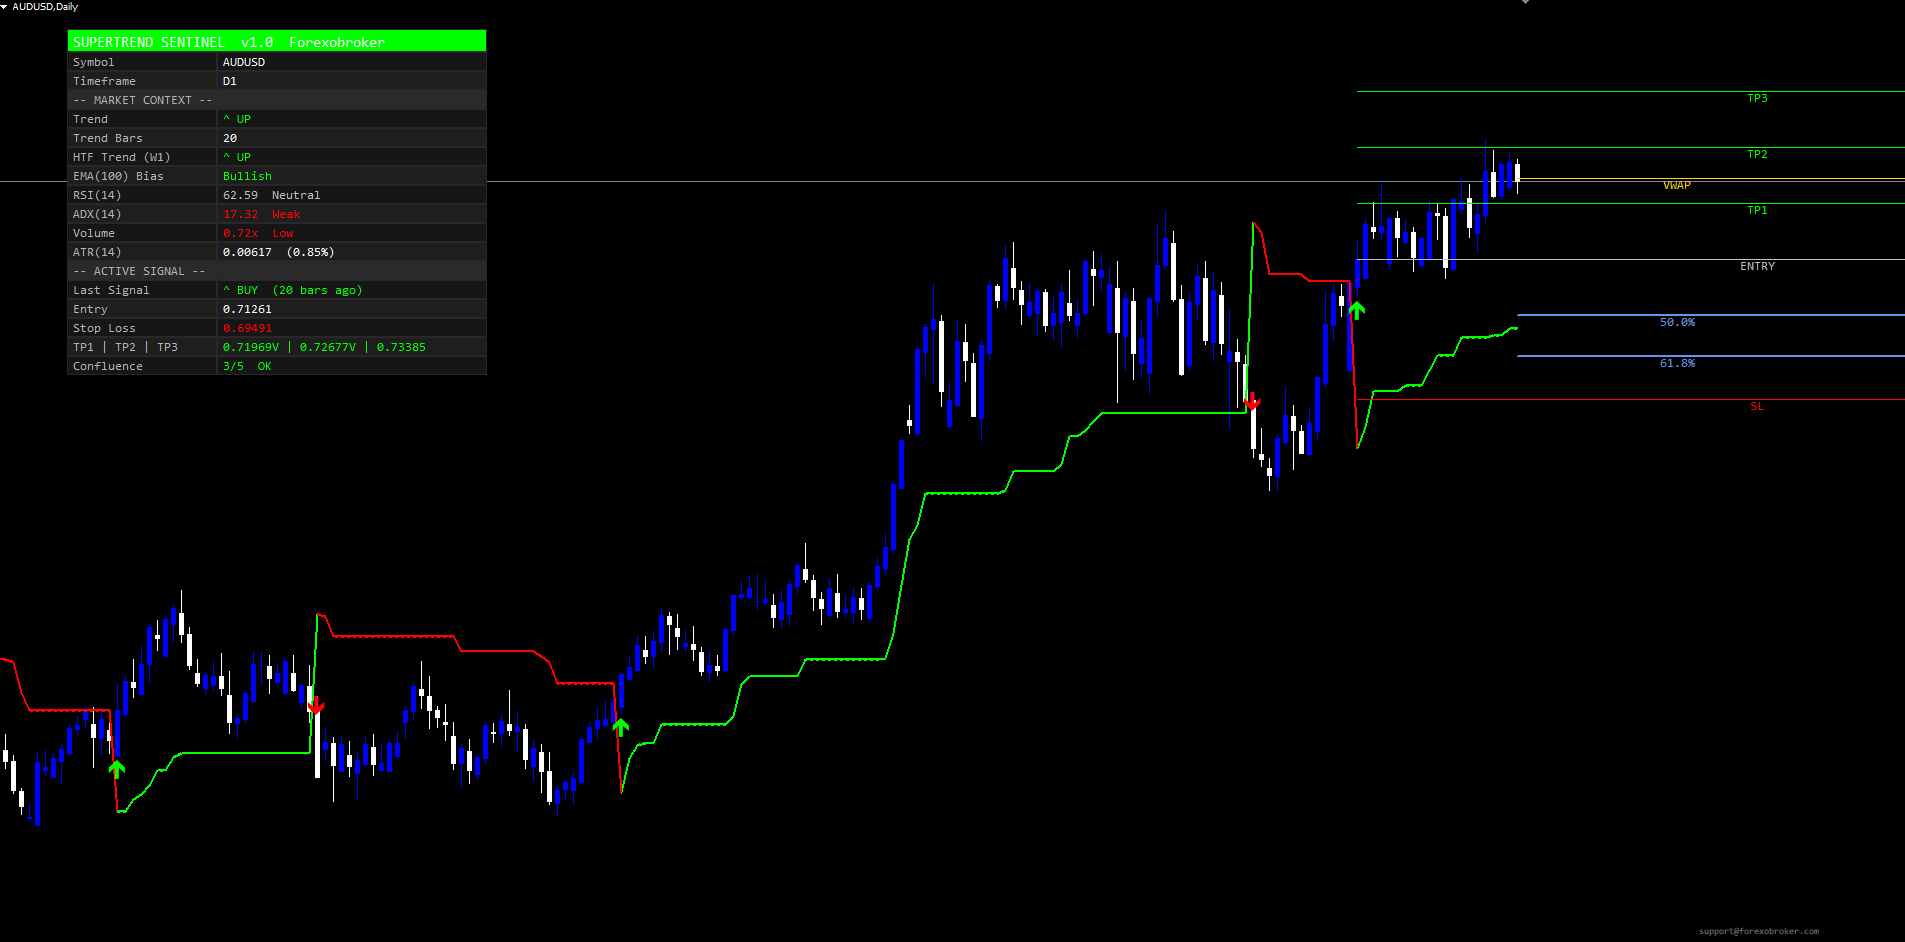
Layer 3: The Risk Architecture
Every trend flip -- regardless of gate state -- draws Entry, Stop Loss, TP1, TP2 and TP3 lines. The lines extend forward as rays to the right edge of the chart. Hit detection runs on every closed bar after the signal, marking TPs as touched ("V") and the SL as hit ("X HIT").
NOTE: Gates filter ALERTS only. Every raw trend flip always draws an arrow and refreshes the TP/SL lines, so the chart always shows the complete historical signal record. The Confluence row in the dashboard tells you whether the current bar passes the filter mode threshold.
Input Parameters Reference
SuperTrend Engine
| Parameter | Default | Description |
|---|---|---|
| ATR Period (SuperTrend) | 10 | ATR length for the SuperTrend trail |
| Factor (ATR Multiplier) | 3.0 | Band width multiplier -- higher = wider bands, fewer flips |
| ATR Length (TP/SL distance) | 14 | Separate ATR length used for TP and SL spacing |
| Buffer Zone % | 0.01 | Buffer width as a percent of SuperTrend value |
Tuning notes: For H1 trend-following on Forex majors, the defaults work well. For M5 / M15 scalping, drop Factor to 2.0-2.5 to get tighter, faster flips. For D1 swing trading, increase Factor to 4.0-5.0 to filter out intraday noise.
TP / SL
| Parameter | Default | Description |
|---|---|---|
| TP1 Factor (x ATR) | 1.0 | TP1 distance in ATR multiples |
| TP2 Factor (x ATR) | 2.0 | TP2 distance in ATR multiples |
| TP3 Factor (x ATR) | 3.0 | TP3 distance in ATR multiples |
| Stop Loss Factor (x ATR) | 2.5 | SL distance in ATR multiples |
| Stop Loss Type | Fixed | Fixed or Trailing |
| Line Style | Solid | Solid, Dashed or Dotted |
| Line Width | 1 | TP/SL line width (pixels) |
| Show TP1 / TP2 / TP3 / SL | true | Individual visibility toggles |
Trailing SL: When Stop Loss Type = Trailing , the SL ratchets in favor of the trade as the SuperTrend line itself ratchets. The SL never moves against the trade. Use this for letting winners run.
Signal Quality
| Parameter | Default | Description |
|---|---|---|
| Wait for Bar Close | true | Non-repaint guard -- signals only on confirmed bars |
| Filter Mode | Balanced (3 of 5) | Loose / Balanced / Strict |
| Gate: EMA(100) Bias | true | EMA bias filter |
| Gate: RSI not at extreme | true | OB/OS block |
| RSI Overbought | 70 | Block buys at or above this RSI value |
| RSI Oversold | 30 | Block sells at or below this RSI value |
| Gate: ADX trending | true | Range filter |
| ADX Min | 20 | ADX trending threshold |
| Gate: Volume above average | true | Weak-volume block |
| Volume MA Length | 20 | Volume moving-average period |
| Gate: HTF SuperTrend agrees | true | Higher-TF filter |
| HTF Multiplier | 4 | HTF = current x mult (2..12) |
Filter Mode guidance:
- Loose -- all raw trend flips fire alerts. Use for visual signal inspection or for back-testing edge frequency.
- Balanced -- the default. Requires 3 of 5 enabled gates to pass (or all if fewer than 3 gates are enabled). Best balance of signal count and quality.
- Strict -- requires all enabled gates to pass. Fewest signals, highest individual quality. Pair with STRONG BUY / STRONG SELL alerts for the most exclusive notifications.
VWAP and Fibonacci
| Parameter | Default | Description |
|---|---|---|
| Show VWAP Line | true | Daily-session VWAP horizontal line |
| VWAP Color | Gold | Custom line color |
| Show Fibonacci (Golden Zone) | true | 50% and 61.8% retracement lines |
| Lookback Period | 50 | Bars used to find swing high/low |
| Fibonacci Level 1 | 0.618 | First retracement level |
| Fibonacci Level 2 | 0.50 | Second retracement level |
| Fib Color 1 / Color 2 | Cornflower Blue | Fib line colors |
Dashboard
| Parameter | Default | Description |
|---|---|---|
| Show Dashboard | true | Master toggle |
| Dashboard Position | Top Right | Six positions: Top/Middle/Bottom + Left/Right |
| Dashboard Text Size | Normal | Tiny / Small / Normal / Large / Huge |
| Dashboard X Offset | 70 | Horizontal padding from chart edge (px) |
| Dashboard Y Offset | 30 | Vertical padding from top or bottom (px) |
| Dashboard Label Col Width | 0 | 0 = auto, or custom px |
| Dashboard Value Col Width | 0 | 0 = auto, or custom px |
Position tuning: The default X offset of 70 px clears the MT4/MT5 price scale on the right side of the chart. If you have indicators or panels overlapping the dashboard, increase X Offset to push it further from the edge, or switch Position to Top Left / Middle Left.
Alerts
| Parameter | Default | Description |
|---|---|---|
| Alerts: Popup | true | MetaTrader popup dialog |
| Alerts: Sound | true | Play sound file |
| Alert Sound File | alert.wav | Custom sound filename |
| Alerts: Email | false | Send email -- requires SMTP config |
| Alerts: Push Notification | false | Mobile push -- requires MetaQuotes ID |
Appearance
| Parameter | Default | Description |
|---|---|---|
| Bull Color | Lime | Bullish trend and BUY arrow color |
| Bear Color | Red | Bearish trend and SELL arrow color |
| Neutral Color | Silver | Neutral state color |
| Dashboard Background | Dark Obsidian | Dashboard cell background |
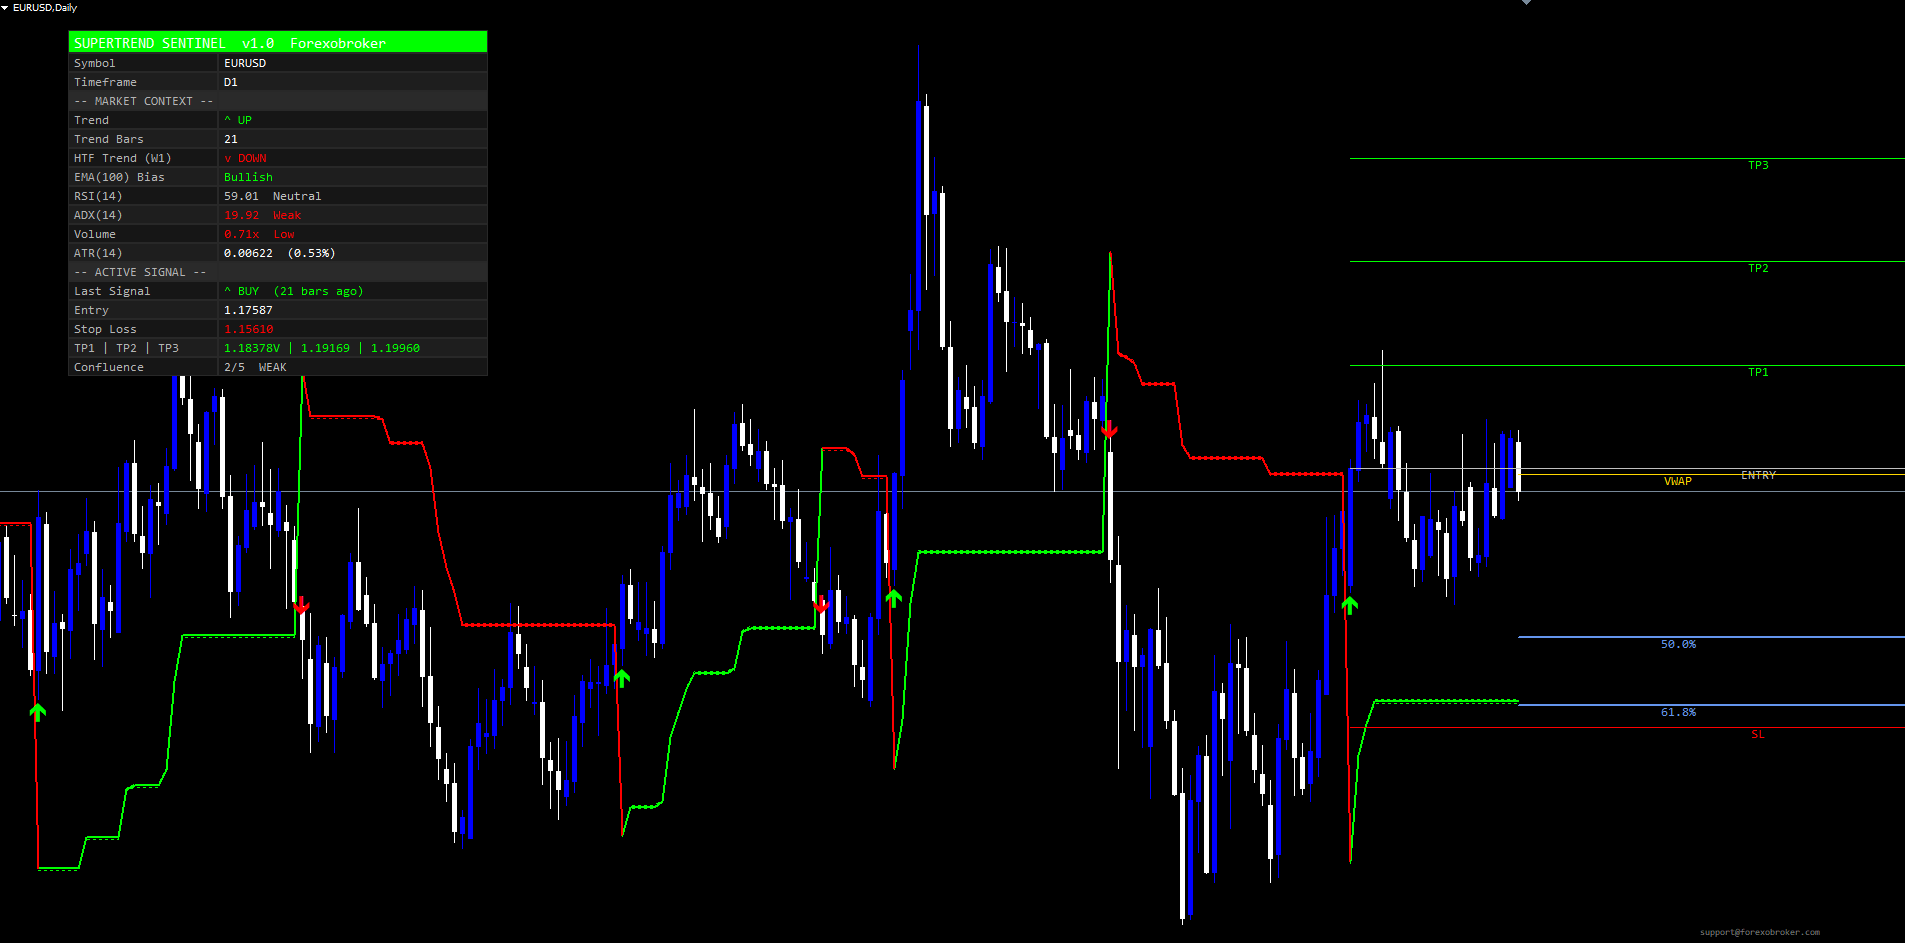
Reading the Dashboard
The 18-row dashboard sits at any of six corner positions. It is organized into three blocks:
Header (Row 0)
A single full-width bull-colored band reading "SUPERTREND SENTINEL v1.0 Forexobroker". Doubles as a brand marker and visual divider.
Identification + Market Context (Rows 1-11)
- Row 1: Symbol (e.g., EURUSD)
- Row 2: Timeframe (e.g., H1)
- Row 3: Separator -- "-- MARKET CONTEXT --"
- Row 4: Trend -- "^ UP" or "v DOWN" in bull/bear color
- Row 5: Trend Bars -- consecutive bars in current direction
- Row 6: HTF Trend -- higher-timeframe direction with the HTF label
- Row 7: EMA(100) Bias -- Bullish / Bearish / Neutral
- Row 8: RSI(14) -- value + Overbought / Neutral / Oversold
- Row 9: ADX(14) -- value + Strong / Trending / Weak
- Row 10: Volume -- ratio + High / Avg / Low
- Row 11: ATR(N) -- value + percent of price
Active Signal (Rows 12-17)
- Row 12: Separator -- "-- ACTIVE SIGNAL --"
- Row 13: Last Signal -- "^ BUY" / "v SELL" + bars since
- Row 14: Entry -- entry price
- Row 15: Stop Loss -- price + "X HIT" flag if touched
- Row 16: TP1 | TP2 | TP3 -- three prices + "V" hit marks
- Row 17: Confluence -- N/5 + STRONG / OK / WEAK / NONE label, color-coded
The Confluence row is the single most useful indicator of current signal quality. STRONG (5/5) is a maximum-confluence setup; OK (3-4/5) is a typical Balanced-mode pass; WEAK (1-2/5) means the signal failed the filter mode threshold and no alert fired; NONE (0/5) means no gate agreed.
Setting Up Alerts
The indicator exposes 11 alert conditions. To enable alerts, set the master toggles in the Alerts input group:
- Open the indicator's settings dialog (right-click the indicator on the chart > Properties, or double-click).
- In the Alerts section, toggle the delivery modes you want:
- Alerts: Popup = true for MetaTrader popup dialogs
- Alerts: Sound = true for audible alerts (uses Alert Sound File )
- Alerts: Email = true for email alerts (requires SMTP config in Tools > Options > Email)
- Alerts: Push Notification = true for mobile push (requires MetaQuotes ID in Tools > Options > Notifications)
- Click OK.
When a signal fires, alerts are sent simultaneously to every enabled delivery mode. The 11 alert conditions are:
- BUY / SELL -- raw trend flips passing the filter mode
- STRONG BUY / STRONG SELL -- signals where all enabled gates passed (fire in addition to BUY/SELL)
- Trend Flip Up / Trend Flip Down -- raw SuperTrend state flips regardless of gates
- TP1 Hit / TP2 Hit / TP3 Hit -- price touched the corresponding target
- SL Hit -- price touched the Stop Loss
- Any Signal -- convenience alert that fires on any BUY or SELL
Each alert fires once per closed bar via a per-bar one-shot guard. When the indicator first attaches to a chart, the alert guards are armed to the latest closed bar, which prevents historical signals from triggering an alert avalanche on attach.
NOTE: Email and Push delivery modes require additional MetaTrader configuration. Email needs SMTP credentials (Tools > Options > Email). Push needs your MetaQuotes ID (Tools > Options > Notifications). Once configured, the alerts fire automatically.
Per-Timeframe and Per-Symbol Guidance
The indicator is symbol and timeframe agnostic, but the default parameters are tuned for typical Forex H1 use. Here are recommendations for common configurations:
Forex Majors (EURUSD, GBPUSD, USDJPY, USDCHF) -- H1
- Use defaults. Filter Mode = Balanced. Expect 3-8 signals per week per pair.
Forex Majors -- M15 (Intraday)
- Drop Factor to 2.5, increase Filter Mode to Strict. Expect 1-3 signals per session per pair.
Forex Majors -- D1 (Swing)
- Increase Factor to 4.0-5.0, drop HTF Multiplier to 2 (so HTF = W1). Expect 1-2 signals per month per pair.
Gold, Silver, Crude (XAUUSD, XAGUSD, WTI) -- H1 and H4
- Use defaults but consider increasing Buffer Zone % to 0.05-0.10 because spreads are wider. Filter Mode Balanced is appropriate.
Indices (SPX, NAS, DAX) -- M15 and H1
- Volume gate is more reliable on indices. Keep Gate: Volume above average = true . Defaults otherwise.
Equities (NVDA, TSLA, GOOG) -- D1
- Increase Factor to 4.0, increase Lookback Period for Fib to 100. Filter Mode Strict for high-quality swing entries.
Crypto (BTC, ETH) -- H1 and H4
- Crypto volatility is higher; increase Factor to 3.5-4.0. Filter Mode Balanced. The RSI extreme gate is more important on crypto because reversals happen at extremes more often.
Troubleshooting
No signals appearing
Lower the Filter Mode to Loose temporarily to verify that raw trend flips are firing. If you see flips but no alert, the gates are blocking them -- check the Confluence row in the dashboard for the live gate-pass count. If you do not see any trend flips at all, the chart may not have enough history; ensure at least 200 closed bars.
Dashboard text overlapping
The default Value Column width (270 px on Normal text size) accommodates the longest expected text including the TP1 | TP2 | TP3 row. If your symbol uses long price strings (e.g., crypto with many decimals), increase Dashboard Value Col Width to 320 or 360 px. Alternatively, drop Dashboard Text Size to Small to shrink the dashboard.
Dashboard not visible or off-screen
Verify Show Dashboard = true . If the chart window is too narrow, the dashboard may sit off-screen -- switch Dashboard Position to Top Left or Bottom Left, or reduce Dashboard X Offset to 8-20 px. If you have other indicators in the same corner, increase Dashboard Y Offset to push it below them.
TP/SL lines disappear after a few bars
This is expected behavior. The lines are drawn for the most recent signal only -- when a new signal fires, the old lines are deleted and the new ones drawn. To see all historical signals, look at the arrow markers (which are never deleted).
Alerts not firing after enabling them
Verify the master delivery toggles ( Alerts: Popup , Alerts: Sound , etc.) are set to true. For email, also confirm SMTP credentials in Tools > Options > Email. For push, confirm MetaQuotes ID in Tools > Options > Notifications. If popup/sound work but email/push do not, the issue is MetaTrader-side, not the indicator.
Avalanche of alerts on indicator attach
This was fixed in v1.0.0 via the auto-arming alert guard. If you experience this, confirm you are running the latest version downloaded from the MQL5 Market.
HTF gate appears stuck at "-"
The HTF SuperTrend needs at least 50 closed bars at the higher timeframe to initialize. If the higher timeframe has just been loaded into MetaTrader, give it a few minutes to populate, or switch to the HTF chart briefly to force MetaTrader to load the history.
Confluence row always shows 0/5 or WEAK
The current bar's market context is failing every gate. This is informational, not an error. Either the conditions are genuinely unfavorable (range market with low volume and counter-HTF) or your gates are configured too strictly for the symbol. Try disabling individual gates one at a time to see which one is blocking.
Download the indicator:
- MetaTrader 5: SuperTrend Sentinel Levels MT5
- MetaTrader 4: SuperTrend Sentinel Levels MT4
CONTACT & SUPPORT
- Email: info@forexobroker.com
- Questions: Use the Comments section on the product page or send a private message
- Bug Reports: Please include your broker name, account type, and a screenshot
-
✅ All MQL Tools: https://www.mql5.com/en/users/forexobroker/ ✅
--------------------------------------------------------------------------------------------------------------
🏦 **Broker I use**: https://icmarkets.com/?camp=55869
🏦 **Broker For EU Traders I use 1**: https://www.ictrading.com?camp=91414
🏦 **Broker I use 2**: https://one.exnessonelink.com/boarding/sign-up/a/c_thuv62ocfq
💻 **VPS**: https://chocoping.com/processing/aff.php?aff=738
💼 **Companies I use for getting funded**:
Fundednext: https://fundednext.com/?fpr=kestutis39
The5ers: https://www.the5ers.com/?afmc=16kl
FTMO: https://trader.ftmo.com/?affiliates=nRAyOhmFRnEnFdOpdLeh
Risk Disclaimer
Trading foreign exchange and CFDs on margin carries a high level of risk and may not be suitable for all investors. You may sustain a loss exceeding your initial investment. Trend Quorum is a technical analysis tool and does not guarantee profitable trades. Past performance is not indicative of future results. The authors accept no liability for any loss arising from use of the indicator. By using Trend Quorum you acknowledge sole responsibility for your trading decisions.


")