")

Introduction
The Wave Breath Indicator is a non-repainting adaptive trend-flow tool for MetaTrader 4 and MetaTrader 5. It tracks market direction using a fast and slow exponential moving average pair on the typical price (HLC/3), wraps the result with volatility-scaled sensitivity bands, and latches a stateful trend that flips only when price closes through the opposite band. The output is a clean, color-coded view of the dominant flow on any chart, any timeframe, any symbol.
Key Features:
- Adaptive Basis Line -- dual EMA on the typical price for smooth, responsive direction tracking
- Volatility Sensitivity Bands -- bands that breathe with market volatility, scaled by your sensitivity multiplier
- Stateful Trend Latch -- trend flips only on confirmed closes through the opposite band, never on intra-bar noise
- Bicolor Cloud Fill -- translucent fill between basis and level, color-coded to current trend
- Color Paint Bars -- bull or bear overlay on every closed candle
- Intensity Background Gradient -- builds opacity over consecutive same-trend bars and resets on flip
- Plain L / S Text Labels -- ASCII labels at every confirmed trend reversal
- Full Alert Package -- popup, mobile push, email, and sound, all individually toggleable
- 100 Percent MT4 / MT5 Parity -- identical internal logic and visual output on both platforms
Download the indicator:
- MetaTrader 5: Wave Breath MT5
- MetaTrader 4: Wave Breath MT4
TIP: Wave Breath Indicator is designed for traders who want a structured, rules-based approach to trend-following. It works on every symbol and every timeframe available in MetaTrader.
Understanding Adaptive Trend-Flow
Wave Breath Indicator builds its view in three layers stacked on top of each other.
Layer 1: The Basis Line. Two exponential moving averages are computed on the typical price (high plus low plus close, divided by three). The fast EMA uses the configured length; the slow EMA uses double that length. Their average becomes the basis line, a smooth, responsive measure of the market's average flow.
Layer 2: The Volatility Bands. The standard deviation of the typical price over the same length is computed and then smoothed with a second exponential moving average using the configurable smoothing length. This smoothed volatility, multiplied by the user sensitivity, sets the half-width of two sensitivity bands placed symmetrically around the basis: an upper band (basis + smoothVol sensitivity) and a lower band (basis - smoothVol sensitivity). The bands widen when volatility expands and tighten when the market goes quiet.
Layer 3: The Stateful Trend Latch. A binary trend value is tracked across bars. While in an uptrend, the active level is the lower band; the trend stays bullish until the close drops below the lower band, at which point it flips to bearish and the active level switches to the upper band. While in a downtrend, the trend stays bearish until the close rises above the upper band. This latch design prevents intra-bar noise from creating false flips: only a confirmed close through the opposite band can change the trend.
How signals are generated:
- Each new bar that closes is processed by the trend state machine
- If the closed bar's trend differs from the previous closed bar's trend, a flip has occurred
- The flip event triggers the L (long) or S (short) label and fires any enabled alerts
- The basis, level, cloud, paint bars, and background gradient all switch to the new trend color
NOTE: Because the trend state machine processes only confirmed bars, signals appear at the close of the breakout bar -- not during its formation. This one-bar settlement delay is what makes Wave Breath Indicator strictly non-repainting.
Installation Guide
Wave Breath Indicator is distributed through the MQL5.com Market. Installation is automatic.
Steps:
- Purchase the indicator from the MQL5 Market product page
- The indicator installs automatically into your MetaTrader terminal
- Open MetaTrader and press Ctrl+N to open the Navigator panel
- Expand Indicators > Market
- Locate Wave Breath Indicator in the list
- Drag the indicator onto any chart, or double-click its name
- The settings dialog appears -- adjust parameters as needed (see sections below)
- Click OK to apply
After loading, you will see:
- Basis line drawn through the middle of the cloud, in bull color during uptrends and bear color during downtrends
- Level line drawn at the active sensitivity band (lower in uptrends, upper in downtrends)
- Cloud fill between basis and level, color-coded to current trend
- Paint bars overlaying each candle in the active trend color
- Background tint that deepens over consecutive same-trend bars
- L / S text labels at every historical and live trend flip
IMPORTANT: Do not manually copy files to the data folder. The MQL5 Market handles all file placement and updates automatically.
Signal System Overview
Each Wave Breath Indicator signal consists of four elements rendered together on the chart at the moment of a confirmed flip:
1. Trend Color Switch
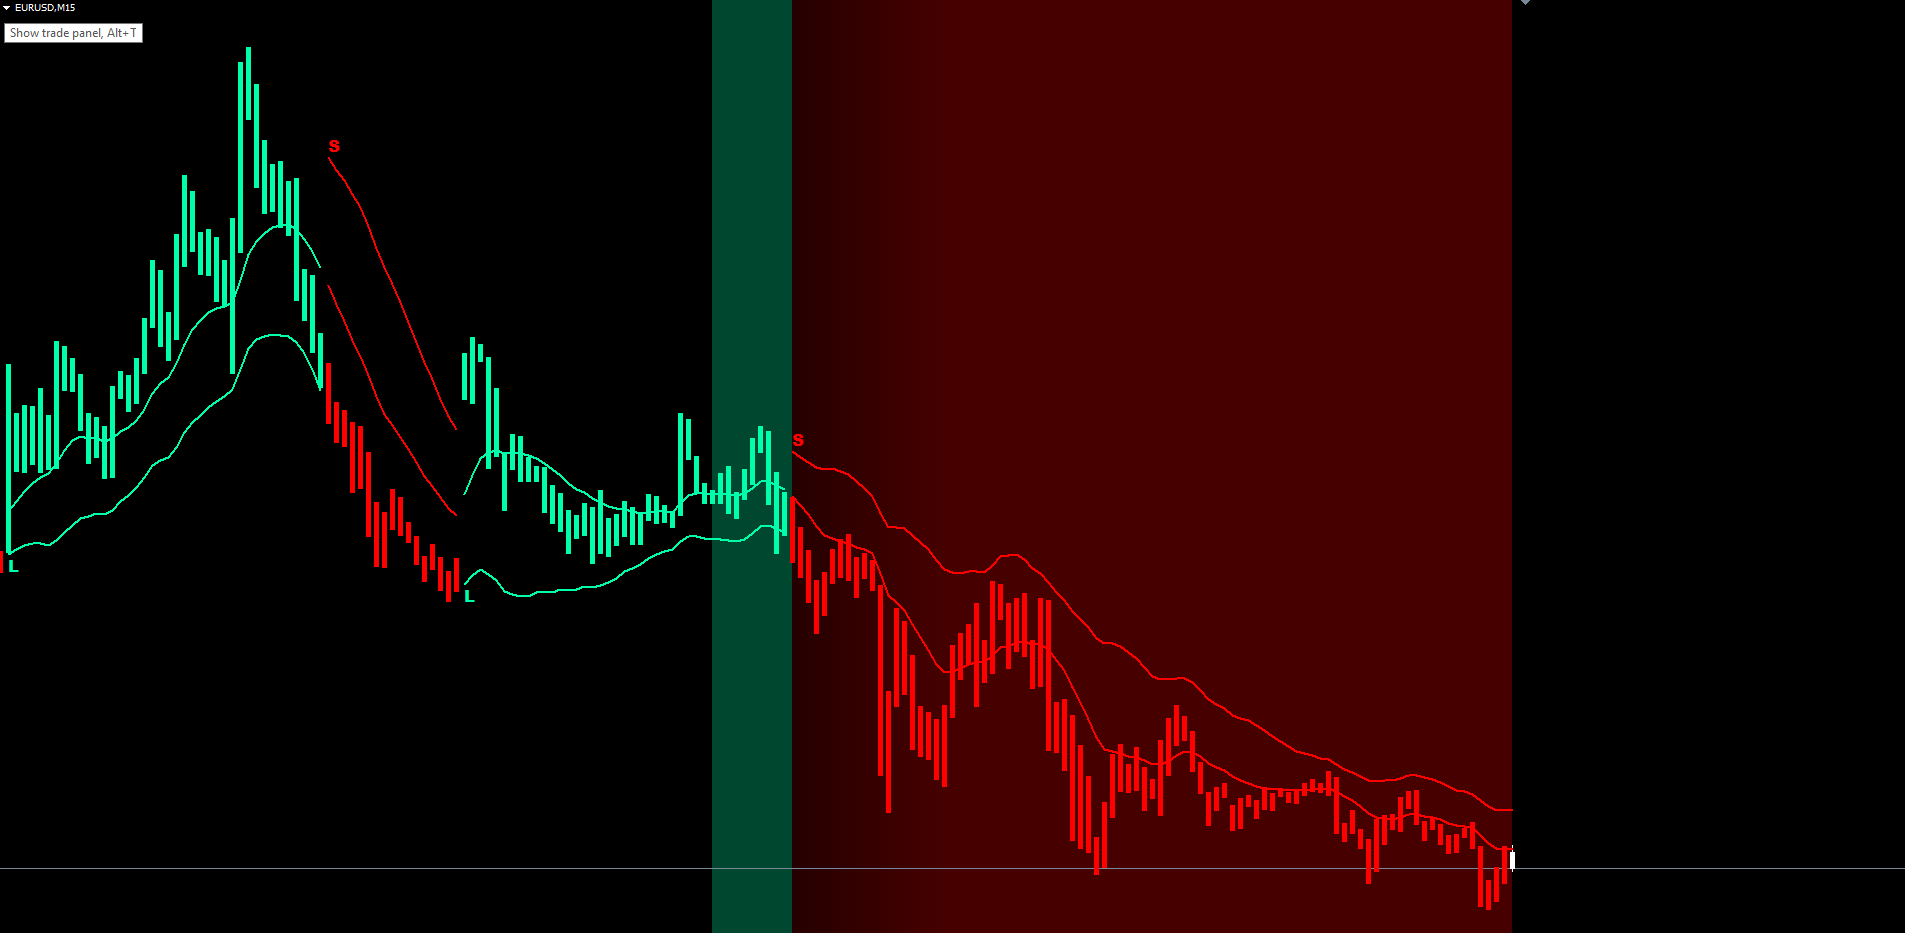
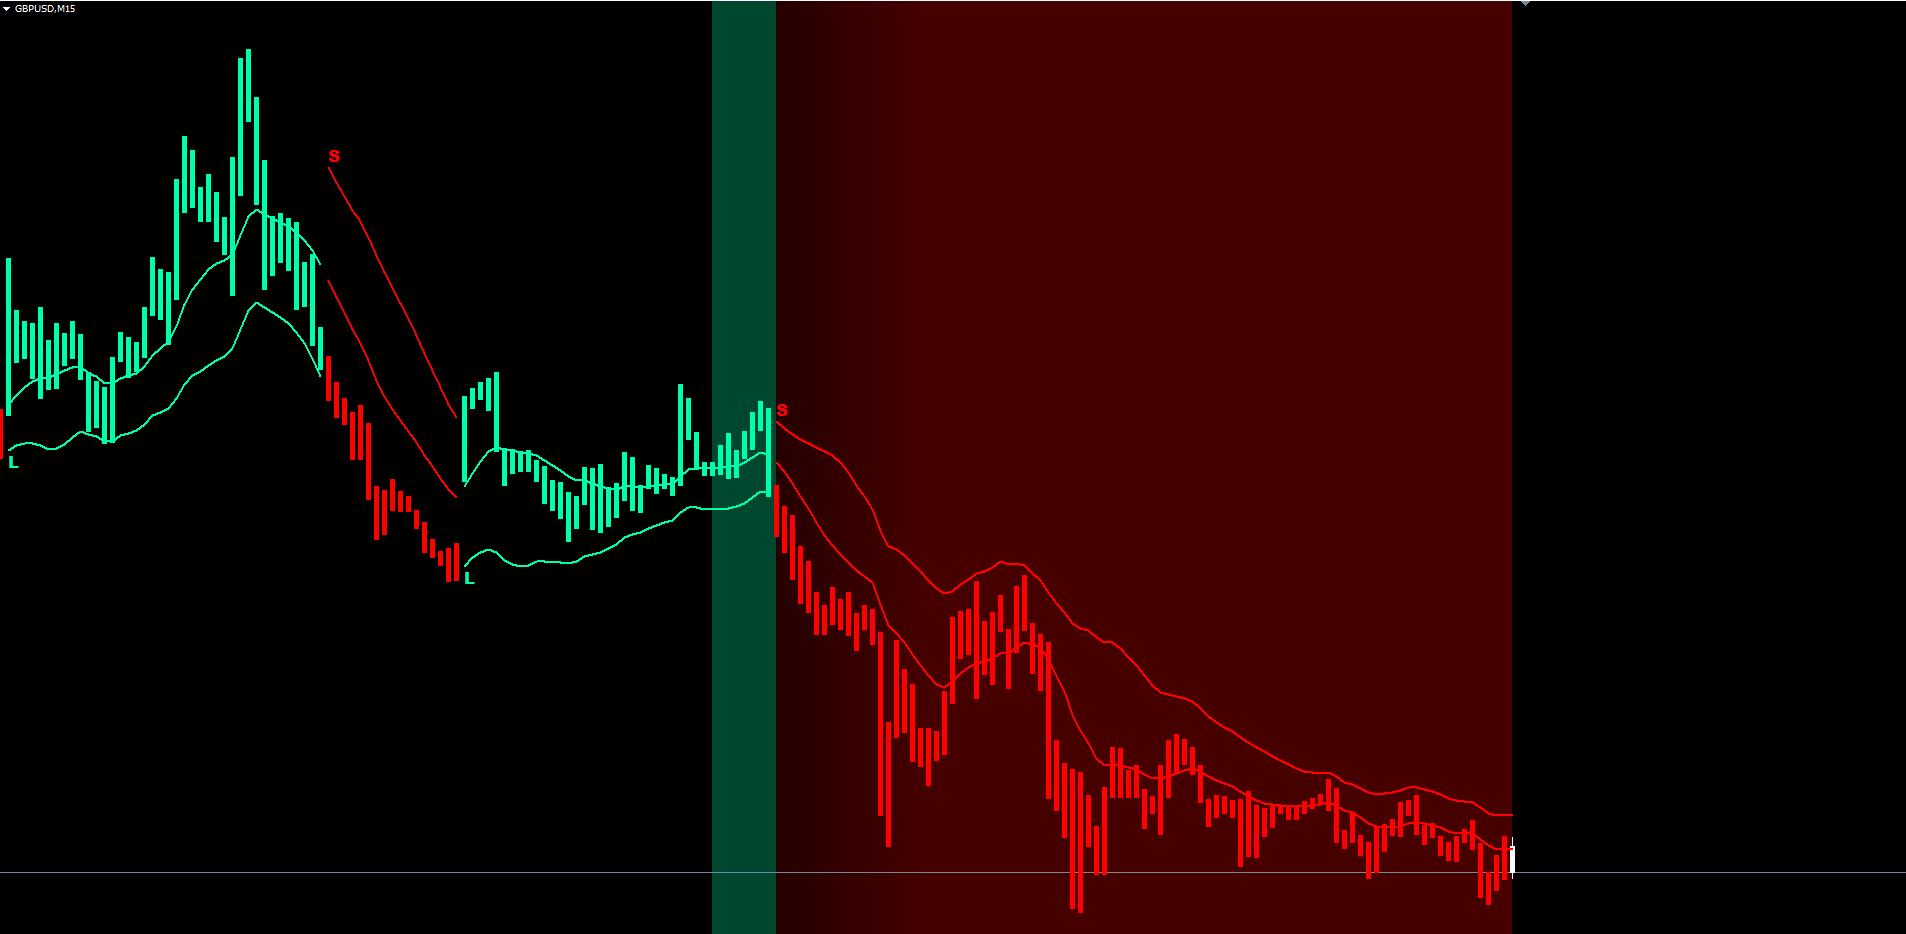
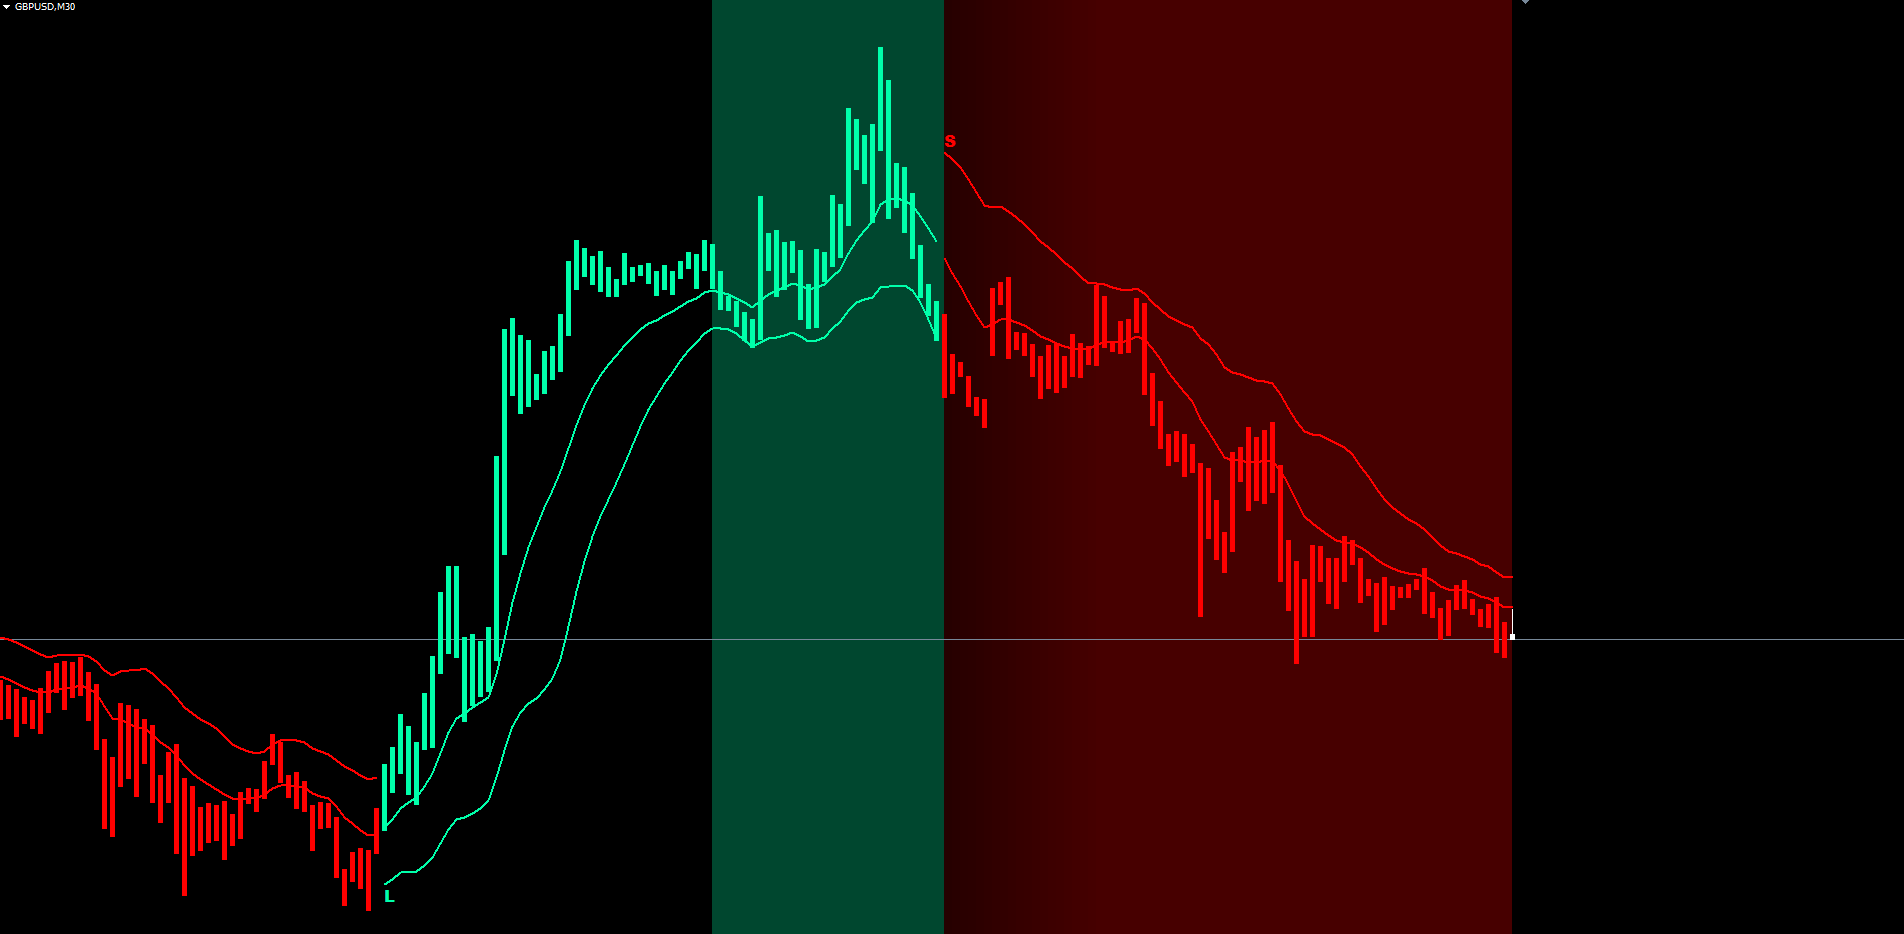
At the close of the flip bar, the basis line, level line, cloud fill, and paint bar all switch to the new trend color (bull or bear). This visual color change is the most immediate cue that a flip has occurred.
2. L or S Text Label
A plain ASCII letter is drawn at the level price of the flip bar:
- L (long) appears in the bull color when the trend flips from bear to bull
- S (short) appears in the bear color when the trend flips from bull to bear
The label is anchored to the bar's time and price, so it stays locked to the chart even as you scroll or zoom.
3. Background Intensity Reset
The intensity counter resets to zero on every flip. The background tint over the new bars starts faint (5 percent opacity at intensity 1) and deepens to 20 percent over twenty bars before saturating.
4. Alert Trigger
Any enabled alerts (popup, push, email, sound) fire once per confirmed flip. The alert message includes the symbol, timeframe, direction (LONG or SHORT), and the level price at the moment of the flip.
Non-Repainting Confirmation:
- The trend state machine evaluates only closed bars
- The forming live bar mirrors the previous closed bar's display values for visual continuity, but its trend value is never committed
- Signals fire at the close of the flip bar (one-bar settlement delay relative to the moment price first crosses the band)
- Once a flip's L or S label appears, it never moves or disappears
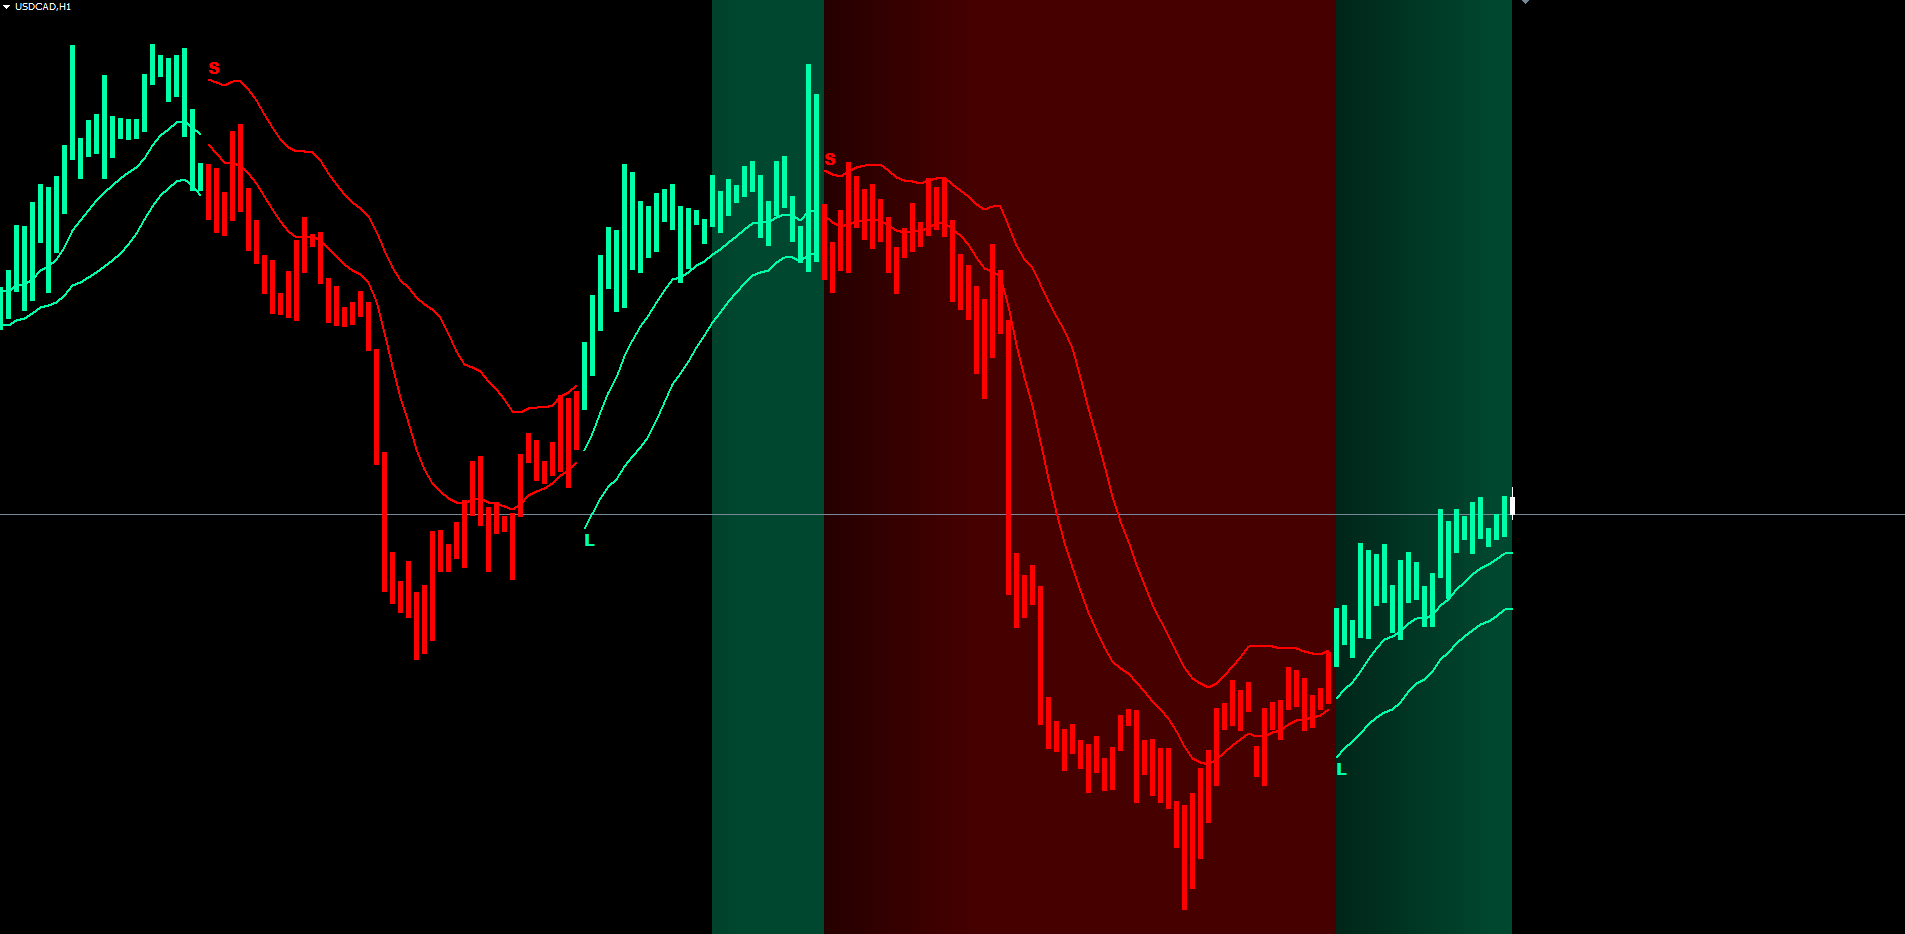
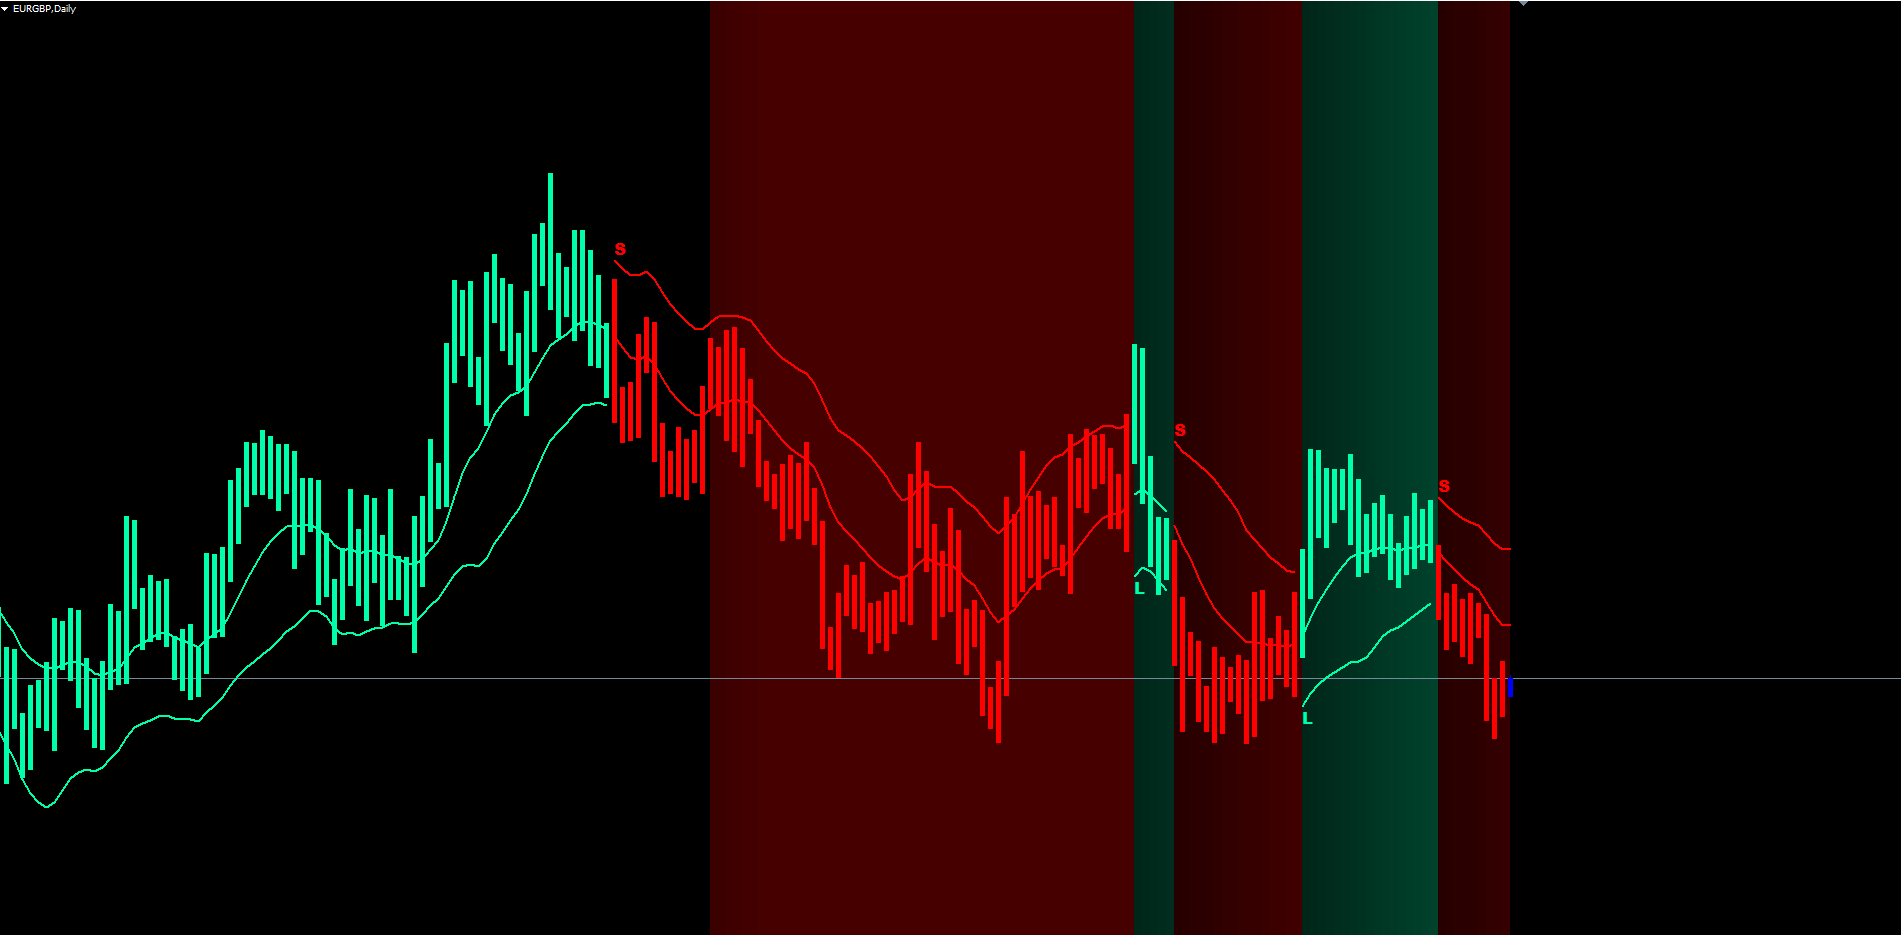
Visual Components Guide
Wave Breath Indicator renders six independent visual components, each toggleable through the input parameters. Understanding what each one represents is the foundation of using the indicator effectively.
The Basis Line
The smoothest, slowest-changing component. It runs through the middle of the cloud and is drawn in the active trend color. The basis represents the average of the fast EMA (length) and the slow EMA (2 x length) on the typical price. Use the basis as a long-term trend reference: when the basis is sloping up, the dominant flow is bullish; when it slopes down, the dominant flow is bearish.
The Level Line
Drawn on the active sensitivity band: the lower band during uptrends, the upper band during downtrends. The level line stair-steps as the band breathes with volatility. It is the indicator's most actionable line because the trend will flip if the close crosses to the opposite side of the level. Many traders use the level line as a trailing stop reference.
The Cloud Fill
The translucent fill between the basis and level lines. The fill alternates between bull and bear colors automatically based on which buffer (basis or level) is on top, which directly reflects the current trend. The cloud's thickness is proportional to the gap between the basis and the active band; a thick cloud means volatility is high and the bands are wide, while a thin cloud means the market is quiet.
Paint Bars
Every closed bar receives a colored vertical overlay matching the current trend. The overlay is rendered with paired histogram buffers (DRAW_HISTOGRAM in MT4, DRAW_HISTOGRAM2 in MT5) covering the bar's high-to-low range. The paint bars make the dominant trend obvious even on charts where the candle bodies are small.
Background Gradient
A translucent rectangle is drawn behind each bar, anchored from chart top to chart bottom. The opacity is computed from a per-bar intensity counter: opacity grows from 5 percent at intensity 1 to 20 percent at intensity 20, then holds. The intensity counter resets to zero on every trend flip. The gradient is drawn on the most recent bars only (default 100), which respects the 512-objects-per-chart limit on MT4. The gradient gives an instant feel for trend persistence without counting bars.
L and S Text Labels
Plain ASCII letters in the trend color at every confirmed flip. The label is anchored to the bar time and the level price. ASCII characters are used (not Unicode mathematical italic) because ASCII renders correctly on every chart, every platform, and every font.
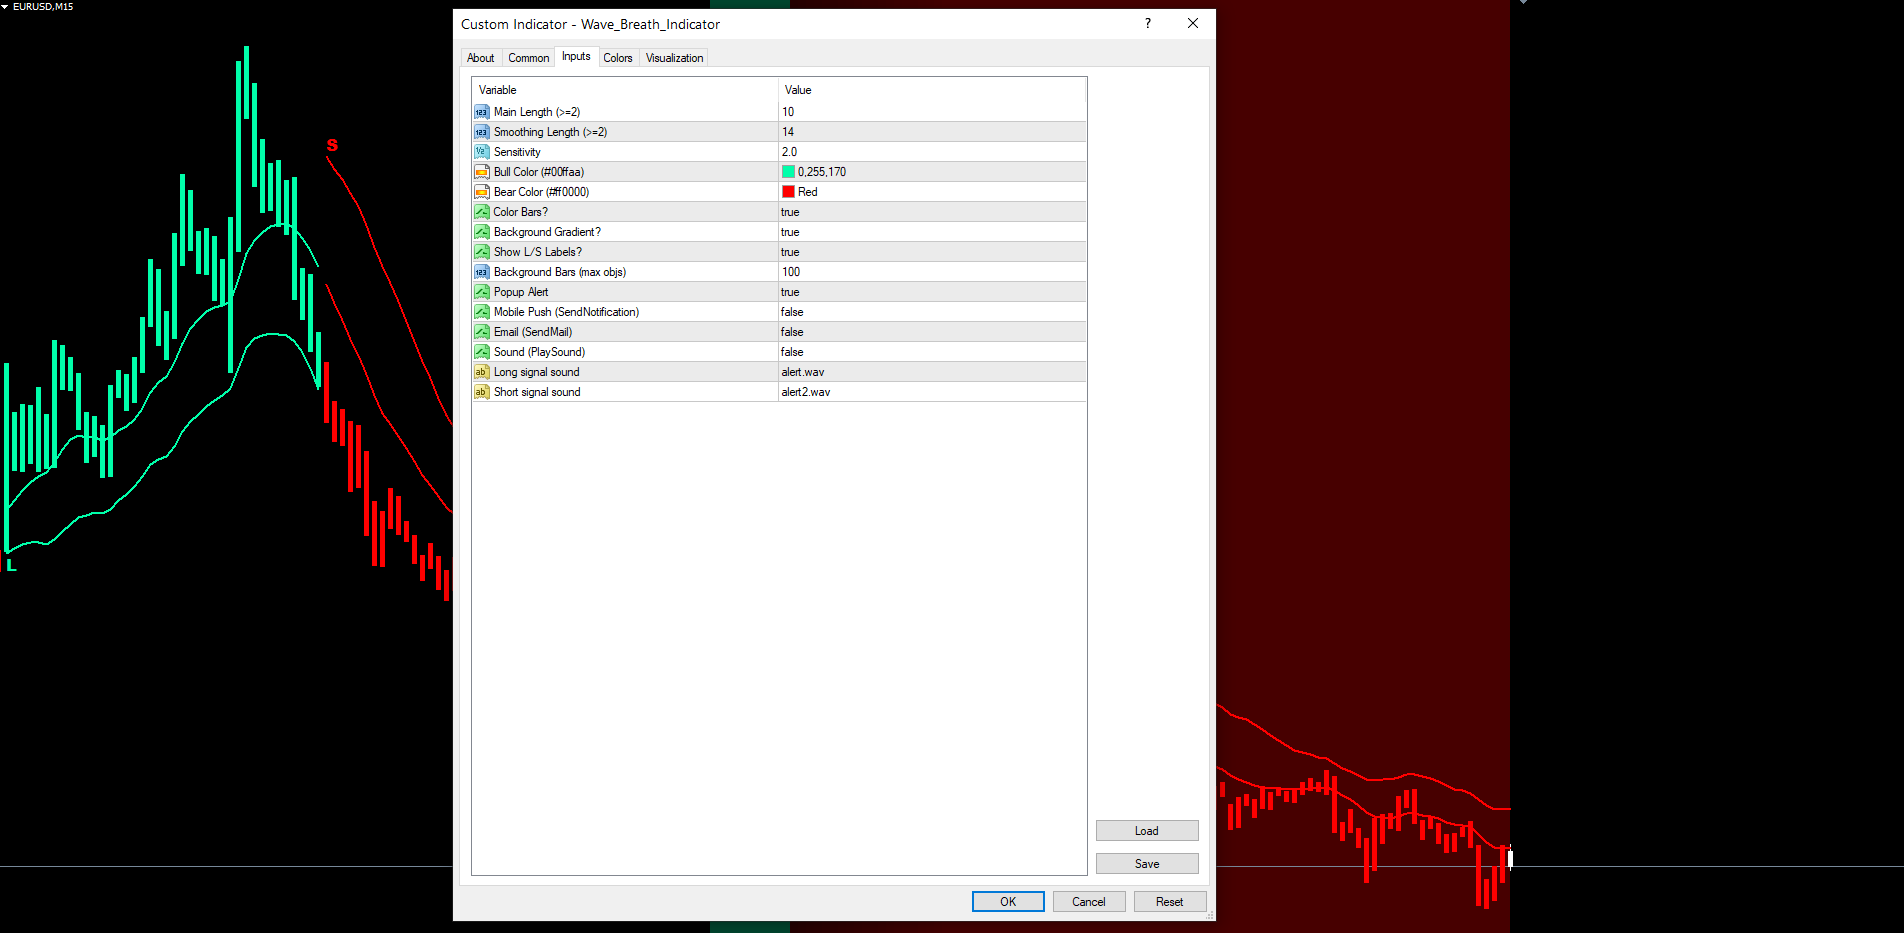
Trend Settings Configuration
These three parameters control the core math of the indicator.
| Parameter | Default | Description |
|---|---|---|
| InpLength | 10 | Main length for the EMA pair on the typical price. The fast EMA uses this length; the slow EMA uses double it. Minimum value 2. Lower values produce a faster, more reactive basis. Higher values produce a slower, smoother basis. |
| InpSmoothLen | 14 | EMA length used to smooth the rolling volatility before band calculation. Minimum value 2. Higher values reduce noise in the bands but slow their response to volatility changes. |
| InpSensitivity | 2.0 | Multiplier applied to smoothed volatility to size the sensitivity bands. Must be greater than zero. Lower values produce tighter bands and more frequent flips; higher values produce wider bands and a slower, more deliberate trend latch. |
Tuning guidance:
- For scalping on M1, M5, M15: try InpLength = 7 , InpSmoothLen = 10 , InpSensitivity = 1.7
- For swing trading on H1, H4: keep all defaults (10, 14, 2.0)
- For position trading on D1, W1: try InpLength = 14 , InpSmoothLen = 21 , InpSensitivity = 2.5
TIP: Adjust one parameter at a time and observe how the basis, level, and band positions change. Moving InpLength has the largest visual impact; sensitivity moves the bands closest to or farthest from the basis.
Visualization Settings Configuration
These six parameters control how the indicator renders on the chart.
| Parameter | Default | Description |
|---|---|---|
| InpBullColor | C'0,255,170' (mint green) | Color used for bull basis, level, cloud, paint bars, and L labels |
| InpBearColor | C'255,0,0' (red) | Color used for bear basis, level, cloud, paint bars, and S labels |
| InpShowBars | true | Enable colored paint bar overlays on each closed candle |
| InpShowBg | true | Draw the per-bar background intensity gradient |
| InpShowSignals | true | Draw L (long) and S (short) text labels at every trend flip |
| InpBgLookback | 100 | Number of recent bars on which the background gradient is rendered (1 to 500) |
Display tips:
- Disable InpShowBg = false on busy lower-timeframe charts (M1, M5) where the gradient may compete with price action
- Disable InpShowBars = false if you prefer to see the original candle colors clearly
- Lower InpBgLookback to 50 on long-history charts where many objects from other indicators are also present
- The 512-objects-per-chart limit on MT4 protects against overflow; if other indicators on the same chart approach the limit, reduce InpBgLookback further
Alert Configuration
Wave Breath Indicator supports four alert delivery channels and one alert event (a confirmed trend flip).
Alert Channels
| Parameter | Default | Description |
|---|---|---|
| InpAlertPopup | true | Show a popup dialog in MetaTrader |
| InpAlertPush | false | Send a push notification to the MetaTrader mobile app |
| InpAlertEmail | false | Send email through the MetaTrader SMTP configuration |
| InpAlertSound | false | Play a sound file from the terminal Sounds folder |
| InpSoundLong | "alert.wav" | Sound file played for long flips |
| InpSoundShort | "alert2.wav" | Sound file played for short flips |
Alert Event
The indicator fires alerts on every confirmed trend flip. A flip occurs when the just-closed bar's trend differs from the bar before it. Alerts fire at most once per bar timestamp, so volatile bars where multiple intra-bar conditions briefly trigger will not produce duplicate alerts.
Alert Message Format
Wave Breath Indicator: LONG signal on EURUSD H1 @ 1.08542 Wave Breath Indicator: SHORT signal on EURUSD H1 @ 1.08542
The message includes: indicator name, direction (LONG or SHORT), symbol, timeframe, and the level price at the moment of the flip.
Enabling Push Notifications
- Install the MetaTrader mobile app on your phone (iOS or Android)
- Open the app and navigate to Settings > Messages
- Copy your MetaQuotes ID
- In the desktop MetaTrader, go to Tools > Options > Notifications
- Enter your MetaQuotes ID and enable notifications
- Set InpAlertPush = true in the indicator settings
Enabling Email Notifications
- In MetaTrader, go to Tools > Options > Email
- Check Enable
- Enter your SMTP server, port, login, password, and destination email address
- Click Test to verify the configuration works
- Set InpAlertEmail = true in the indicator settings
Trading Strategies
The following three approaches demonstrate different ways to use Wave Breath Indicator. All strategies assume default settings unless stated otherwise.
WARNING: Trading involves significant risk of loss. These strategies are provided for educational purposes only. Always test on a demo account first and never trade with money you cannot afford to lose.
Strategy A: Trend-Following with Level-Line Trailing Stop
Goal: Ride medium-term trends with a trailing stop that follows the level line.
Steps:
- Wait for a fresh L or S label
- Enter at the open of the next bar after the flip
- Place initial stop on the opposite side of the level line plus a small buffer (around 0.5 to 1.0 ATR)
- Trail the stop along the level line as it moves (the lower band rises in uptrends, the upper band falls in downtrends)
- Exit on the opposite-color label (next confirmed flip)
This is the most natural way to use the indicator and exploits the latched trend's slow, deliberate movement.
Strategy B: Pullback Entries Inside the Cloud
Goal: Enter pullbacks during established trends rather than chasing the breakout.
Steps:
- Identify a sustained trend by checking that the basis, paint bars, and background tint all share the same color and the background is at high intensity
- Wait for price to retrace into the cloud (between basis and level) without crossing the opposite band
- Enter on a bullish or bearish bar close back in the trend direction
- Place stop on the far side of the level line
- Target the next opposite-color label or a fixed multiple of ATR
This strategy avoids being late to the trend by entering on dips rather than the initial breakout.
Strategy C: Alert-Based Watchlist Monitoring
Goal: Monitor multiple charts without sitting at the screen.
Setup:
- Open charts for all symbols and timeframes you want to monitor
- Apply Wave Breath Indicator to each chart with your preferred settings
- Enable InpAlertPush = true and configure your MetaQuotes ID
- When a push notification arrives, open the chart to evaluate the signal
- Use the basis color, cloud thickness, and background intensity to assess trend quality before entering
TIP: For Strategy C, leave the popup alert enabled in addition to push so that you receive an immediate desktop notification when working at the screen.
Parameter Tuning Presets
The following presets are starting points for different trading styles. Adjust based on your symbol, broker conditions, and personal preference.
Scalping Preset (M1 to M15)
| Parameter | Scalping Value |
|---|---|
| InpLength | 7 |
| InpSmoothLen | 10 |
| InpSensitivity | 1.7 |
| InpShowBg | false |
| InpBgLookback | 50 |
| InpAlertPopup | true |
| InpAlertSound | true |
The faster basis and tighter bands produce more frequent flips suitable for short-duration trades. Disable the background gradient on busy lower-timeframe charts to keep the canvas readable.
Swing Trading Preset (H1 to H4)
| Parameter | Swing Value |
|---|---|
| InpLength | 10 |
| InpSmoothLen | 14 |
| InpSensitivity | 2.0 |
| InpShowBars | true |
| InpShowBg | true |
| InpBgLookback | 100 |
| InpAlertPush | true |
The defaults work well on most major forex pairs, indices, commodities, and crypto. Enable push notifications to be alerted on every flip without sitting at the screen.
Position Trading Preset (D1 to W1)
| Parameter | Position Value |
|---|---|
| InpLength | 14 |
| InpSmoothLen | 21 |
| InpSensitivity | 2.5 |
| InpBgLookback | 200 |
| InpAlertEmail | true |
Wider bands and a smoother basis are appropriate on higher timeframes where each flip represents a multi-day or multi-week structural shift. Email alerts are typically the right channel for D1 and W1 because flips are infrequent and the trader is rarely at the chart.
Troubleshooting
No Basis or Level Lines Visible
Possible causes and fixes:
- Warmup period not reached. The indicator requires InpLength * 2 + InpSmoothLen + 5 historical bars before any output is drawn. Scroll back in history, increase Tools > Options > Charts > Max bars in chart, or attach to a longer-history chart.
- All buffers are EMPTY at the active shift. This can occur on the very first few bars after attach. Wait for the indicator to scan history (typically under one second) and the lines should appear.
- Trend Setting values are out of range. The indicator validates InpLength >= 2 , InpSmoothLen >= 2 , and InpSensitivity > 0 . If any value is invalid, OnInit returns INIT_FAILED and no buffers are drawn. Check the Experts journal for the validation message.
No L / S Labels on First Attach
- Verify InpShowSignals = true
- Wait one second after attaching for the OnTimer to perform the first history scan
- The history scan covers up to 5000 bars; if your chart has fewer bars, all available flips are emitted
- If still empty, remove the indicator and re-attach
Background Gradient Not Visible or Cut Off
- Verify InpShowBg = true
- Increase InpBgLookback (max 500) to render more historical bars
- Check that no other indicator is consuming the 512-object-per-chart limit on MT4. Reduce InpBgLookback if necessary
- The gradient is rendered behind candles (OBJPROP_BACK = true). If your chart background is set to a very dark color, increase opacity by raising sensitivity or use a chart background in a lighter shade
Paint Bars Not Visible
- Verify InpShowBars = true
- Switch the chart style to candlestick or bar chart. Line and area charts hide histogram overlays
- Ensure the paint bar buffers are not all EMPTY (which means trend is zero, i.e. warmup not complete)
Alerts Not Firing
- Check that at least one of InpAlertPopup , InpAlertPush , InpAlertEmail , InpAlertSound is true
- For push notifications: verify your MetaQuotes ID is configured in Tools > Options > Notifications and InpAlertPush = true
- For email alerts: verify SMTP settings in Tools > Options > Email and InpAlertEmail = true
- For sound: verify the .wav file exists in the terminal Sounds folder
- Alerts fire only on confirmed bar close. The forming live bar will not trigger alerts even if its in-progress price crosses the bands
Different Output Between MT4 and MT5
- The internal logic is identical. Minor differences during the warmup period (typically the first InpLength * 5 bars) can occur because of subtle EMA seed timing. After warmup, the two builds produce identical output to within rounding error
- If you see persistent differences after warmup, verify the input parameters match exactly across both terminals
- Tick volume data may differ slightly between MT4 and MT5 feeds; this affects no part of the Wave Breath calculation since the indicator uses HLC/3, not volume
Indicator Slow to Load on Long-History Chart
- The first OnCalculate after attach scans every historical bar to seed the trend state machine. On a chart with 50,000 bars this may take a second or two. Subsequent ticks are incremental and process instantly
- Reduce Tools > Options > Charts > Max bars in chart to a smaller value if the initial load is too slow
Download the indicator:
- MetaTrader 5: Wave Breath MT5
- MetaTrader 4: Wave Breath MT4
CONTACT & SUPPORT
- Email: info@forexobroker.com
- Questions: Use the Comments section on the product page or send a private message
- Bug Reports: Please include your broker name, account type, and a screenshot
-
✅ All MQL Tools: https://www.mql5.com/en/users/forexobroker/ ✅
--------------------------------------------------------------------------------------------------------------
🏦 **Broker I use**: https://icmarkets.com/?camp=55869
🏦 **Broker For EU Traders I use 1**: https://www.ictrading.com?camp=91414
🏦 **Broker I use 2**: https://one.exnessonelink.com/boarding/sign-up/a/c_thuv62ocfq
💻 **VPS**: https://chocoping.com/processing/aff.php?aff=738
💼 **Companies I use for getting funded**:
Fundednext: https://fundednext.com/?fpr=kestutis39
The5ers: https://www.the5ers.com/?afmc=16kl
FTMO: https://trader.ftmo.com/?affiliates=nRAyOhmFRnEnFdOpdLeh
Risk Disclaimer
Trading foreign exchange and CFDs on margin carries a high level of risk and may not be suitable for all investors. You may sustain a loss exceeding your initial investment. Trend Quorum is a technical analysis tool and does not guarantee profitable trades. Past performance is not indicative of future results. The authors accept no liability for any loss arising from use of the indicator. By using Trend Quorum you acknowledge sole responsibility for your trading decisions.


")