
Smart Money Concepts (SMC) Analytics Indicator: User Manual

Smart Money Concepts (SMC) Analytics Indicator : User Manual
Welcome to the SMC Analytics Indicator manual. This tool automatically maps institutional market structure, order blocks, and liquidity zones directly onto your charts, removing the guesswork from Smart Money Concepts trading.
What is Smart Money Concepts (SMC)?
SMC is a trading methodology based on tracking the market footprints of institutional traders (central banks, market makers, hedge funds). Instead of relying on traditional retail indicators like RSI or MACD, SMC focuses on raw price action, market structure shifts, and areas of high liquidity where big banks accumulate or distribute their positions.
==============================================================================================================================================================================================================================================================================
Core Features & Trading Concepts
1. Market Structure: CHoCH vs. BOS
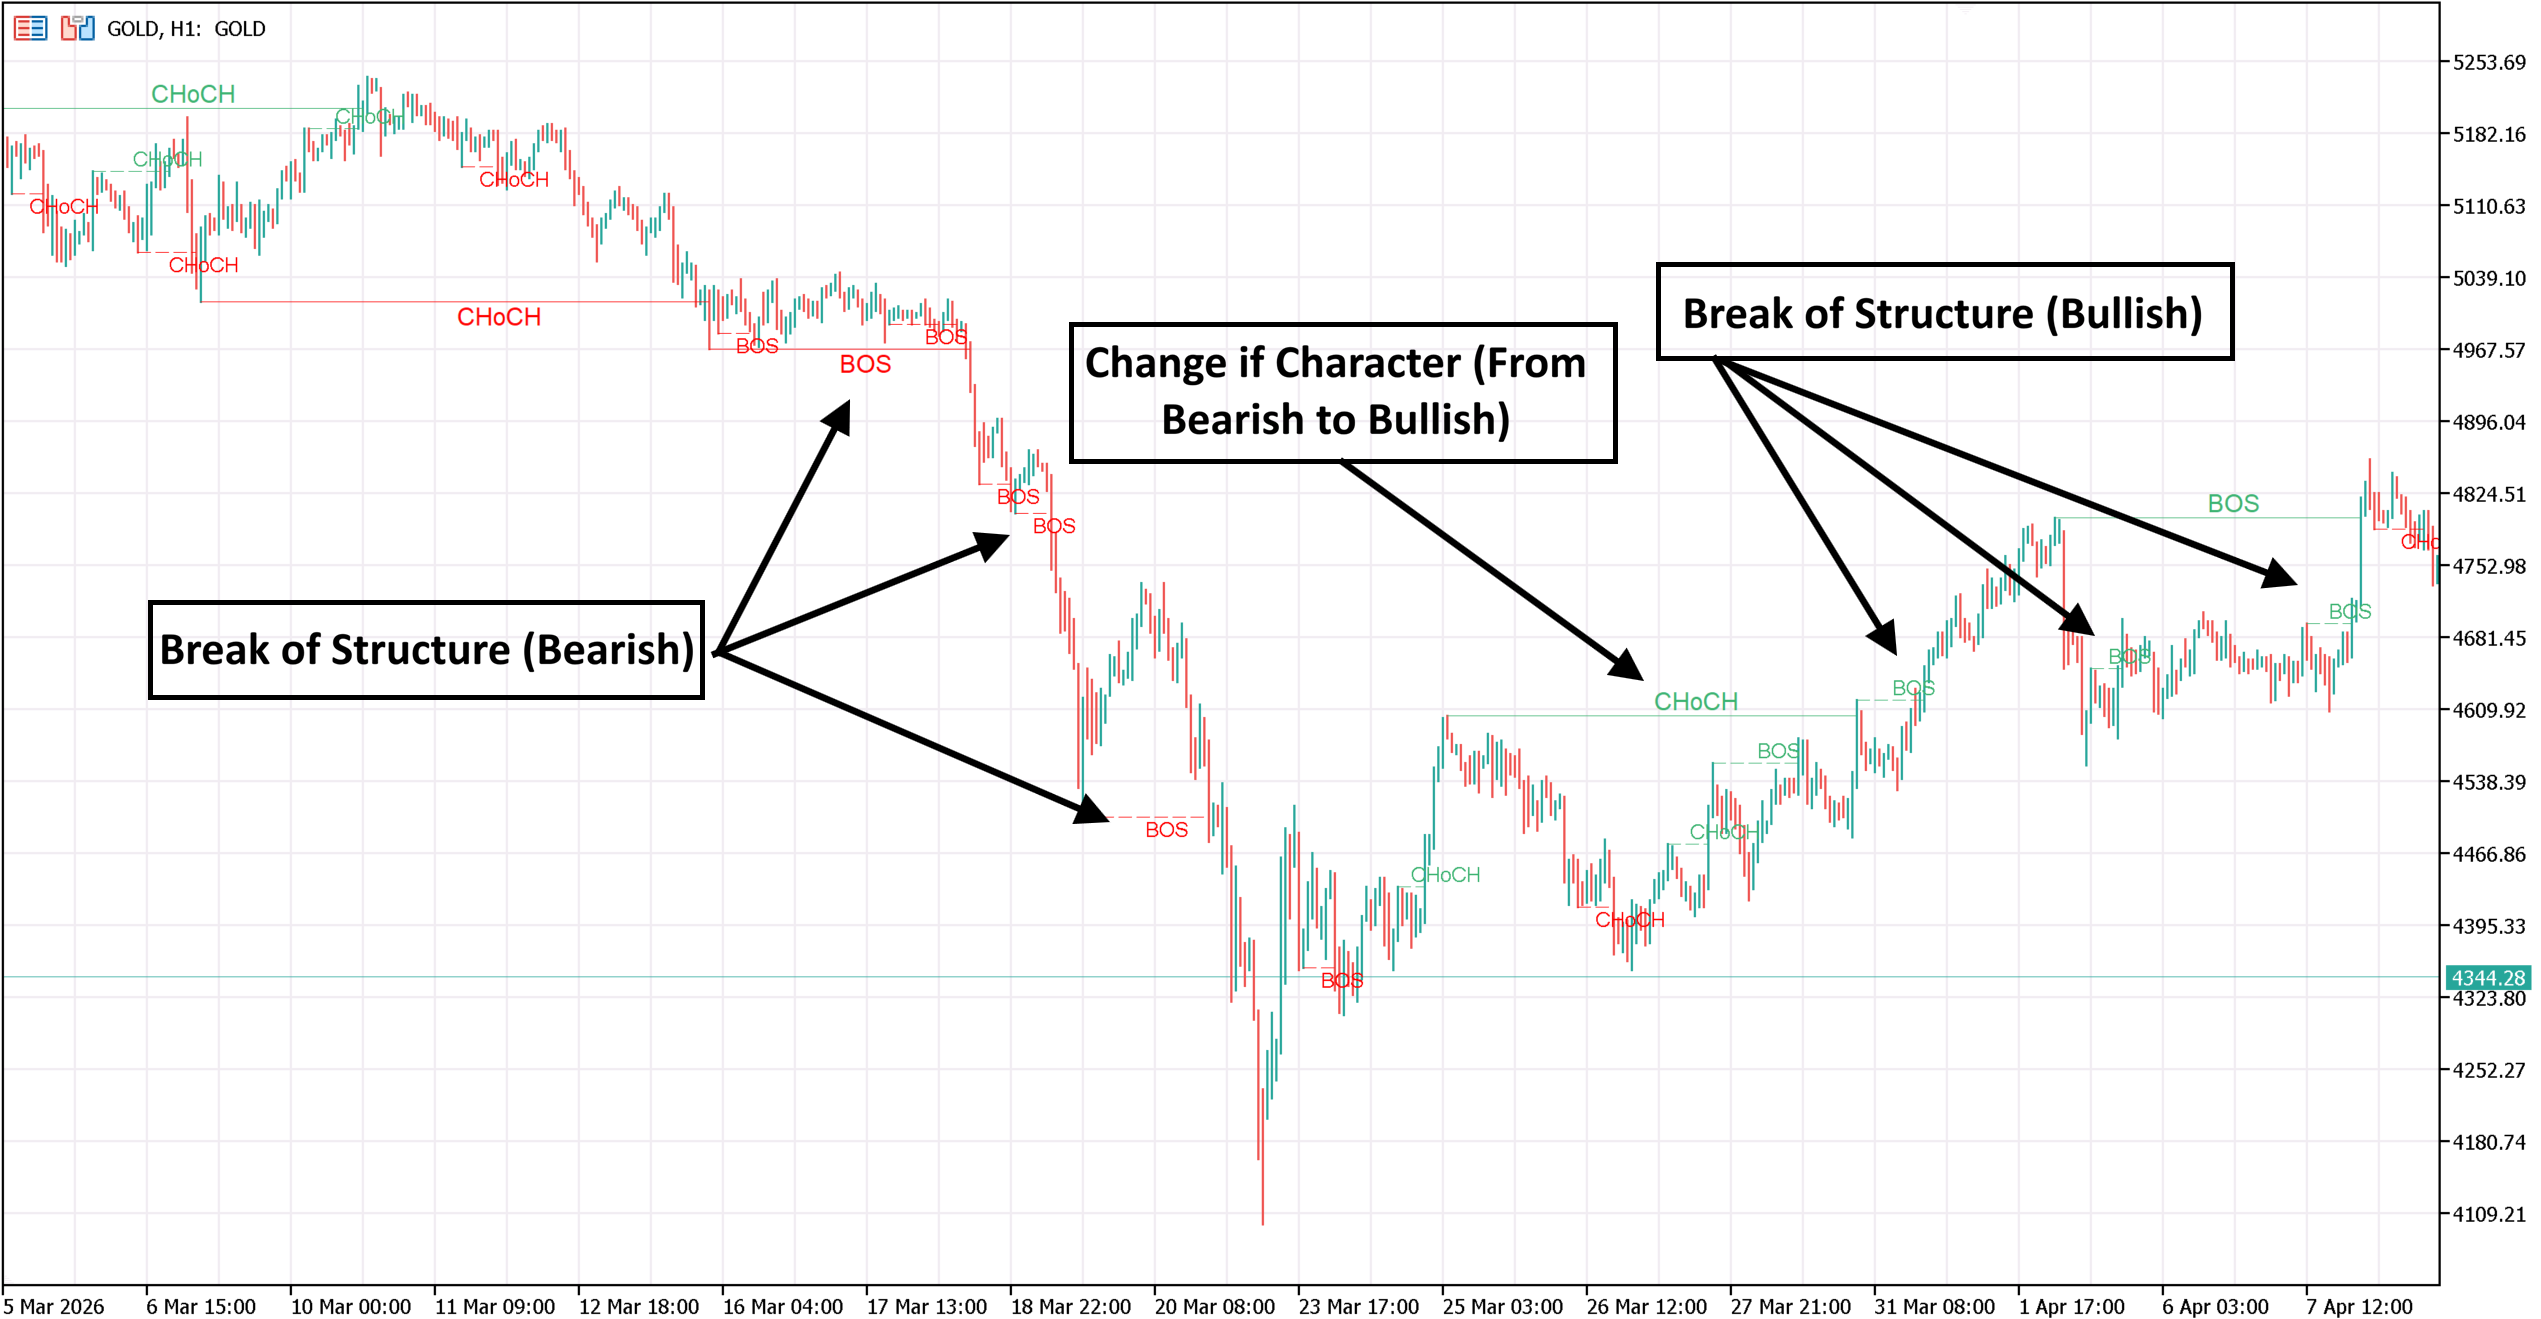
Market structure is the foundation of SMC. The indicator tracks two critical structural changes:
-
CHoCH (Change of Character): * What it is: The first sign of a potential trend reversal. It occurs when price breaks the opposite structural high or low for the first time.
-
Trading Rule: Signal to stop trading the old trend and prepare for a reversal.
-
-
BOS (Break of Structure): * What it is: The continuation of an existing trend. It occurs when price breaks a major swing high in an uptrend, or a swing low in a downtrend.
-
Trading Rule: Signal to look for trend-continuation setups (buying dips or selling rallies).
2. Internal Structure vs. Swing Structure
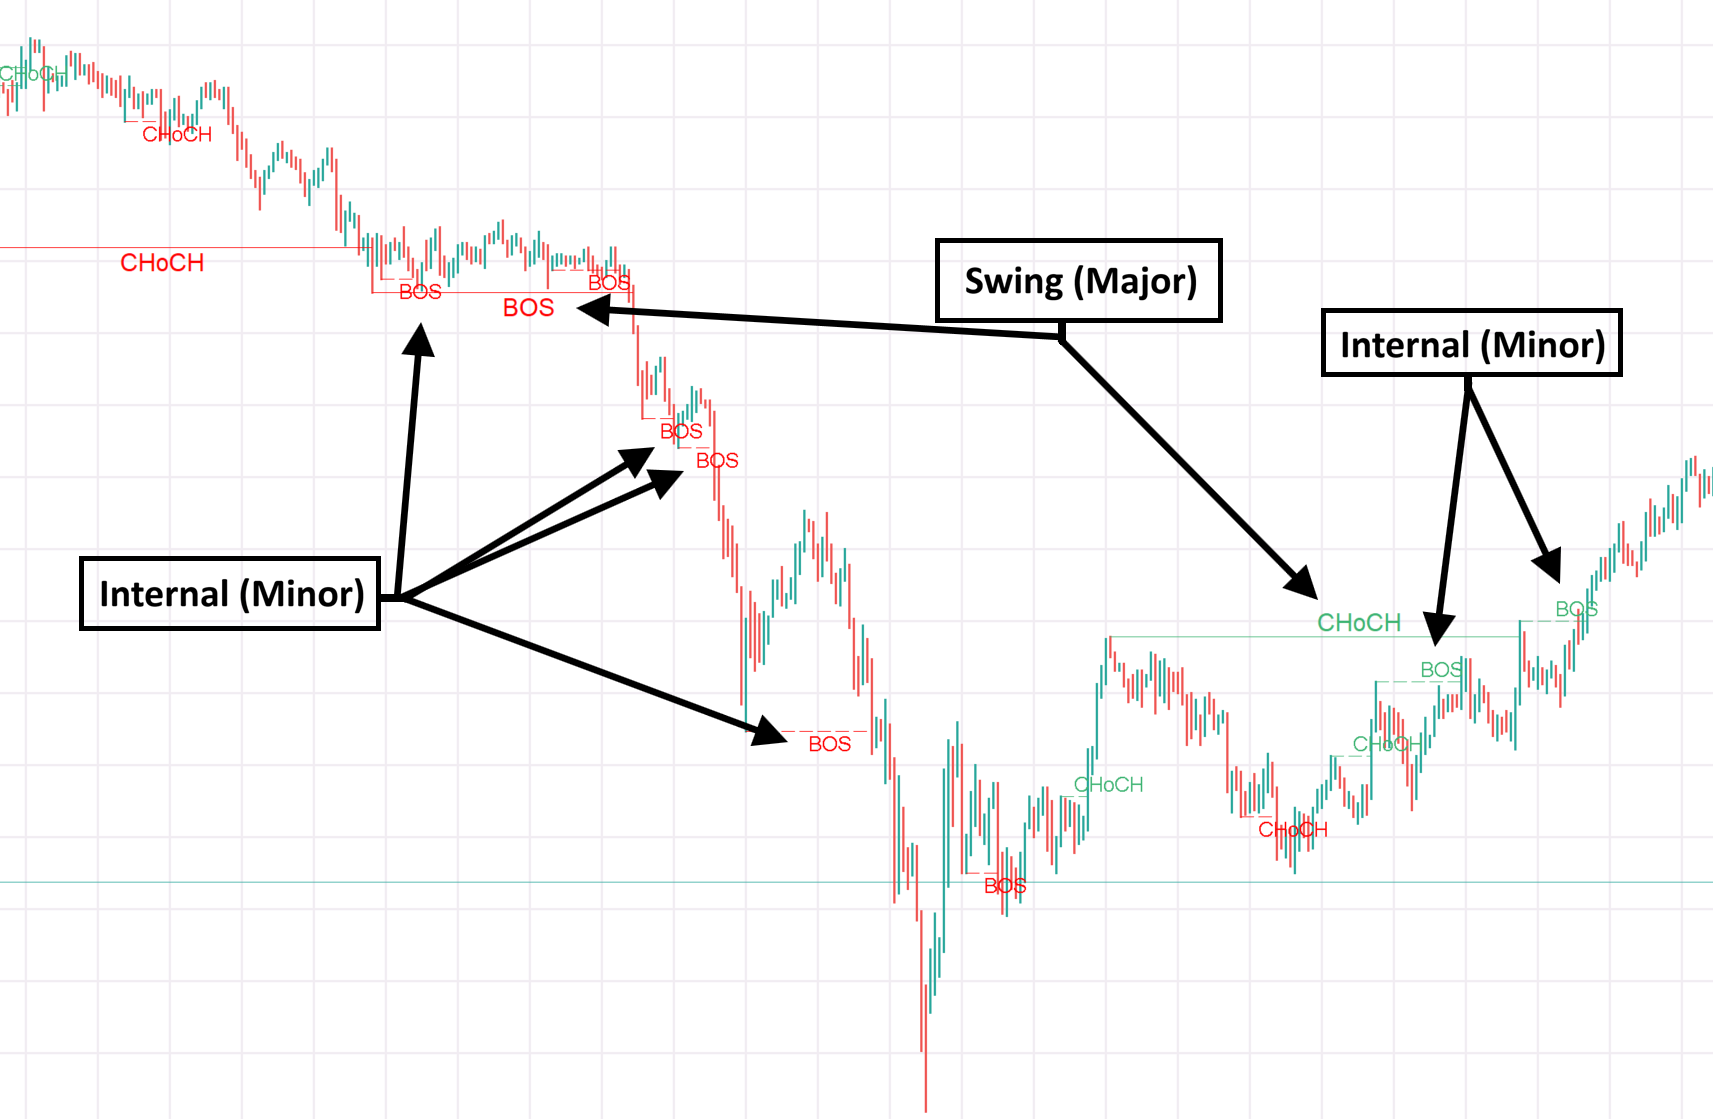
The indicator separates market structure into two distinct layers:
-
Swing Structure (Macro): Major, long-term structural highs and lows. This defines the overall market direction.
-
Internal Structure (Micro): Short-term, minor structure occurring inside the larger swing legs. This is used for early entries and lower-timeframe confirmations.
3. Order Blocks (OB)
-
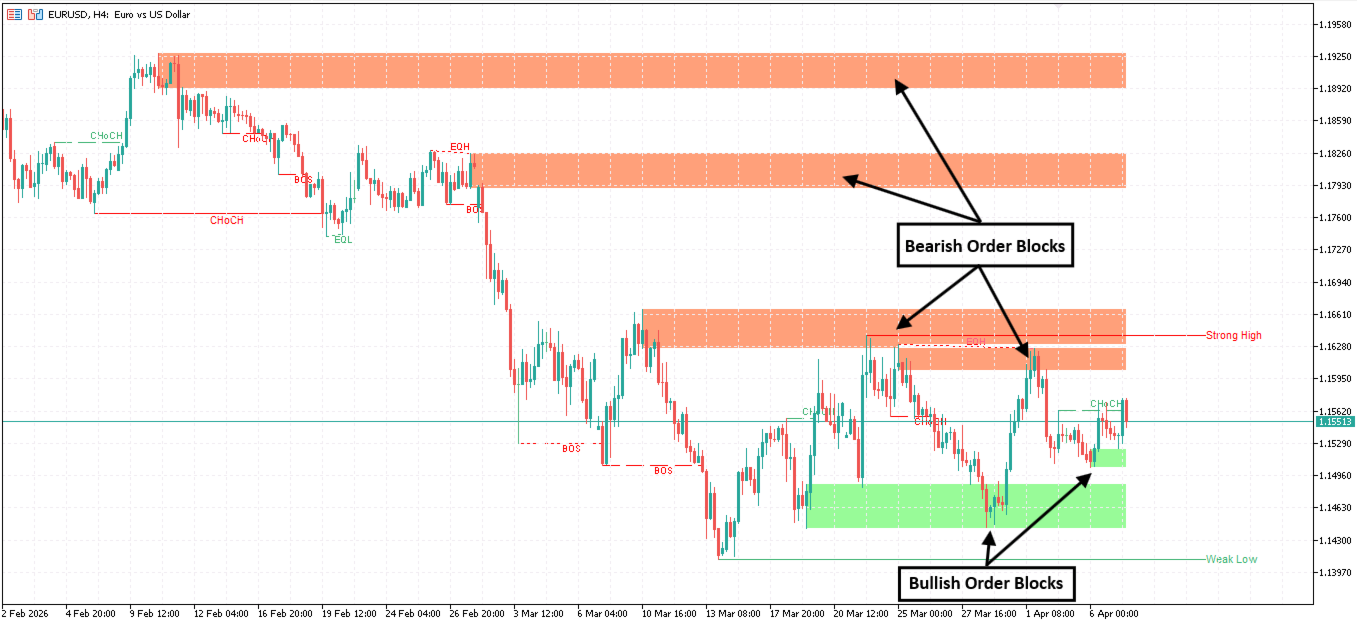
What it is: The specific zones where institutions heavily buy or sell, leaving behind a footprint of massive unfilled orders.
-
Bullish OB: The last down-close candle before a strong upward impulsive move.
-
Bearish OB: The last up-close candle before a strong downward impulsive move.
-
-
Trading Rule: Price often returns to mitigate (re-test) these blocks. Look for entry triggers when price taps into an active OB zone.
4. Fair Value Gaps (FVG)
-
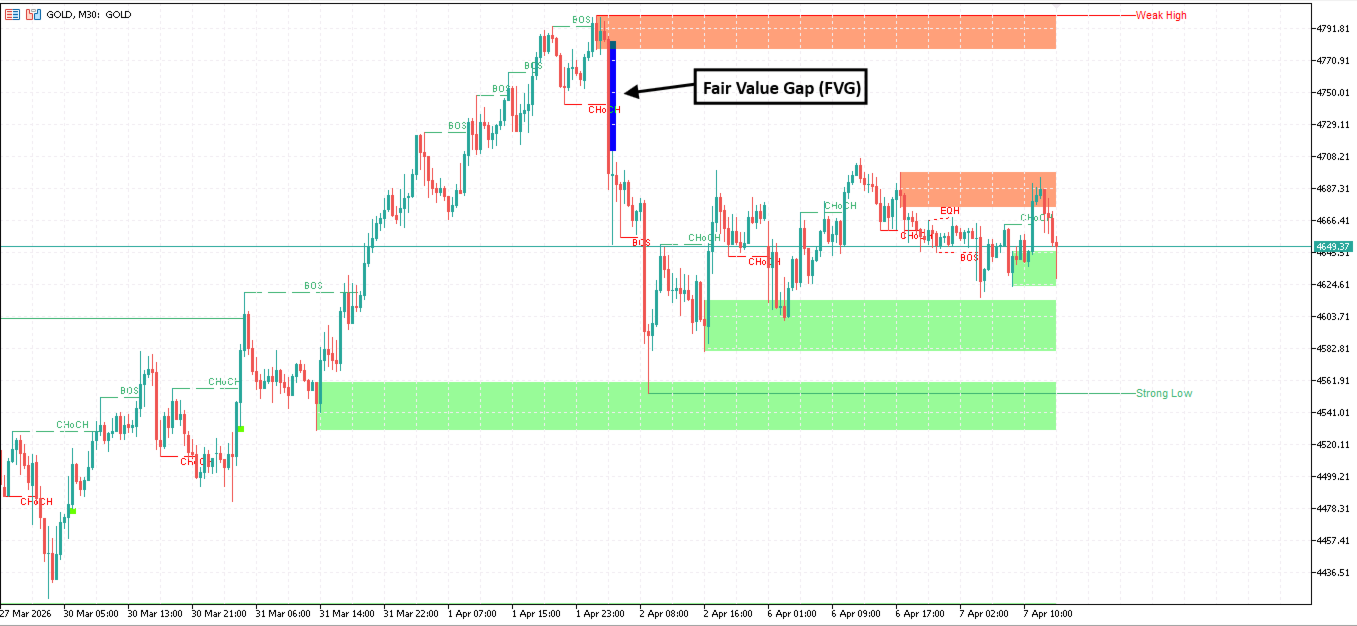
What it is: A 3-candle pattern representing an imbalance or inefficiency in price delivery. It occurs when a highly aggressive candle moves so quickly that the wicks of candle 1 and candle 3 do not overlap.
-
Trading Rule: Price acts like a magnet to these gaps, often returning to fill the imbalance before continuing its original direction.
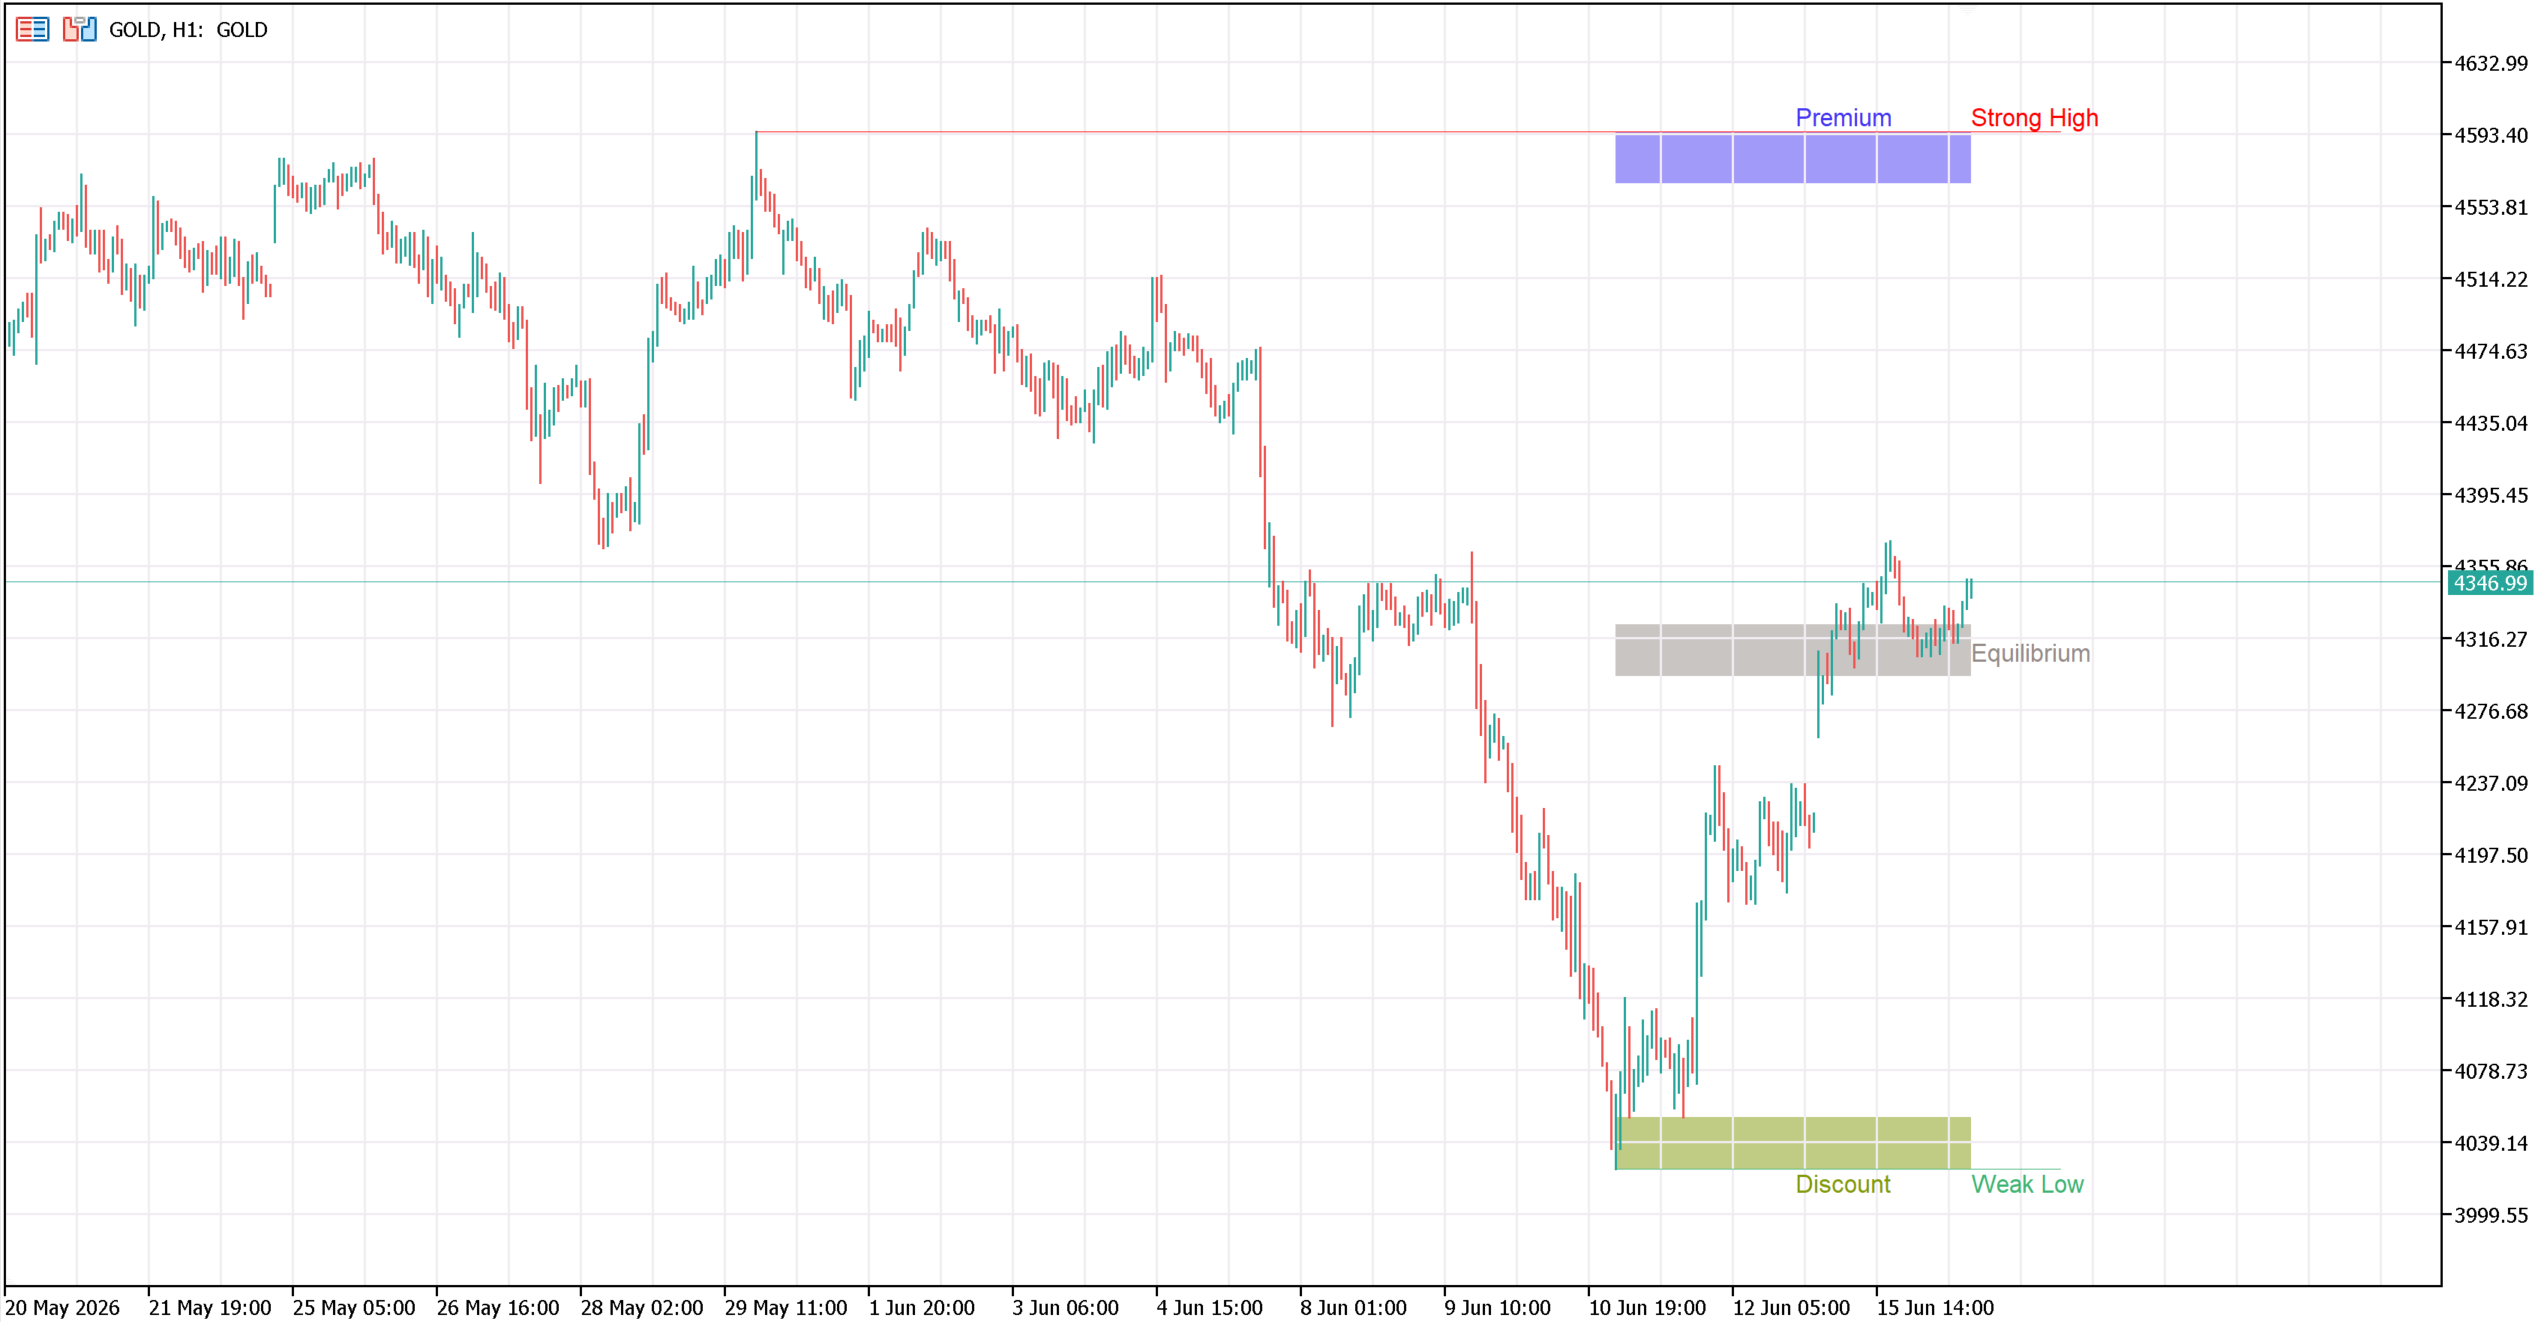
5. Premium / Discount Zones
-
What it is: A structural matrix that splits a trading range into three distinct zones based on equilibrium (the 50% level):
-
Premium Zone (Top 50%): Price is considered "expensive." Look only for short/sell setups here.
-
Equilibrium (50%): Fair market value.
-
Discount Zone (Bottom 50%): Price is considered "cheap." Look only for long/buy setups here.
Input Parameters & Tuning Sensitivity
This section breaks down how your configuration settings alter the indicator’s logic. Adjusting these values directly controls how strict or sensitive the indicator is.
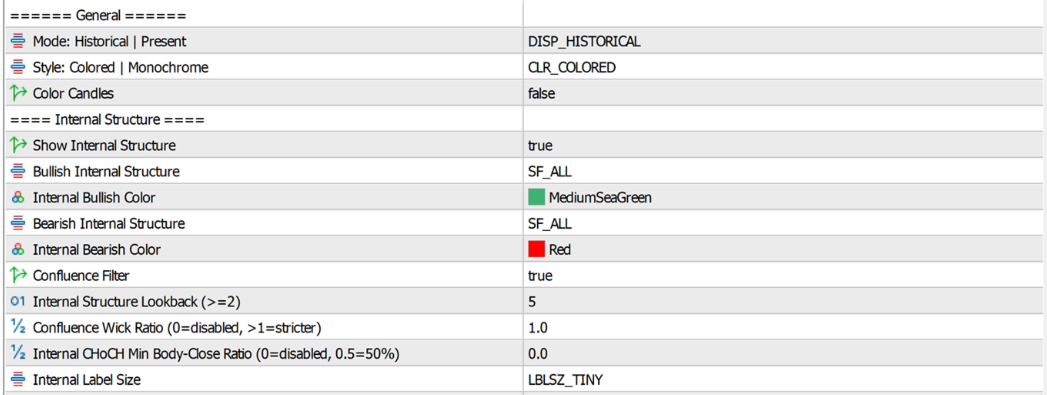
General & Internal Structure
-
Mode ( Historical | Present ): Controls whether past structural lines remain on the chart for backtesting ( DISP_HISTORICAL ) or delete themselves to keep the chart clean ( Present ).
-
Internal Structure Lookback ( Default: 5 ): Controls how many bars back the algorithm checks to identify internal structural points.
-
Lowering this value: Makes internal structure highly sensitive, rendering frequent CHoCH/BOS alerts (increases noise).
-
Increasing this value: Cleans up internal structure, showing only distinct micro-moves.
-
-
Confluence Wick Ratio : Filters out fakeouts caused by long, exhaustive wicks sweeping a structural level without genuine institutional backing. It measures the ratio of the candle's body size relative to its wicks during a break.
-
Set to 0.0 (Disabled) : Any break will be plotted regardless of how long the candle wicks are.
-
Set to 1.0 (Balanced) : Requires a healthy balance of candle body vs. wick.
-
Increase value ( > 1.0 ): Makes the filter stricter. The indicator will demand a much larger, solid candle body and significantly smaller wicks to validate the break.
-
-
Internal CHoCH Min Body-Close Ratio : Directly addresses the problem of weak trend reversals by forcing the indicator to calculate how much of the breakout candle's body actually closed beyond the prior structural level. This ensures true institutional displacement is present.
-
Set to 0.0 ( Disabled) : A standard close even 1 point beyond the level triggers an internal CHoCH.
-
Set to 0.5 (50%) : Requires aggressive displacement. The breakout candle must close such that at least 50% of its entire body length sits clearly past the prior swing point before validating the change of character.
-
How it affects your trading: Increasing this parameter heavily filters out market noise and minor liquidity sweeps, ensuring you only catch moves where institutions are aggressively pushing price to shift the trend.
-
Swing Structure
-
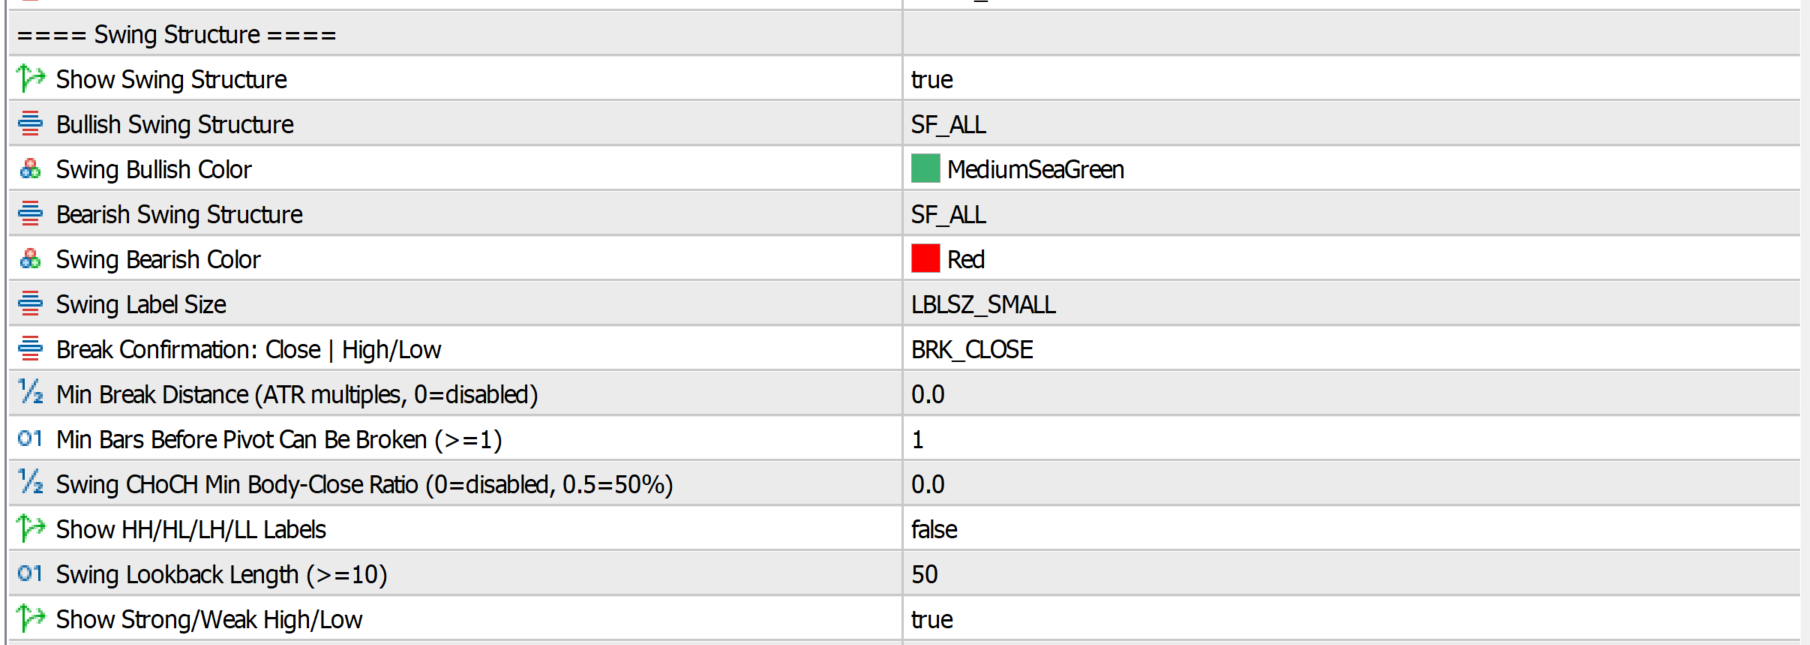
Break Confirmation ( BRK_CLOSE ): Determines when a BOS or CHoCH is validated. BRK_CLOSE requires the candle body to close past the line, which is highly reliable. Changing this to high/low makes the indicator aggressively trigger breaks on a simple wick sweep.
-
Swing Lookback Length ( Default: 50 ): The core sensitivity engine for your macro trend.
-
Lowering this value (e.g., 20-30): Identifies shorter-term swings. The chart will display more frequent, smaller structural ranges.
-
Increasing this value (e.g., 50-100): Identifies major, long-term structural legs. Ideal for higher timeframe macro analysis.
-
-
Min Bars Before Pivot Can Be Broken ( Default: 1 ): Prevents immediate, invalid breaks by requiring a set number of bars to form before a structural level can be legally breached by the algorithm.
-
Swing CHoCH Min Body-Close Ratio : Directly addresses the problem of weak trend reversals by forcing the indicator to calculate how much of the breakout candle's body actually closed beyond the prior structural level. This ensures true institutional displacement is present.
-
Set to 0.0 ( Disabled) : A standard close even 1 point beyond the level triggers an internal CHoCH.
-
Set to 0.5 (50%) : Requires aggressive displacement. The breakout candle must close such that at least 50% of its entire body length sits clearly past the prior swing point before validating the change of character.
-
How it affects your trading: Increasing this parameter heavily filters out market noise and minor liquidity sweeps, ensuring you only catch moves where institutions are aggressively pushing price to shift the trend.
-
Order Blocks (OB) & MTF Settings
-
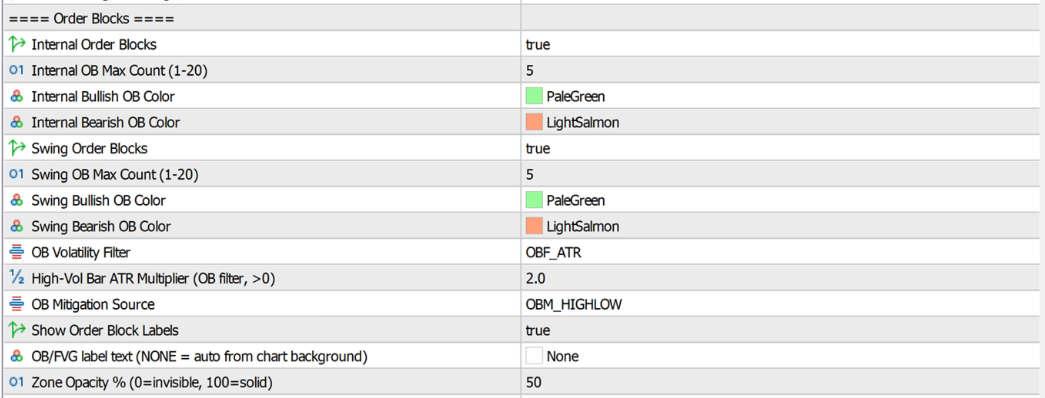
Internal / Swing OB Max Count ( Default: 5 ): The maximum number of active order blocks kept visible on the chart at one time. Keeps the screen uncluttered.
-
OB Volatility Filter ( OBF_ATR ) & Multiplier ( 2.0 ): Filters out small, irrelevant candles. By requiring an ATR multiplier of 2.0, the indicator only highlights Order Blocks that initiated massive, high-volume explosive moves.
-
OB Mitigation Source ( OBM_HIGHLOW ): Dictates when an Order Block is deactivated. OBM_HIGHLOW means an OB zone is considered "invalidated" or completely mitigated the moment price action sweeps through its boundary highs or lows.
-
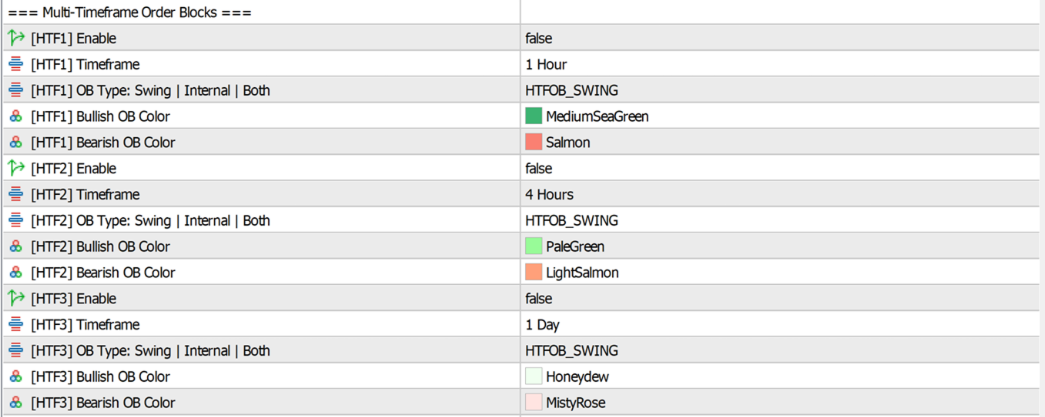
Multi-Timeframe [HTF1 / HTF2 / HTF3] Blocks: Allows you to overlay up to 3 higher-timeframe order blocks of your choice onto your current lower-timeframe chart. Essential for high-confluence trading (e.g., executing a trade on a 5 Min chart inside a 15 Min HTF Order Block).
Liquidity, FVGs & HTF Levels
-
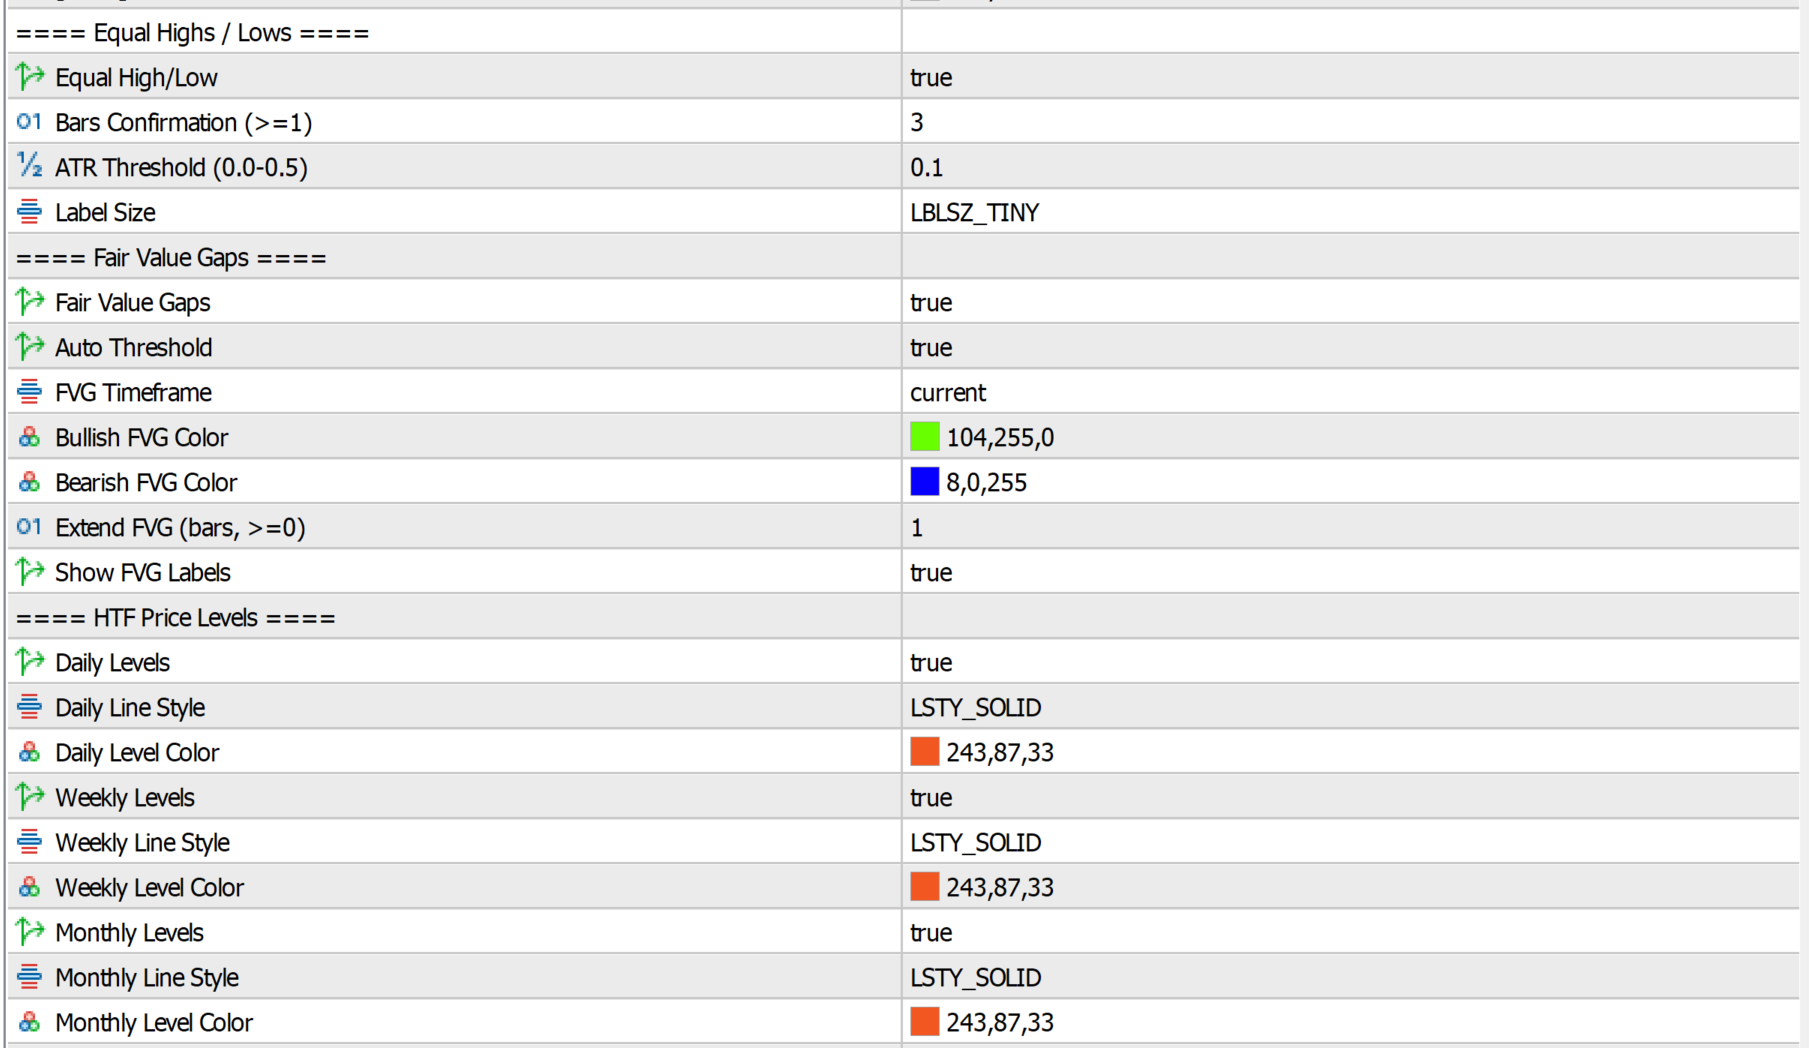
Equal High/Low Bars Confirmation ( Default: 3 ): Dictates how many candles must form close to the same price level to map retail liquidity pools (Double Tops/Bottoms).
-
Fair Value Gaps Auto Threshold ( True ): Automatically scales the required size of an FVG based on current market volatility so that tiny, irrelevant price gaps are ignored during low-volume periods.
-
HTF Price Levels (Daily, Weekly, Monthly): Automatically plots hard horizontal lines for the opening/extremes of Daily, Weekly, and Monthly cycles. These act as major institutional support and resistance checkpoints.
🚀 Supporting the Project & Community
This indicator was built out of a passion for algorithmic trading and is provided completely free of charge to help the trading community trade with institutional clarity without the heavy price tag.
If this tool has brought value to your daily charts, you can support the project in two ways:
-
Leave a Review: High ratings and detailed reviews help the indicator gain visibility and keep development alive. It only takes a minute but helps immensely!
-
Share the Wealth: Pass this tool along to fellow traders who are looking to master Smart Money Concepts.
Official Product Links
Get the latest official updates, ask questions, or leave your feedback directly on the product pages:
-
👉 Download for MetaTrader 4 (MT4): https://www.mql5.com/en/market/product/172221?source=Site+Market+MT4+Indicator+Rating006
-
👉 Download for MetaTrader 5 (MT5): https://www.mql5.com/en/market/product/172117?source=Site+Market+MT5+Indicator+Rating006
-
👉 Visit the Developer's MQL5 Profile: https://www.mql5.com/en/users/shadowlim/seller
⚠️ Important Reminder: To ensure your safety and receive legitimate version updates, please only download this indicator through the official MQL5 Market links provided above. Safe trading!




