")
Momentum Tidebreaker Indicator -- Complete User Manual (MT4 & MT5)

Introduction
The Momentum Tidebreaker indicator is a non-repainting three-class momentum confluence system for MetaTrader 4 and MetaTrader 5. It evaluates each closed bar against three independent momentum signal classes (Trend Cross, RSI Reclaim, and Divergence) and fires a BUY or SELL signal when any class matches. When two classes agree on the same bar, a Strong Signal is recorded. Every signal automatically draws Entry, Stop Loss, TP1, and TP2 lines on the chart with full hit-detection and Wins/Losses/Win-Rate tracking via a 16-row dashboard.
Key Features:
- Three signal classes: Trend Cross, RSI Reclaim, Divergence, plus Strong Signal combo flag
- Non-repainting: signals confirmed on bar close, never moved or removed afterwards
- ATR-anchored TP/SL: Entry, SL, TP1 at 1R, and TP2 at configurable Risk:Reward ratio
- 16-row dashboard with corner switching (Top Right, Top Left, Bottom Right, Bottom Left)
- Automatic Wins/Losses/Win-Rate tracking after every closed trade
- Live floating P&L in points and percent, plus partial-profit flag at TP1
- 9 alert conditions across 4 channels (popup, sound, push, email)
- Support/Resistance level detection with pivot points, displayed as dashed lines and as point-distance in the dashboard
- History scan on chart load to populate active trade plus historical W/L
- Symbol and timeframe agnostic
Download the indicator:
- MetaTrader 5: Momentum Tidebreaker MT5
- MetaTrader 4: Momentum Tidebreaker MT4
TIP: This indicator is designed for traders who want a rules-based approach to momentum trading with built-in risk management. It works on any symbol and any timeframe.
Understanding Three-Class Confluence
Most retail momentum indicators have a single trigger. Momentum Tidebreaker has three independent signal classes that fire on different market structures.
How signals are generated:
- On every confirmed (closed) bar, the indicator evaluates three signal classes:
- Trend Cross: fast EMA crosses slow EMA + RSI on the matching side of 50 + momentum direction agrees + trend strength above threshold
- RSI Reclaim: RSI crosses 50 in the direction of the existing EMA trend + close on trend side of slow EMA
- Divergence: RSI divergence at OB/OS + close crosses back across fast EMA
- If any class matches, a BUY or SELL signal fires (one per direction per bar)
- If the Trend Cross and Divergence classes match on the same bar, a Strong Signal is recorded
- The signal triangle, divergence diamond (if applicable), and Strong Signal star marker are drawn on the chart
- The four-line risk architecture (Entry, SL, TP1, TP2) is drawn extending forward 30 bars
- Alerts fire on the configured channels
NOTE: Because all three classes evaluate only on confirmed bars, there is a one-bar delay between when an intraday condition first becomes true and when the indicator prints the signal. This is what makes signals non-repainting -- they will not disappear on later ticks.
Installation Guide
Momentum Tidebreaker is distributed through the MQL5.com Market. Installation is automatic.
Steps:
- Purchase the indicator from the MQL5 Market product page
- The indicator installs automatically into your MetaTrader terminal
- Open MetaTrader and press Ctrl+N to open the Navigator panel
- Expand Indicators > Market
- Locate Momentum_Tidebreaker in the list
- Drag the indicator onto any chart
- The settings dialog appears -- adjust parameters as needed (see sections below)
- Click OK to apply
After loading, you will see:
- Fast EMA and Slow EMA lines drawn on the chart with bull/bear coloring
- BUY / SELL triangle markers at signal points (below bars for longs, above for shorts)
- Strong Signal star markers (amber) on top of triangles when both Trend Cross and Divergence fire on the same bar
- Divergence diamonds at bars where RSI divergence is detected (visual marker, not necessarily a tradeable signal)
- TP/SL lines drawn as four horizontal lines extending forward 30 bars
- 16-row dashboard panel in your chosen corner
IMPORTANT: Do not manually copy files to the data folder. The MQL5 Market handles all file placement and updates automatically.
Signal System Overview
Each signal consists of two visual components on the chart:
1. Signal Triangle
- BUY signals display a teal/aqua upward triangle below the signal bar
- SELL signals display a coral/red downward triangle above the signal bar
- Triangles appear only on confirmed (closed) bars
2. Strong Signal Star (optional)
When the same bar produces both a Trend Cross signal and a Divergence signal:
- An additional amber star marker prints on top of the triangle
- A separate STRONG BUY or STRONG SELL alert fires alongside the standard alert
Non-Repainting Confirmation:
- All three signal classes evaluate only on closed bars
- Once a triangle, star, or divergence diamond appears, it is permanent
- A duplicate-suppression mechanism prevents the same direction from firing twice on the same bar even if multiple classes match
History Scan:
On chart load (or symbol/timeframe switch), the indicator walks backward up to InpHistoryScanBars bars (default 500) replaying every closed bar to detect historical signals, simulate TP/SL fills, and populate the Wins/Losses/Win-Rate counter. This is why a newly attached chart shows an active trade (if any) and historical W/L immediately.
Trend Settings
These parameters control the EMA crossover detection and trend strength.
| Parameter | Default | Description |
|---|---|---|
| InpEmaFastLen | 12 | Period for the fast EMA |
| InpEmaSlowLen | 26 | Period for the slow EMA |
| InpTrendStrengthLen | 14 | ATR period used for trend strength normalization |
Visual behavior:
- The fast EMA and slow EMA are drawn on the chart with separate buffers for bull and bear color states
- When trend direction flips (fast crosses slow), the line color changes accordingly with no gap at the transition bar (handled via a bridge buffer write)
TIP: Classical values are 12/26 (MACD-style). Some traders prefer 20/50 for more conservative crossovers, or 9/21 for more aggressive scalping.
Momentum and Signal Settings
These parameters control RSI, momentum, and the three signal classes.
RSI
| Parameter | Default | Description |
|---|---|---|
| InpRsiLength | 14 | RSI calculation period |
| InpOversoldLevel | 30 | Oversold threshold |
| InpOverboughtLevel | 70 | Overbought threshold |
Logic: RSI is used in all three signal classes. Trend Cross requires RSI on the correct side of 50. RSI Reclaim fires when RSI crosses 50. Divergence requires RSI to be in OB or OS territory.
Signal Class Toggles
| Parameter | Default | Description |
|---|---|---|
| InpEnableTrendCross | true | Enable the Trend Cross class |
| InpEnableRSIReclaim | true | Enable the RSI Reclaim class |
| InpEnableDivergence | true | Enable the Divergence class |
| InpRequireMomConfluence | true | Require momentum direction agreement on Trend Cross |
Logic:
- Trend Cross: fires when fast EMA crosses slow EMA, RSI is on the matching side of 50, momentum agrees (if InpRequireMomConfluence is true), and trend strength exceeds the threshold.
- RSI Reclaim: fires when RSI crosses 50 in the direction of the existing EMA trend, with the close on the trend side of the slow EMA.
- Divergence: fires when RSI bullish divergence is detected at oversold (or bearish at overbought) AND the close subsequently crosses back over the fast EMA.
TIP: Disable InpRequireMomConfluence for earlier Trend Cross entries at the cost of more false positives. Best used on D1 / W1 timeframes where the few extra noisy signals are tolerable.
Complete Parameter Reference
The following table lists all input parameters in the order they appear in the indicator settings dialog.
| # | Parameter | Type | Default | Category |
|---|---|---|---|---|
| 1 | InpEmaFastLen | int | 12 | Trend |
| 2 | InpEmaSlowLen | int | 26 | Trend |
| 3 | InpTrendStrengthLen | int | 14 | Trend |
| 4 | InpPivotLength | int | 10 | Support & Resistance |
| 5 | InpMaxLevels | int | 3 | Support & Resistance |
| 6 | InpShowSRLevels | bool | true | Support & Resistance |
| 7 | InpRsiLength | int | 14 | Momentum |
| 8 | InpOversoldLevel | int | 30 | Momentum |
| 9 | InpOverboughtLevel | int | 70 | Momentum |
| 10 | InpEnableTrendCross | bool | true | Signals |
| 11 | InpEnableRSIReclaim | bool | true | Signals |
| 12 | InpEnableDivergence | bool | true | Signals |
| 13 | InpRequireMomConfluence | bool | true | Signals |
| 14 | InpShowSLTP | bool | true | Risk Management |
| 15 | InpAtrLenRisk | int | 14 | Risk Management |
| 16 | InpSLPadding | double | 1.5 | Risk Management |
| 17 | InpRRRatio | double | 2.0 | Risk Management |
| 18 | InpLineExtend | int | 30 | Risk Management |
| 19 | InpBullColor | color | clrTurquoise | Visual |
| 20 | InpBearColor | color | clrTomato | Visual |
| 21 | InpNeutralColor | color | clrSilver | Visual |
| 22 | InpSignalArrowSize | int | 3 | Visual |
| 23 | InpShowDashboard | bool | true | Dashboard |
| 24 | InpDashCorner | enum | DASH_TOP_RIGHT | Dashboard |
| 25 | InpDashFontSize | int | 10 | Dashboard |
| 26 | InpDashHOffset | int | 10 | Dashboard |
| 27 | InpDashVOffset | int | 24 | Dashboard |
| 28 | InpEnableAlerts | bool | true | Alerts |
| 29 | InpAlertPopup | bool | true | Alerts |
| 30 | InpAlertPush | bool | false | Alerts |
| 31 | InpAlertEmail | bool | false | Alerts |
| 32 | InpAlertSound | bool | true | Alerts |
| 33 | InpSoundFile | string | alert.wav | Alerts |
| 34 | InpHistoryScanBars | int | 500 | History |
Risk Management Setup
Momentum Tidebreaker calculates Stop Loss and two Take Profit levels automatically for each signal.
Stop Loss Calculation
| Parameter | Default | Description |
|---|---|---|
| InpAtrLenRisk | 14 | ATR calculation period |
| InpSLPadding | 1.5 | Stop loss distance as ATR multiplier |
For BUY signals: SL = Entry - (ATR x InpSLPadding) For SELL signals: SL = Entry + (ATR x InpSLPadding)
The ATR-based stop adapts automatically to each instrument's volatility. A pair like GBPJPY with wide ranges gets a wider absolute stop than EURGBP with narrow ranges, but the relative risk in ATR units stays constant.
Take Profit Levels
| Parameter | Default | Description |
|---|---|---|
| InpRRRatio | 2.0 | TP2 Risk:Reward ratio |
| (Built-in) | 1.0 | TP1 is always at 1R |
The "risk" in the risk-reward calculation is the distance from entry to SL. With default settings:
- TP1 (1R) = same distance as SL, in the profit direction. Hitting TP1 marks a partial-profit flag in the dashboard but does not close the trade.
- TP2 (RR ratio) = SL distance multiplied by the RR ratio (default 2.0, so 2R). Hitting TP2 closes the trade in profit and increments Wins.
Display Toggles
| Parameter | Default | Description |
|---|---|---|
| InpShowSLTP | true | Master toggle for TP/SL line drawing |
| InpLineExtend | 30 | Bars the TP/SL lines extend forward |
Hit Tracking
The indicator automatically tracks whether each TP level and the SL have been reached by subsequent price action:
- When price reaches TP1, the TP1 line dims (its color is changed to grey), a checkmark appears next to the TP1/TP2 row on the dashboard, and the TP1 Hit alert fires (once)
- When price reaches TP2, all four lines (Entry, SL, TP1, TP2) are deleted from the chart, the dashboard's Active Trade section reverts to "-" for direction, Wins increments by 1, and the TP2 Hit alert fires
- When price reaches SL, the same cleanup happens, Losses increments by 1, and the SL Hit alert fires
- The dashboard's W/L/WR row updates after every closed trade
Dashboard Guide
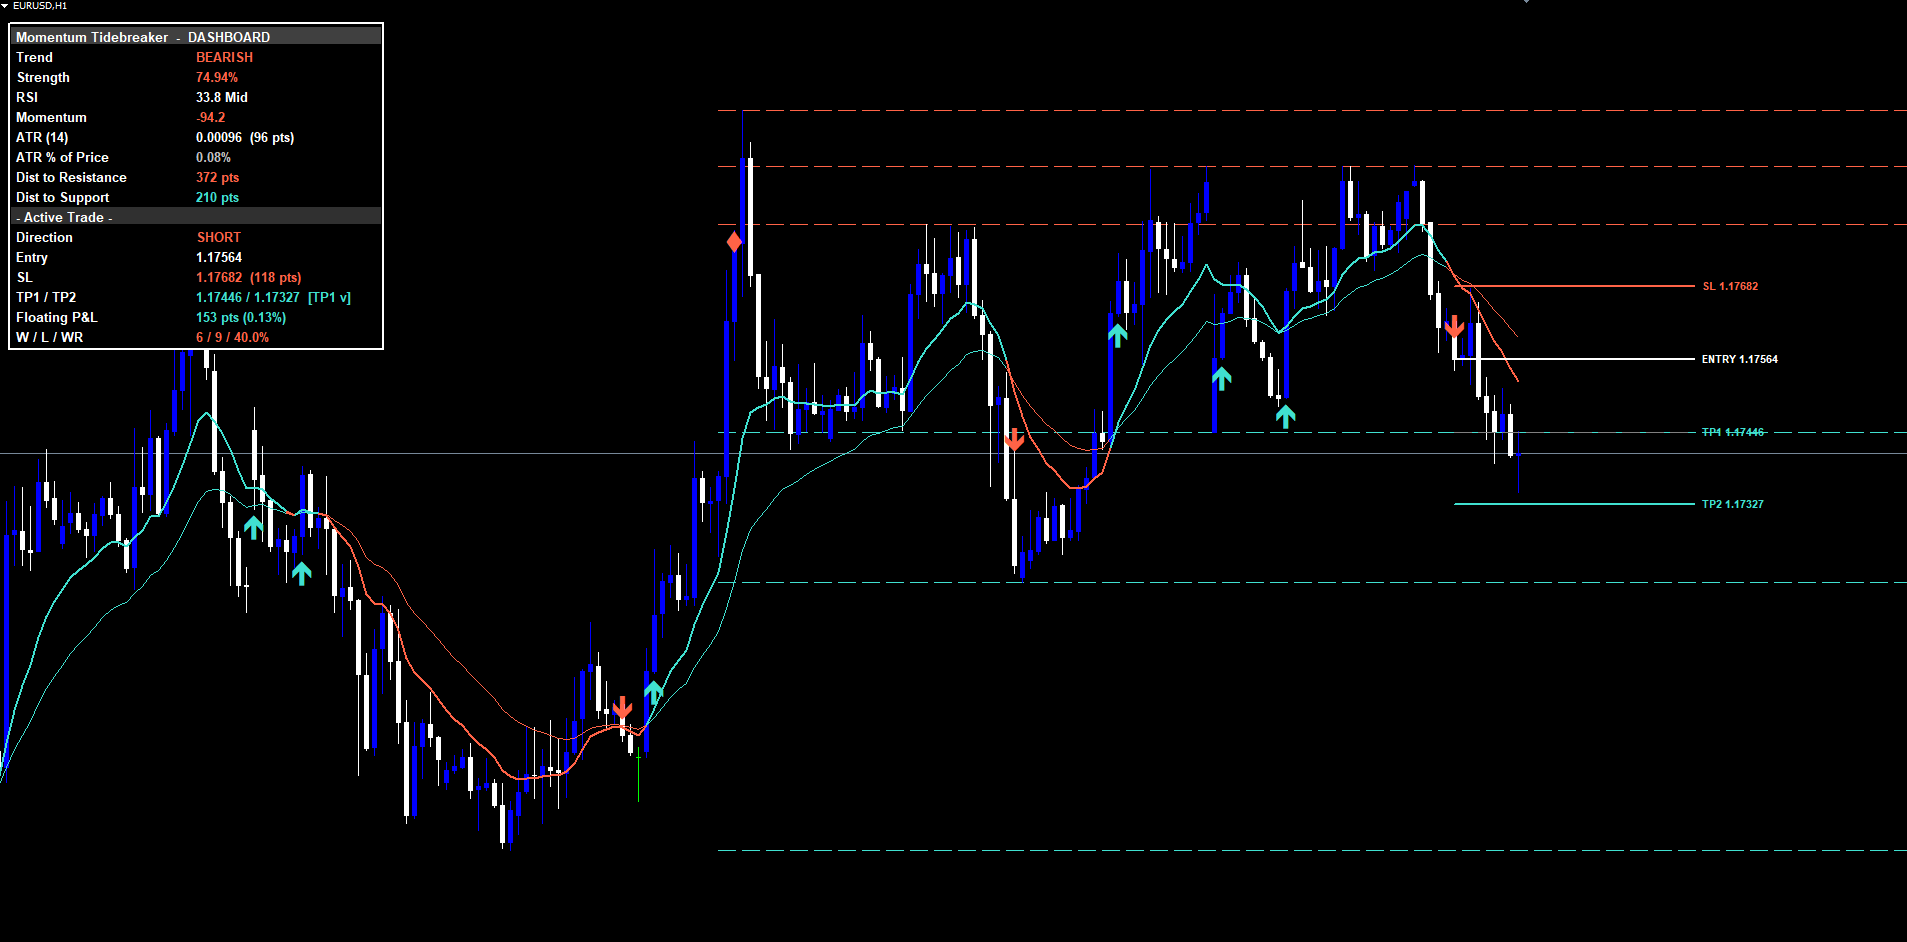
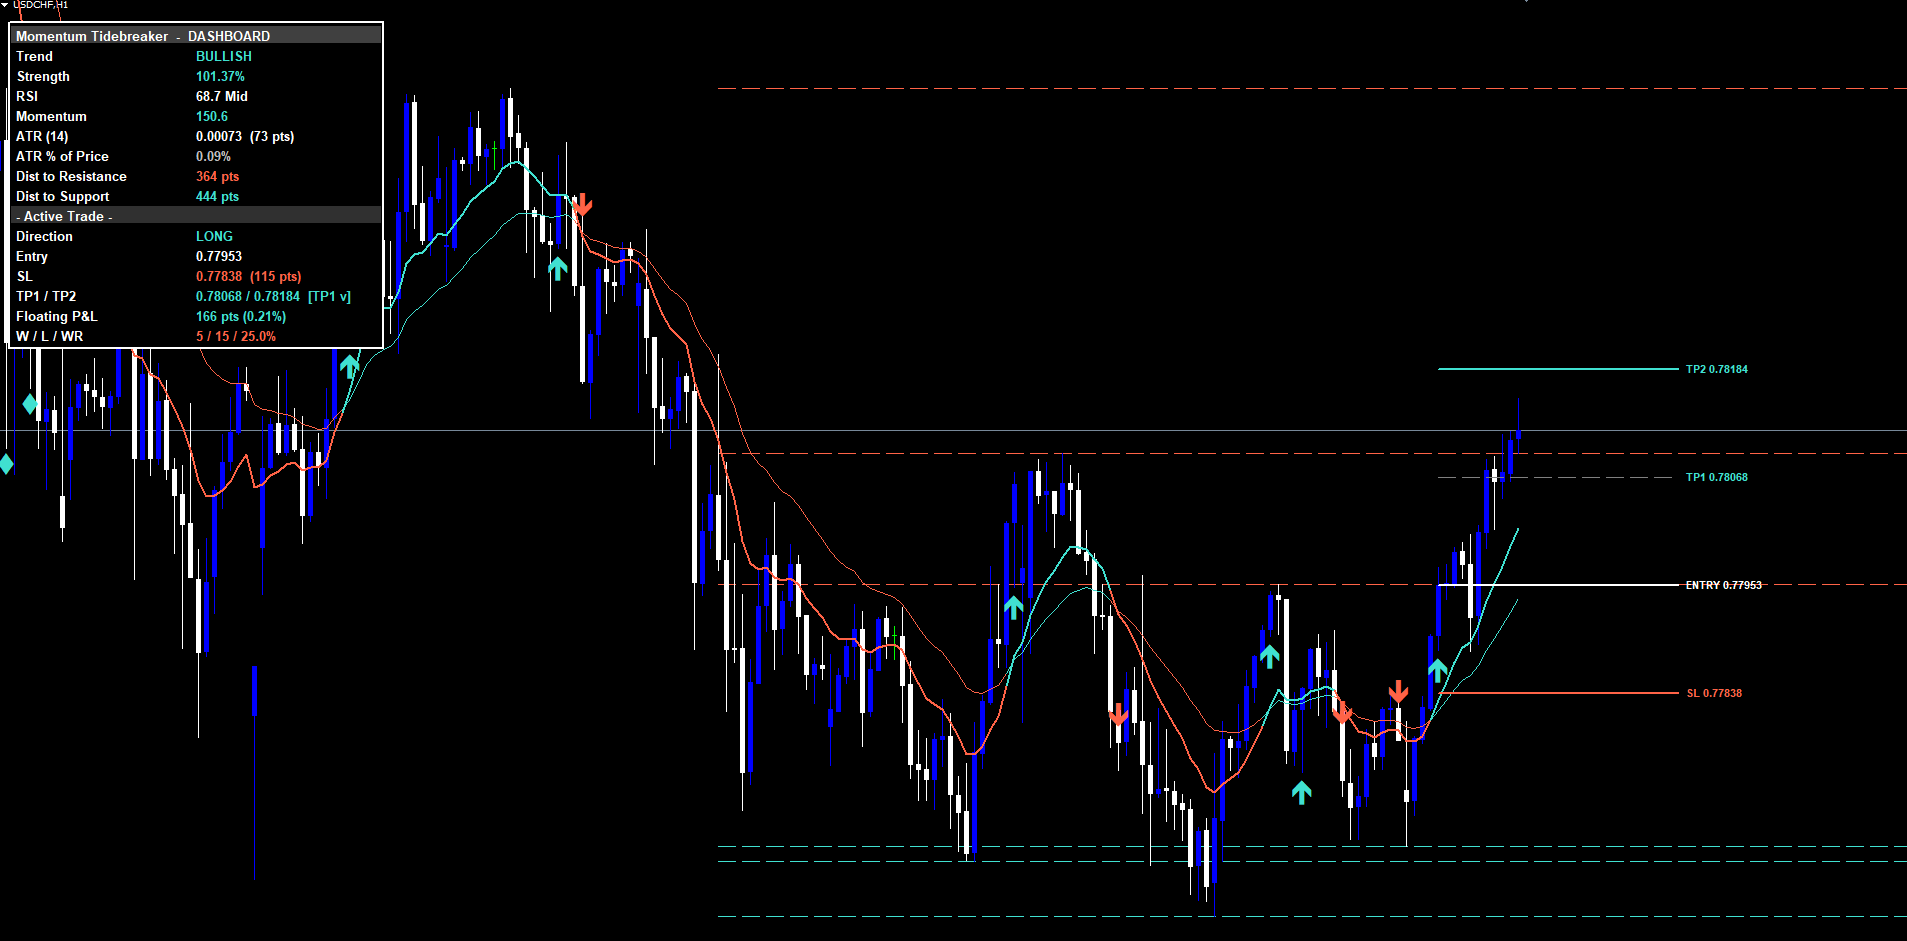
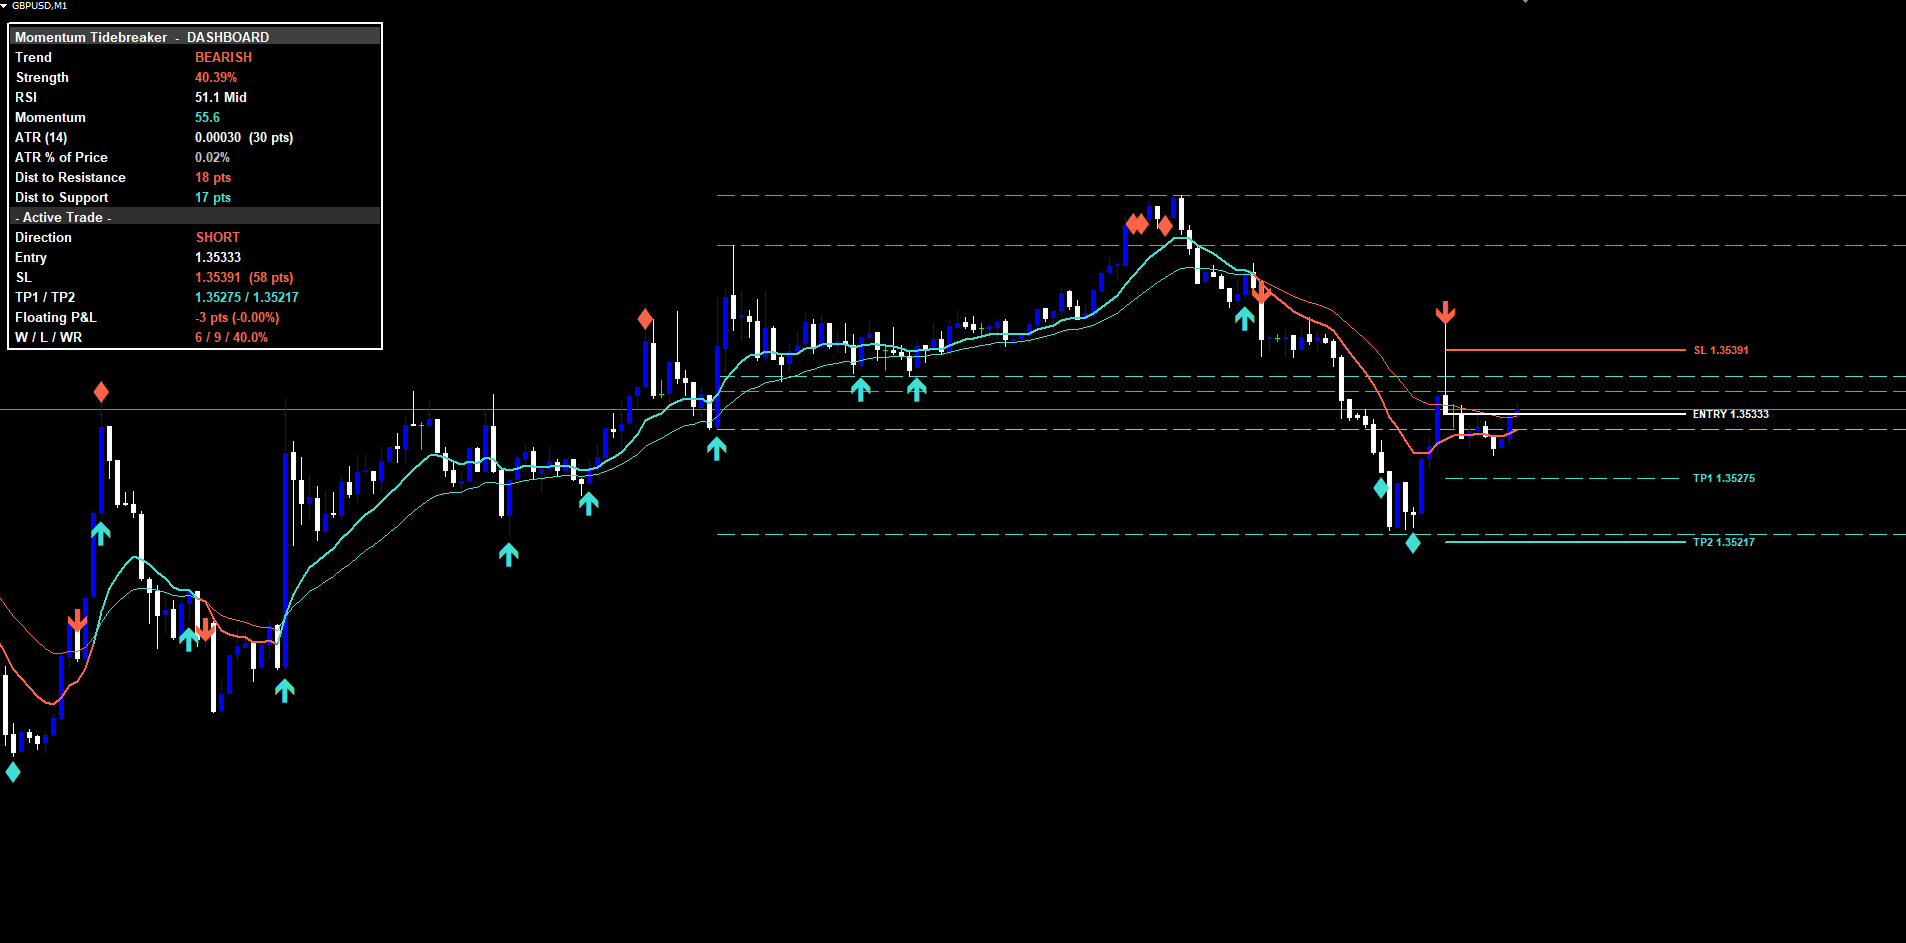
The on-chart dashboard provides a compact, real-time summary of indicator state. It is organized into a header, a Market Snapshot section, and an Active Trade section.
Dashboard Settings:
| Parameter | Default | Description |
|---|---|---|
| InpShowDashboard | true | Show or hide the dashboard |
| InpDashCorner | DASH_TOP_RIGHT | Which corner of the chart to anchor to |
| InpDashFontSize | 10 | Font size in pixels |
| InpDashHOffset | 10 | Horizontal offset from the chosen corner |
| InpDashVOffset | 24 | Vertical offset from the chosen corner |
The dashboard corner can be set to any of the four chart corners via a dropdown: Top Right (default), Top Left, Bottom Right, or Bottom Left. The widget is always anchored to CORNER_LEFT_UPPER internally; the visible position is computed from chart pixel dimensions, so the panel never extends off-screen.
Header
A single full-width cell displays "Momentum Tidebreaker - DASHBOARD" on a lighter grey background.
Market Snapshot Section
| Row | Label | Description |
|---|---|---|
| 1 | Trend | BULLISH / BEARISH / FLAT, colored by direction |
| 2 | Strength | EMA distance divided by ATR (percent), colored when above 1% |
| 3 | RSI | Current RSI reading with OB / OS / Mid state marker |
| 4 | Momentum | 5-bar close change normalized by ATR(10), times 100 |
| 5 | ATR (14) | Absolute ATR + equivalent point count |
| 6 | ATR % of Price | Volatility regime gauge |
| 7 | Dist to Resistance | Distance in points to the nearest above-price pivot high |
| 8 | Dist to Support | Distance in points to the nearest below-price pivot low |
Active Trade Section
| Row | Label | Description |
|---|---|---|
| 9 | (Divider) | "- Active Trade -" on a darker grey background |
| 10 | Direction | LONG / SHORT / - colored by direction |
| 11 | Entry | Entry price of the active trade |
| 12 | SL | Stop loss price + distance in points |
| 13 | TP1 / TP2 | Both target prices, with partial-profit flag appended after TP1 hit |
| 14 | Floating P&L | Live unrealized P&L in points and percent |
| 15 | W / L / WR | Wins / Losses / Win-Rate% |
TIP: If the dashboard overlaps with price action, change InpDashCorner to a different corner or adjust the H/V offsets. The font is bold by default to ensure readability against dark chart backgrounds.
Alert Configuration
Momentum Tidebreaker supports four delivery channels and nine alert events.
Alert Channels
| Parameter | Default | Description |
|---|---|---|
| InpEnableAlerts | true | Master switch for all alerts |
| InpAlertPopup | true | In-terminal popup dialog |
| InpAlertSound | true | Play the configured sound file |
| InpAlertPush | false | Mobile push notification (requires MetaQuotes ID) |
| InpAlertEmail | false | Email alert (requires SMTP configuration) |
| InpSoundFile | alert.wav | Sound file to play |
Alert Events
The indicator fires alerts for nine events, each once per bar:
| Alert Event | Trigger |
|---|---|
| BUY | Any signal class fires long |
| SELL | Any signal class fires short |
| STRONG BUY | Trend Cross + Divergence both long on same bar |
| STRONG SELL | Trend Cross + Divergence both short on same bar |
| TP1 Hit | First take profit reached |
| TP2 Hit | Second take profit reached (trade closes) |
| SL Hit | Stop loss reached (trade closes) |
| Bullish Divergence | RSI bullish divergence detected at oversold |
| Bearish Divergence | RSI bearish divergence detected at overbought |
Each alert message includes the symbol, timeframe, and (for entry alerts) the entry price.
Enabling Push Notifications
- Install the MetaTrader mobile app (iOS or Android)
- Open the app and navigate to Settings > Messages
- Copy your MetaQuotes ID
- In the desktop MetaTrader, go to Tools > Options > Notifications
- Enter your MetaQuotes ID and enable notifications
- Set InpAlertPush = true in the indicator settings
Enabling Email Notifications
- In MetaTrader, go to Tools > Options > Email
- Check Enable
- Enter your SMTP server, port, login, password, and destination email
- Click Test to verify
- Set InpAlertEmail = true in the indicator settings
Trading Strategies
The following approaches demonstrate different ways to use Momentum Tidebreaker. All strategies assume default settings unless stated otherwise.
WARNING: Trading involves significant risk. These strategies are provided for educational purposes only. Always test on a demo account first and never trade with money you cannot afford to lose.
Strategy A: Scalping (M5 - M15)
Recommended adjustments:
- Disable Divergence class to reduce signal noise on lower timeframes
- Reduce InpSLPadding to 1.0 for tighter stops
- Set InpRRRatio to 1.5 for faster profit-taking
- Enable InpAlertSound and InpAlertPopup for desktop awareness
Trade management:
- Wait for a BUY or SELL signal with at least the Strong flag preferred
- Enter at market on the next bar's open after the signal
- Take 50% of position off at TP1 (which is 1R)
- Move broker SL to entry once TP1 hits
- Let the remaining 50% run to TP2 (1.5R)
Strategy B: Swing Trading (H1 - H4)
Use defaults: All three signal classes enabled, momentum confluence required, SL at 1.5 ATR, TP2 at 2.0R.
Trade management:
- Wait for any class signal
- Enter at market on the next bar's open
- Take 1/3 of position off at TP1
- Move broker SL to entry after TP1
- Take another 1/3 at TP2
- If trailing, leave the final 1/3 to run with a trailing stop
Strategy C: Alert-Based Multi-Chart
Setup:
- Apply the indicator to all symbols and timeframes of interest
- Enable InpAlertPush and configure your MetaQuotes ID
- Open the relevant chart only when a push notification arrives
- Review the dashboard before deciding whether to enter
TIP: For Strategy C, consider disabling the RSI Reclaim class on charts where you only want major entries -- this reduces notification volume while preserving the most structural signals.
Parameter Tuning Presets
Scalping Preset (M5 - M15)
| Parameter | Value |
|---|---|
| InpEnableTrendCross | true |
| InpEnableRSIReclaim | true |
| InpEnableDivergence | false |
| InpRequireMomConfluence | true |
| InpSLPadding | 1.0 |
| InpRRRatio | 1.5 |
| InpLineExtend | 20 |
| InpHistoryScanBars | 300 |
Swing Trading Preset (H1 - H4)
| Parameter | Value |
|---|---|
| InpEnableTrendCross | true |
| InpEnableRSIReclaim | true |
| InpEnableDivergence | true |
| InpRequireMomConfluence | true |
| InpSLPadding | 1.5 |
| InpRRRatio | 2.0 |
| InpLineExtend | 30 |
| InpHistoryScanBars | 500 |
Position Trading Preset (D1 - W1)
| Parameter | Value |
|---|---|
| InpEnableTrendCross | true |
| InpEnableRSIReclaim | false |
| InpEnableDivergence | true |
| InpRequireMomConfluence | false |
| InpSLPadding | 2.0 |
| InpRRRatio | 3.0 |
| InpLineExtend | 50 |
| InpHistoryScanBars | 1000 |
TIP: Start with the Swing Trading preset and modify one parameter at a time to observe its effect on signal frequency and quality.
Troubleshooting
No Signals Appearing
- Warmup period not reached. The indicator requires at least 100 bars of history plus the EMA slow length and pivot length combined.
- All signal classes disabled. Verify that at least one of InpEnableTrendCross , InpEnableRSIReclaim , or InpEnableDivergence is true.
- History scan limit too low. Try increasing InpHistoryScanBars to 1000+ to scan further back.
- No qualifying setups in visible range. Scroll back in history or wait for new bars to form.
Dashboard Not Showing
- Confirm InpShowDashboard = true
- If the chart window is too narrow, the dashboard may sit off-screen. Try InpDashCorner = DASH_TOP_LEFT .
- The dashboard repositions automatically when the chart is resized
TP/SL Lines Not Visible
- Verify InpShowSLTP = true
- The lines only appear after a signal fires; they are not drawn when the indicator is flat
- After TP2 or SL is hit, all four lines are deleted and the dashboard returns to flat state
Alerts Not Firing
- Check that InpEnableAlerts = true (master switch)
- For push: verify your MetaQuotes ID is configured and InpAlertPush = true
- For email: verify SMTP settings and InpAlertEmail = true
- Alerts fire only once per bar per event type
Different Results Between MT4 and MT5
- The underlying calculation logic is identical, but minor differences in warmup behavior between MT4 and MT5 can cause the first few signals in history to appear at slightly different bar positions
- These differences are expected and diminish as more historical bars are processed
Support and Contact
If you need assistance with Momentum Tidebreaker:
| Contact Method | Details |
|---|---|
| support@forexobroker.com | |
| Website | www.forexobroker.com |
| MQL5 Market | Use the Comments section on the product page |
When contacting support, please include:
- Your MetaTrader version (MT4 or MT5)
- Broker name and symbol format
- A description of the issue
- Screenshots of the chart and the indicator settings dialog
- The exact parameter values you are using
Download the indicator:
- MetaTrader 5: Momentum Tidebreaker MT5
- MetaTrader 4: Momentum Tidebreaker MT4
CONTACT & SUPPORT
- Email: info@forexobroker.com
- Questions: Use the Comments section on the product page or send a private message
- Bug Reports: Please include your broker name, account type, and a screenshot
-
✅ All MQL Tools: https://www.mql5.com/en/users/forexobroker/ ✅
--------------------------------------------------------------------------------------------------------------
🏦 **Broker I use**: https://icmarkets.com/?camp=55869
🏦 **Broker For EU Traders I use 1**: https://www.ictrading.com?camp=91414
🏦 **Broker I use 2**: https://one.exnessonelink.com/boarding/sign-up/a/c_thuv62ocfq
💻 **VPS**: https://chocoping.com/processing/aff.php?aff=738
💼 **Companies I use for getting funded**:
Fundednext: https://fundednext.com/?fpr=kestutis39
The5ers: https://www.the5ers.com/?afmc=16kl
FTMO: https://trader.ftmo.com/?affiliates=nRAyOhmFRnEnFdOpdLeh
Risk Disclaimer
Trading foreign exchange and CFDs on margin carries a high level of risk and may not be suitable for all investors. You may sustain a loss exceeding your initial investment. Trend Quorum is a technical analysis tool and does not guarantee profitable trades. Past performance is not indicative of future results. The authors accept no liability for any loss arising from use of the indicator. By using Trend Quorum you acknowledge sole responsibility for your trading decisions.


")
![[XAUUSD]: Weekly Liquidity Activation Points (timings), June 29 - July 3, 2026](https://c.mql5.com/6/1014/splash-preview-772062.png "[XAUUSD]: Weekly Liquidity Activation Points (timings), June 29 - July 3, 2026")