")

Introduction
The Vault Depth Indicator is a non-repainting trend tool for MetaTrader 4 and MetaTrader 5 that combines a pulse-driven conviction engine, Mean Absolute Deviation adaptive bands, and dynamically planted exhaustion levels with retest detection. It tracks bar-by-bar conviction, plants structural zones at saturation peaks, and fires retest signals when price returns to those zones.
Key Features:
- Pulse Engine: counter-based conviction tracking with configurable decay
- Adaptive MAD Bands: channel width modulated by pulse saturation
- Exhaustion Levels: zones planted automatically at saturation peaks
- Retest Detection: cooldown-gated touch signals on planted zones
- Trend Flip Arrows: non-repainting band-cross signals (Wingdings 233 / 234)
- Five Alert Events: Trend Flip LONG, Trend Flip SHORT, Exhaustion Plant, Bull Retest, Bear Retest
- Four Alert Channels: popup, sound, push notification, email
Download the indicator:
- MetaTrader 5: Vault Depth MT5
- MetaTrader 4: Vault Depth MT4
TIP: This indicator is designed for traders who want a structured approach to identifying when market conviction peaks, where it collapses, and where price is likely to react on return. It works on any symbol and any timeframe available in MetaTrader.
Understanding the Pulse Engine
A "conviction bar" is a candle that closes near the extreme of its own range with directional intent. Specifically:
- A bullish conviction bar closes in the upper 30% of its high-low range AND closes higher than it opened
- A bearish conviction bar closes in the lower 30% AND closes below the open
The 30% threshold is configurable via InpCloseZone (range 0.1 to 0.5).
Pulse Counter Logic:
The indicator maintains two counters: bullPulse and bearPulse . On each bar:
- If a bullish conviction bar prints, bullPulse increases by 1 (capped at InpPulseCap )
- If no bullish conviction bar prints, bullPulse is multiplied by InpPulseDecay
- The same independent logic runs for bearPulse
The default decay of 0.85 means the counter retains 85% of its value each non-conviction bar. Saturation is calculated as max(bullPulse, bearPulse) / pulseCap and ranges from 0 to 1.
Why this matters: The pulse engine is not a fixed-window indicator. It accumulates evidence quickly when conviction appears and forgets it gracefully when conviction fades. A market that prints three strong-close bars in a row has high pulse. A market that prints four wicky doji-like bars after a strong run has rapidly decaying pulse.
NOTE: Saturation peaks above 0.5 are required before the exhaustion-detection logic will plant a zone. This filters out short pulse bursts that do not constitute a meaningful directional run.
Installation Guide
Vault Depth Indicator is distributed through the MQL5.com Market. Installation is automatic.
Steps:
- Purchase the indicator from the MQL5 Market product page
- The indicator installs automatically into your MetaTrader terminal
- Open MetaTrader and press Ctrl+N to open the Navigator panel
- Expand Indicators > Market
- Locate Vault_Depth_Indicator in the list
- Drag the indicator onto any chart, or double-click its name
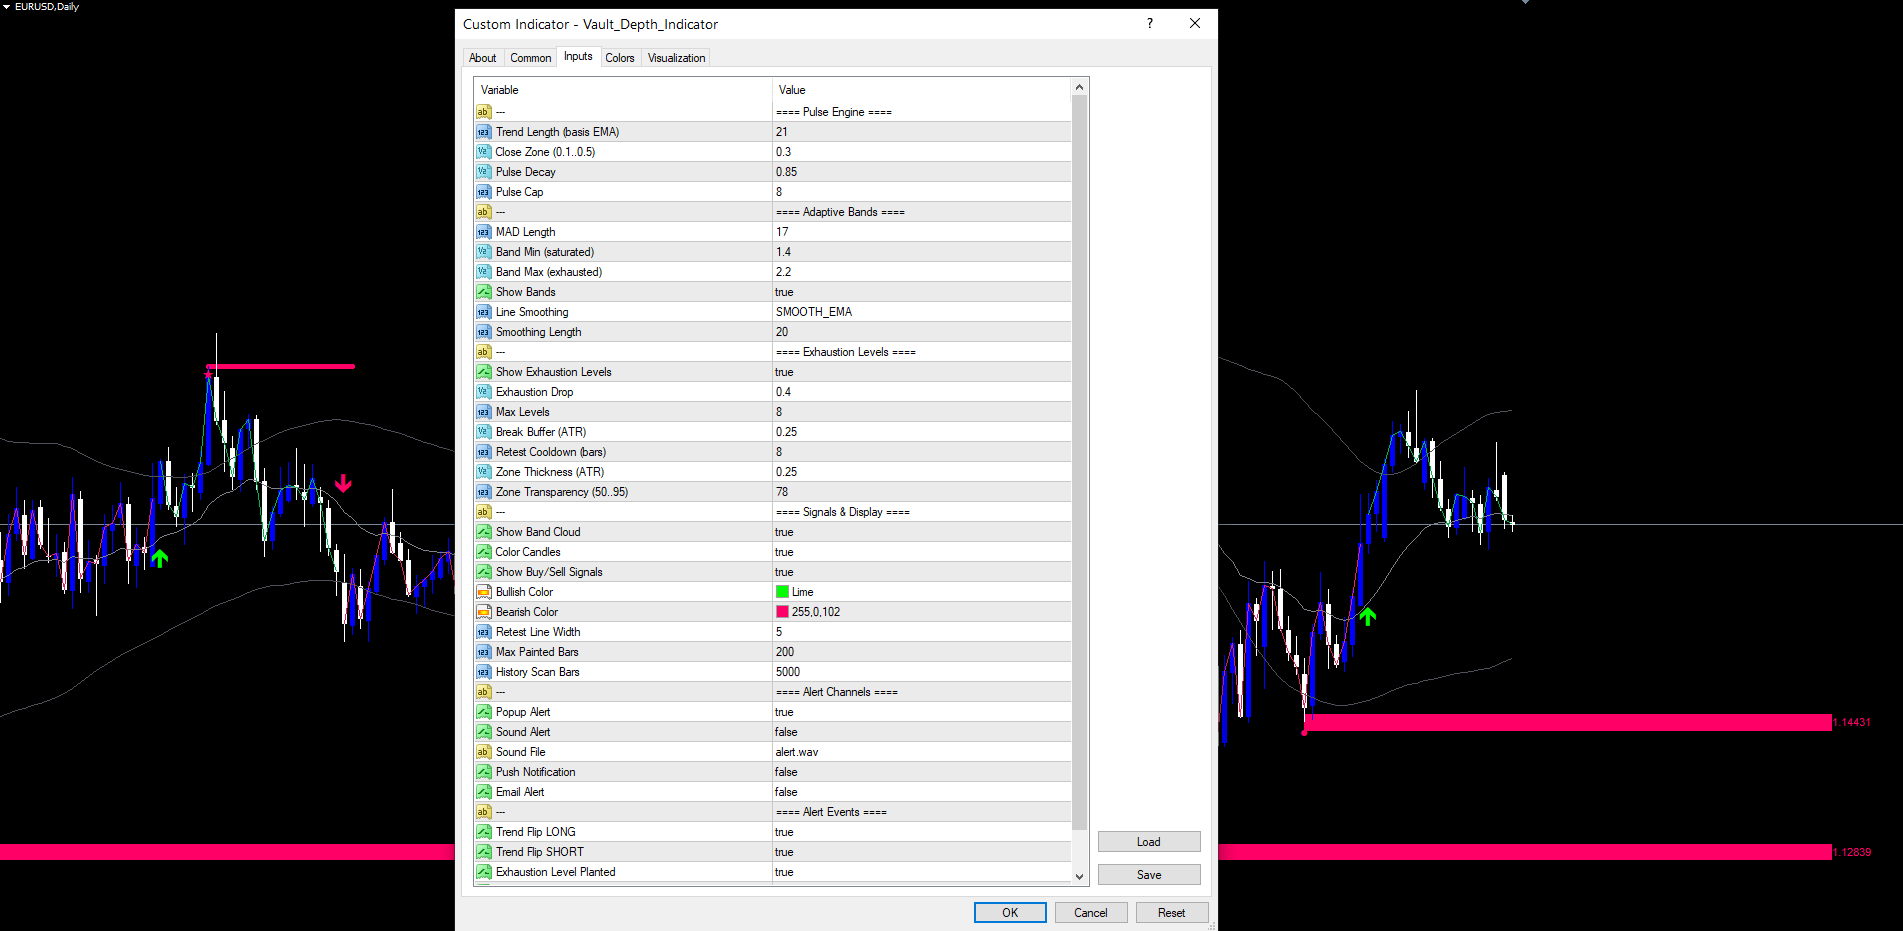
- The settings dialog appears -- adjust parameters as needed (see sections below)
- Click OK to apply
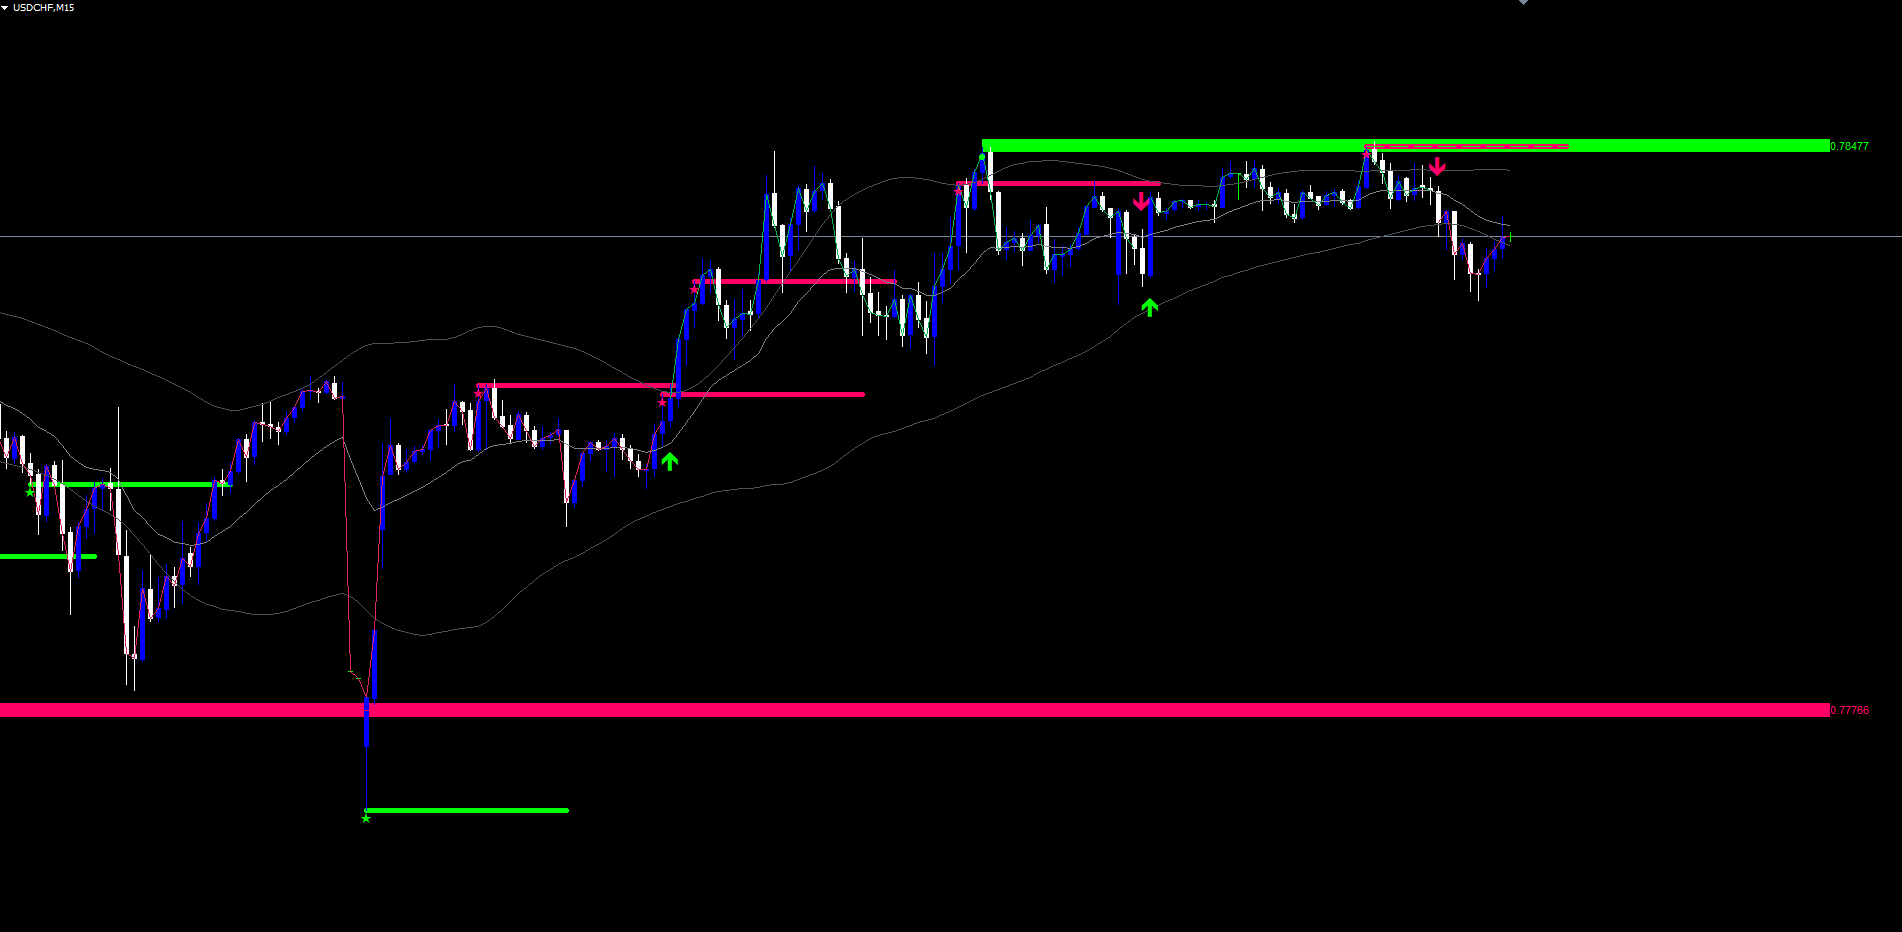
After loading, you will see:
- Basis line (gray) drawn through the price action
- Upper and lower band lines (subtle gray) forming the adaptive channel
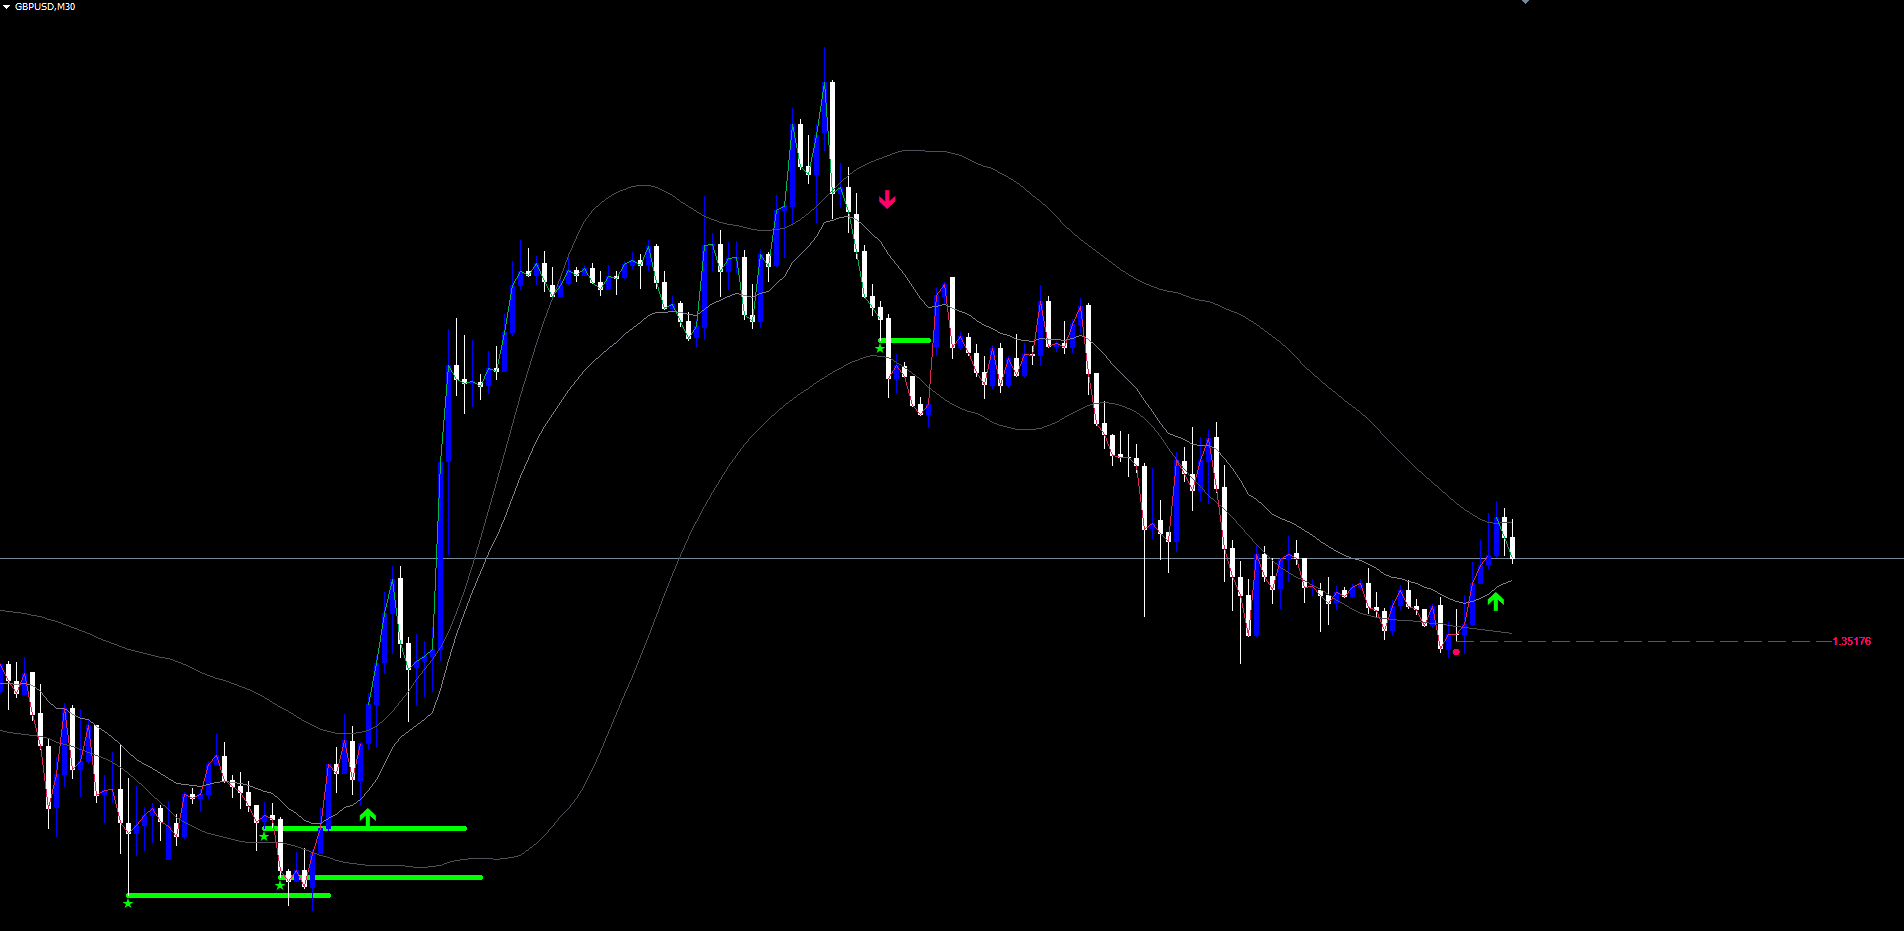
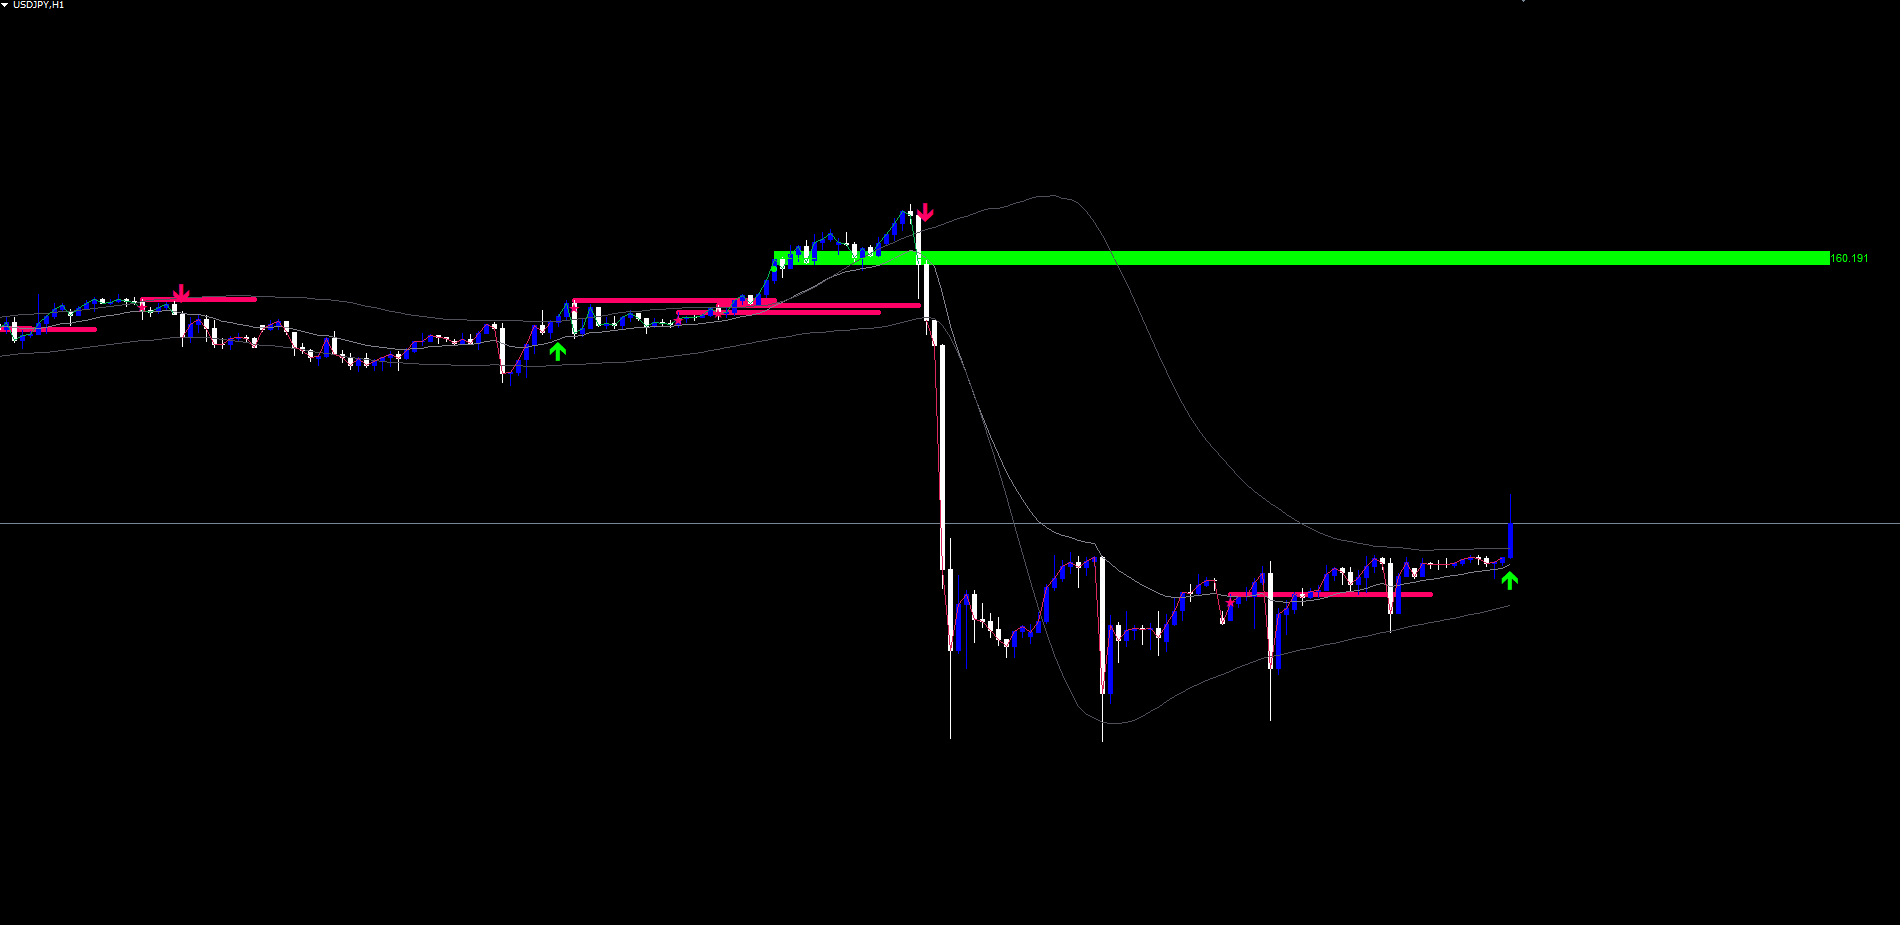
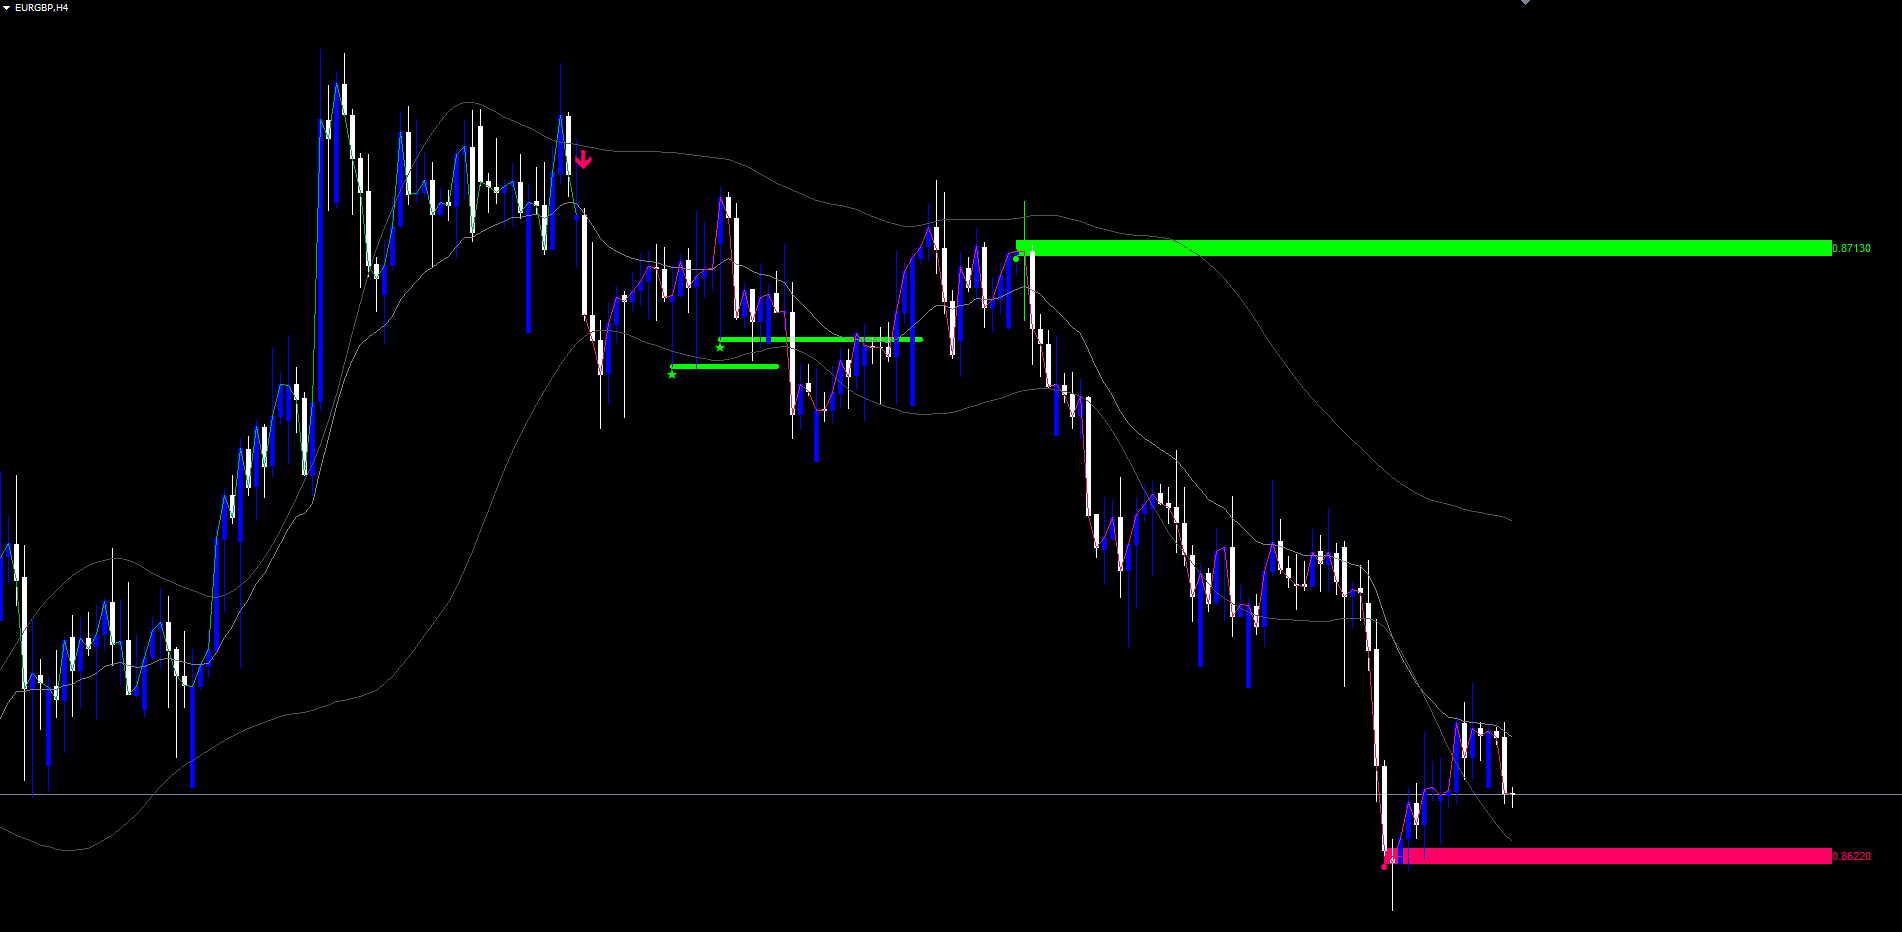
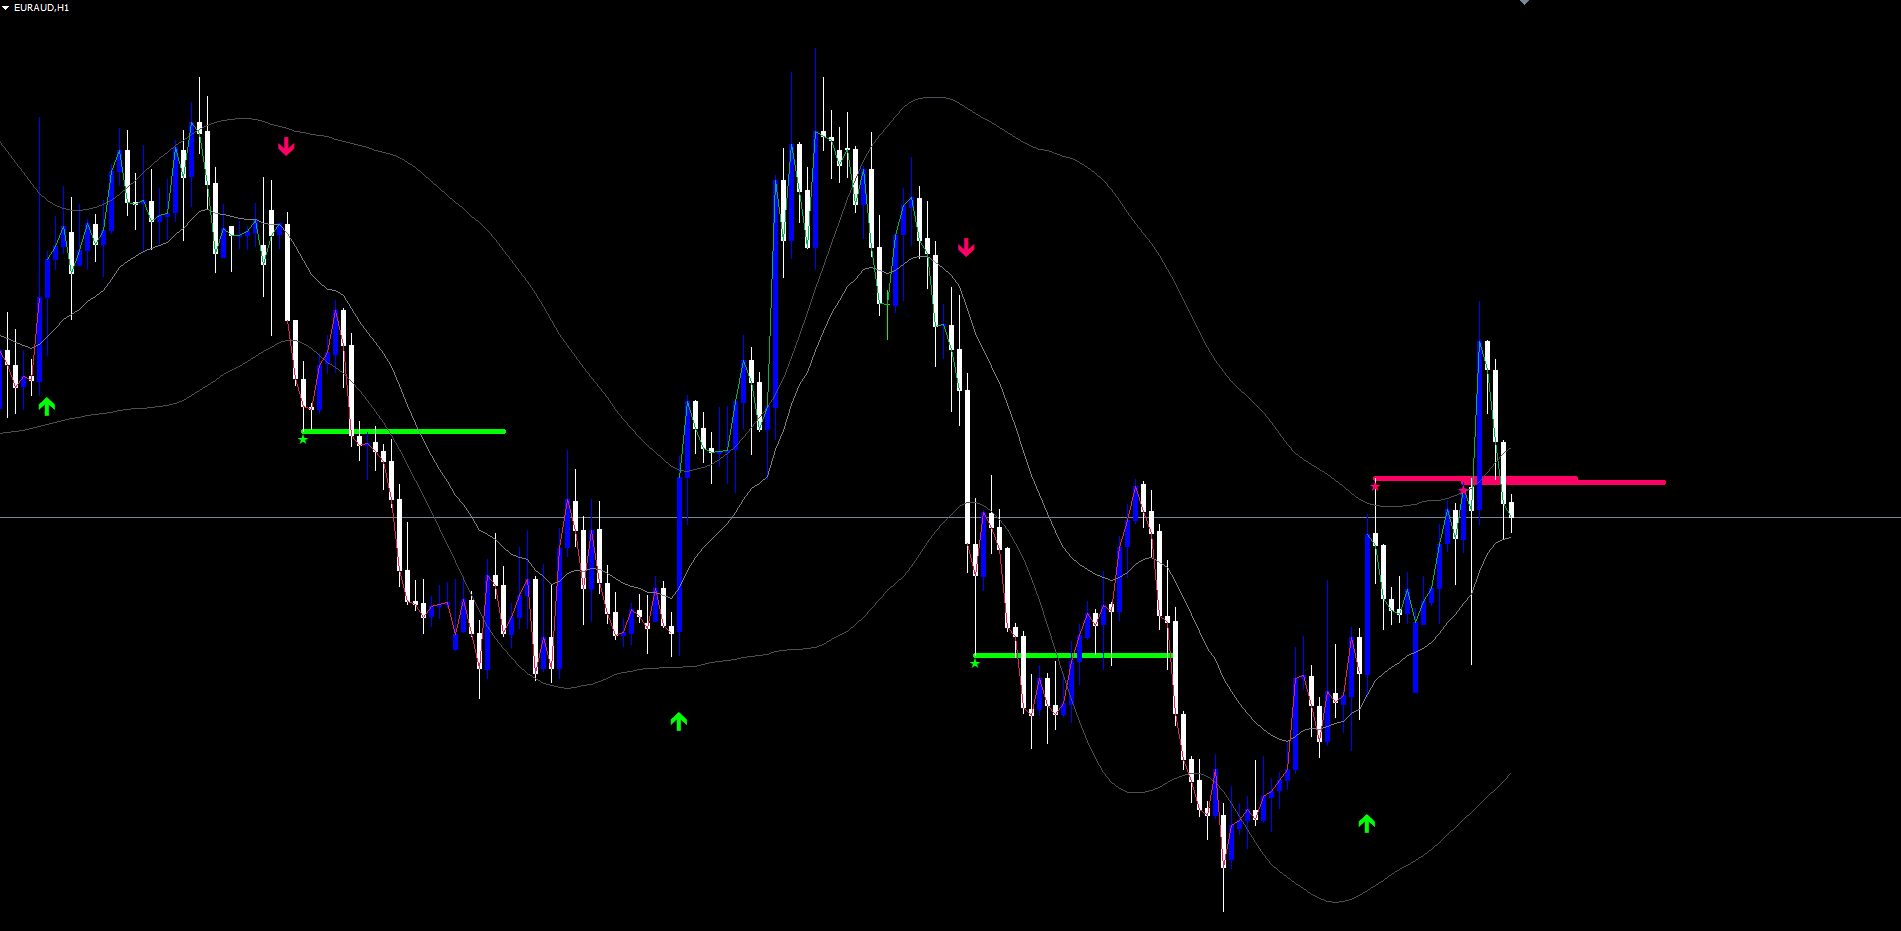
- Trend flip arrows at confirmed band crosses (green up / pink down)
- Exhaustion zones as colored rectangles at past saturation peaks
- Dashed mid-lines through each zone's peak price
- Right-edge price labels for each zone
- Diamond markers on the original peak bar of each zone
- Retest lines and sparkles at any rejection points
The first load triggers a 5000-bar history scan to retroactively detect zones. This typically takes 1-3 seconds.
IMPORTANT: Do not manually copy files to the data folder. The MQL5 Market handles all file placement and updates automatically.
Adaptive Band Channel
The bands form an envelope around the basis EMA, with width that adapts to the current pulse saturation.
Construction:
- Basis = EMA(close, InpTrendLength) -- default 21-period EMA
- MAD = SMA(|close - SMA(close, InpMadLength)|, InpMadLength) -- Mean Absolute Deviation over 17 bars
- bandMult = InpBandMax - (InpBandMax - InpBandMin) * saturation -- adaptive coefficient
- Upper Raw = basis + MAD * bandMult
- Lower Raw = basis - MAD * bandMult
The displayed upper and lower lines are an optionally smoothed version of the raw values. The smoothing method is selectable (SMA, EMA, HMA, ALMA) and the period is configurable.
Why MAD instead of Standard Deviation: MAD does not square the deviations, so a single news spike does not balloon the bands for 20 bars afterwards. MAD-based channels respond to typical market behaviour and recover faster after volatility shocks.
Adaptive width interpretation:
- High saturation (1.0) -> tight bands ( bandMult = 1.4) -> trend with high conviction
- Low saturation (0) -> wide bands ( bandMult = 2.2) -> uncertain market
A close above the upper band when bands are tight is a high-quality breakout. A close above the upper band when bands are wide is a noise event.
CRITICAL: The signal cross logic uses the RAW upper and lower bands, never the smoothed display lines. The display smoothing is purely aesthetic.
Trend Flip Signals
A trend flip signal fires when the bar close crosses the relevant raw band.
LONG flip ( switchUp ):
- Previous bar close <= previous bar raw upper band
- Current bar close > current bar raw upper band
- Previous signal state was -1 (short) or 0 (neutral)
SHORT flip ( switchDown ):
- Previous bar close >= previous bar raw lower band
- Current bar close < current bar raw lower band
- Previous signal state was +1 (long) or 0 (neutral)
When a flip fires, an arrow is plotted permanently on the chart:
- LONG: green up arrow (Wingdings code 233) below the bar low
- SHORT: pink down arrow (Wingdings code 234) above the bar high
Non-repainting guarantee: Signals fire only on confirmed bar close. Once an arrow is plotted, it does not move, change, or disappear. Historical chart data shows exactly what would have appeared in real time.
The cost of this non-repainting integrity is that the arrow appears at the close of the breakout bar, not at the moment of the cross intra-bar. Acting on the next bar's open is the canonical entry.
Exhaustion Levels
Exhaustion levels are the indicator's most distinctive feature. They are zones planted automatically at the prices where market conviction reached its peak during a directional run.
Detection Logic:
While the pulse rises, the indicator tracks four state variables:
- satPeak -- highest saturation reached so far
- satPeakDir -- dominant direction at the peak (+1 bull, -1 bear)
- satPeakPrice -- bar high (for bull peaks) or bar low (for bear peaks)
- satPeakBarTime -- bar time when the peak occurred
When saturation < satPeak * InpDropThresh AND satPeak > 0.5 , exhaustion is detected. The default InpDropThresh is 0.4, meaning saturation must fall below 40% of the recent peak.
Zone Plantation:
When exhaustion fires, four chart objects are created:
| Object | Description |
|---|---|
| Rectangle | Centered on satPeakPrice , vertical thickness = ATR x InpZoneHeight (default 0.25 x ATR) |
| Mid-line | Dashed horizontal line through the exact peak price |
| Right-edge price label | Text label showing the precise peak price (e.g. "1.08527") |
| Diamond marker | Wingdings code 159 placed on the peak bar |
The zone color matches the dominant direction at the peak: bull color (default green) for bull peaks, bear color (default pink) for bear peaks. The zone extends 40 bars to the right of its origin and is updated each tick to extend further forward.
After plantation, satPeak resets to zero so the engine can begin tracking the next pulse cycle.
Level Lifecycle
Every alive level is checked each bar for two events.
Break Detection
A level is broken when the close exceeds the zone in the opposite direction with an ATR buffer.
For a bull-peak level (zone above price, planted at a high-water bullish mark):
- Break fires when close > zoneTop + ATR * InpBreakBuffer
For a bear-peak level (zone below price, planted at a low-water bearish mark):
- Break fires when close < zoneBot - ATR * InpBreakBuffer
When a level breaks, all four of its objects are removed from the chart and the level is marked dead. The default break buffer is 0.25 x ATR, providing a small filter to avoid false breaks on marginal touches.
Retest Detection
A retest fires when:
- Bar high >= zone bottom AND bar low <= zone top (price has touched inside the zone)
- Bars since last retest on this level >= InpRetestCooldown (default 8)
- Bar time > origin bar time + 2 bar widths (cannot retest immediately after plantation)
The direction of the retest signal depends on the level type and the current close:
- Bull-peak level, current close < level.price : fires a Bear Retest signal (price returned to bull-conviction zone from below and was rejected)
- Bear-peak level, current close > level.price : fires a Bull Retest signal (price returned to bear-conviction zone from above and was rejected)
When a retest fires, two visuals appear:
- A horizontal line drawn at the bar's high (bear retest) or low (bull retest), spanning 25 bars right, in the relevant direction's color, width = InpRetestLineWidth (default 5)
- A small sparkle marker (Wingdings code 171) at the same anchor
The level's lastRetestBarTime is updated to enforce the cooldown. The same level can retest multiple times during its lifecycle, but each retest must be at least InpRetestCooldown bars apart.
Maximum Levels
InpMaxLevels (default 8) caps the number of alive levels. When a new exhaustion fires while at the cap, the oldest alive level is removed. This keeps the chart readable on long-running charts.
Complete Parameter Reference
The following table lists all input parameters in the order they appear in the indicator settings dialog.
Pulse Engine
| Parameter | Type | Default | Description |
|---|---|---|---|
| InpTrendLength | int | 21 | Period for the basis EMA |
| InpCloseZone | double | 0.3 | Conviction-bar threshold (top/bottom 30% of range) |
| InpPulseDecay | double | 0.85 | Multiplier on pulse counter for non-conviction bars |
| InpPulseCap | int | 8 | Maximum pulse counter value |
Adaptive Bands
| Parameter | Type | Default | Description |
|---|---|---|---|
| InpMadLength | int | 17 | Period for Mean Absolute Deviation |
| InpBandMin | double | 1.4 | Band coefficient at full saturation |
| InpBandMax | double | 2.2 | Band coefficient at zero saturation |
| InpShowBands | bool | true | Show upper and lower band lines |
| InpSmoothMode | enum | EMA | Display smoothing: SMA, EMA, HMA, ALMA |
| InpSmoothLen | int | 20 | Display smoothing period |
Exhaustion Levels
| Parameter | Type | Default | Description |
|---|---|---|---|
| InpShowLevels | bool | true | Plant and display exhaustion zones |
| InpDropThresh | double | 0.4 | Exhaustion fires when saturation < peak * this |
| InpMaxLevels | int | 8 | Maximum alive levels (oldest dropped first) |
| InpBreakBuffer | double | 0.25 | ATR multiplier for break confirmation buffer |
| InpRetestCooldown | int | 8 | Minimum bars between retests on same level |
| InpZoneHeight | double | 0.25 | ATR multiplier for zone vertical thickness |
| InpZoneTransp | int | 78 | Visual transparency 0-95 |
Signals and Display
| Parameter | Type | Default | Description |
|---|---|---|---|
| InpShowSignals | bool | true | Show trend flip arrows |
| InpBullColor | color | C'0,255,0' | Bullish element color |
| InpBearColor | color | C'255,0,102' | Bearish element color |
| InpRetestLineWidth | int | 5 | Pixel width of retest lines |
| InpHistoryScanBars | int | 5000 | Bars to scan on first load |
Alert Channels
| Parameter | Type | Default | Description |
|---|---|---|---|
| InpAlertPopup | bool | true | Show MetaTrader popup dialog |
| InpAlertSound | bool | false | Play alert sound file |
| InpAlertSoundFile | string | alert.wav | Sound file name |
| InpAlertPush | bool | false | Send push notification |
| InpAlertEmail | bool | false | Send email notification |
Alert Events
| Parameter | Type | Default | Description |
|---|---|---|---|
| InpEvtPulseLong | bool | true | Alert on Trend Flip LONG |
| InpEvtPulseShort | bool | true | Alert on Trend Flip SHORT |
| InpEvtExhaustion | bool | true | Alert when zone is planted |
| InpEvtBullRetest | bool | true | Alert on Bullish Retest |
| InpEvtBearRetest | bool | true | Alert on Bearish Retest |
Alert Configuration
Vault Depth supports four delivery channels and five distinct alert events. Each is independently togglable.
Alert Channels
| Parameter | Default | Description |
|---|---|---|
| InpAlertPopup | true | Show a popup dialog in MetaTrader |
| InpAlertSound | false | Play the configured sound file |
| InpAlertPush | false | Send push notification to MetaTrader mobile app |
| InpAlertEmail | false | Send email notification |
Alert Events
| Event | Trigger |
|---|---|
| Trend Flip LONG | Bar close crosses above the raw upper band |
| Trend Flip SHORT | Bar close crosses below the raw lower band |
| Exhaustion Level Planted | Pulse exhaustion detected, new zone drawn |
| Bullish Retest | Bear-peak zone is touched, close above zone price |
| Bearish Retest | Bull-peak zone is touched, close below zone price |
Each alert message includes the event name, the symbol, and the current price context. All alerts are deduplicated per bar -- the same event cannot fire twice on the same bar even if conditions oscillate.
Push and email alerts are automatically suppressed during Strategy Tester runs (visual mode, optimization, or backtest) to prevent spam.
Enabling Push Notifications
- Install the MetaTrader mobile app (iOS or Android)
- Open the app and navigate to Settings > Messages
- Copy your MetaQuotes ID
- In desktop MetaTrader, go to Tools > Options > Notifications
- Enter your MetaQuotes ID and enable notifications
- Set InpAlertPush = true in the indicator settings
Enabling Email Notifications
- In MetaTrader, go to Tools > Options > Email
- Check Enable
- Enter your SMTP server, port, login, password, and destination email
- Click Test to verify
- Set InpAlertEmail = true in the indicator settings
Trading Strategies
The following three approaches demonstrate different ways to use Vault Depth.
WARNING: Trading involves significant risk of loss. These strategies are provided for educational purposes only. Always test on a demo account first and never trade with money you cannot afford to lose.
Strategy A: Trend Flip Entry (M15 - H1)
Goal: Enter at the first confirmed band cross, ride the new trend.
Setup:
- Wait for a green up arrow (Trend Flip LONG) or pink down arrow (Trend Flip SHORT)
- Enter at the open of the next bar
- Place stop slightly beyond the opposite band of the breakout bar
- Target the next exhaustion zone in the trade direction
Trade management:
- Trail stop along the basis EMA after price moves 1 ATR in your favor
- Exit at the target zone, or on a counter-flip arrow
Strategy B: Retest Trade (H1 - H4)
Goal: Use exhaustion zones as structural levels and trade the rejection.
Setup:
- Wait for an active exhaustion zone (bull-peak above price, or bear-peak below price)
- Watch for a Bull Retest (sparkle marker on a bear-peak zone) or Bear Retest (sparkle marker on a bull-peak zone)
- Enter at the open of the next bar in the retest direction
- Place stop on the far side of the tested zone
Trade management:
- Target the next opposite-direction zone in the trade path
- Take partial profit at 1:1 risk-reward, move stop to entry, hold remainder
- Exit if a counter-direction trend flip arrow prints
TIP: Bull Retests on bear-peak zones (green retest line on pink zone) and Bear Retests on bull-peak zones (pink retest line on green zone) are the indicator's highest-conviction setups -- the market has provided three pieces of evidence (original exhaustion, return, and rejection).
Strategy C: Multi-Symbol Alert Monitoring
Goal: Monitor multiple instruments without watching the chart constantly.
Setup:
- Open charts for all instruments and timeframes you want to monitor
- Apply Vault Depth Indicator to each chart with default settings
- Enable InpAlertPush = true and configure your MetaQuotes ID
- Optionally enable InpAlertEmail = true for permanent records
- Disable trend flip alerts ( InpEvtPulseLong = false , InpEvtPulseShort = false ) and keep only Exhaustion + Retest alerts to reduce noise
Workflow:
When a notification arrives, open the relevant chart, look for the freshly planted zone or retest signal, and decide whether to enter based on broader context (recent direction, news calendar, position in your day).
Parameter Tuning Presets
The following presets provide starting points for different trading styles.
Scalping Preset (M5 - M15)
| Parameter | Value |
|---|---|
| InpTrendLength | 14 |
| InpPulseCap | 5 |
| InpMadLength | 10 |
| InpBandMin | 1.2 |
| InpBandMax | 1.8 |
| InpDropThresh | 0.5 |
| InpRetestCooldown | 4 |
| InpMaxLevels | 5 |
| InpHistoryScanBars | 2000 |
Swing Trading Preset (H1 - H4)
| Parameter | Value |
|---|---|
| InpTrendLength | 21 |
| InpPulseCap | 8 |
| InpMadLength | 17 |
| InpBandMin | 1.4 |
| InpBandMax | 2.2 |
| InpDropThresh | 0.4 |
| InpRetestCooldown | 8 |
| InpMaxLevels | 8 |
| InpHistoryScanBars | 5000 |
Conservative / Position Preset (H4 - D1)
| Parameter | Value |
|---|---|
| InpTrendLength | 30 |
| InpPulseCap | 12 |
| InpMadLength | 20 |
| InpBandMin | 1.6 |
| InpBandMax | 2.6 |
| InpDropThresh | 0.3 |
| InpRetestCooldown | 15 |
| InpMaxLevels | 12 |
| InpHistoryScanBars | 8000 |
TIP: Start with the Swing Trading preset and modify one parameter at a time to observe its effect on signal quality and frequency.
Troubleshooting
No Levels Appearing on the Chart
Possible causes and fixes:
- History scan not yet complete. First load triggers a scan of InpHistoryScanBars bars. Wait 1-3 seconds.
- No exhaustion events in the visible range. Scroll back in history. Levels are planted only when saturation peaks above 0.5 then collapses.
- InpDropThresh too low. A value of 0.2 requires saturation to fall below 20% of peak before exhaustion fires -- this rarely happens in normal markets. Try 0.4 or higher.
- InpShowLevels = false. Levels are computed but not drawn. Enable to see them.
No Trend Flip Arrows
- The chart may simply be in a low-volatility regime where price stays inside the bands. This is correct behavior; arrows fire only on confirmed band crosses.
- Verify InpShowSignals = true .
- Reduce InpBandMin and InpBandMax for tighter bands and more frequent crosses.
Bands Not Visible
- Verify InpShowBands = true .
- The default band color is dark gray (C'80,80,90'). On a dark-background chart this can be hard to see. Right-click the indicator -> Properties -> Colors and change to a brighter color.
Retest Signals Not Firing
- Verify the level is alive (its rectangle is still visible on the chart).
- Verify the cooldown has elapsed since any previous retest on this level.
- Check that price has actually entered the zone (the bar must touch within the rectangle's vertical bounds).
- Bull Retests require close > level price (price rejected upward); Bear Retests require close < level price.
Alerts Not Firing
- Check that the relevant event toggle is enabled ( InpEvtPulseLong , InpEvtBullRetest , etc.)
- For push notifications: verify your MetaQuotes ID is configured in Tools > Options > Notifications and that InpAlertPush = true
- For email alerts: verify SMTP settings in Tools > Options > Email and that InpAlertEmail = true
- Push and email alerts are suppressed during Strategy Tester to prevent spam
MT5 Indicator Slow to Load
- The history scan defaults to 5000 bars. If your chart has very long history loaded, the first scan may take a few seconds. Reduce InpHistoryScanBars to 2000 if needed.
- Object creation for many historical levels can also delay the first paint. Reduce InpMaxLevels to 5 for faster initial render.
Different Visual Between MT4 and MT5
- The internal computation logic is identical between platforms.
- Object rendering may differ slightly -- MT5 displays anchors and arrow scaling differently than MT4. The trade-relevant data (zones, levels, signal timing) is identical.
Download the indicator:
- MetaTrader 5: Vault Depth MT5
- MetaTrader 4: Vault Depth MT4
CONTACT & SUPPORT
- Email: info@forexobroker.com
- Questions: Use the Comments section on the product page or send a private message
- Bug Reports: Please include your broker name, account type, and a screenshot
-
✅ All MQL Tools: https://www.mql5.com/en/users/forexobroker/ ✅
--------------------------------------------------------------------------------------------------------------
🏦 **Broker I use**: https://icmarkets.com/?camp=55869
🏦 **Broker For EU Traders I use 1**: https://www.ictrading.com?camp=91414
🏦 **Broker I use 2**: https://one.exnessonelink.com/boarding/sign-up/a/c_thuv62ocfq
💻 **VPS**: https://chocoping.com/processing/aff.php?aff=738
💼 **Companies I use for getting funded**:
Fundednext: https://fundednext.com/?fpr=kestutis39
The5ers: https://www.the5ers.com/?afmc=16kl
FTMO: https://trader.ftmo.com/?affiliates=nRAyOhmFRnEnFdOpdLeh
Risk Disclaimer
Trading foreign exchange and CFDs on margin carries a high level of risk and may not be suitable for all investors. You may sustain a loss exceeding your initial investment. Trend Quorum is a technical analysis tool and does not guarantee profitable trades. Past performance is not indicative of future results. The authors accept no liability for any loss arising from use of the indicator. By using Trend Quorum you acknowledge sole responsibility for your trading decisions.


