

This is the second episode of a blog series on how to use the „Netsrac SR Dashboard“ to find trading opportunities. The SR Dashboard is designed to reduce your time in front of the monitor. It can find many setups for us. All we have to do is trade those setups.
I have been asked by some people how to operate the dashboard correctly. That's why I want to start this blog series. We will cover the following topics:
- Using the "Netsrac SR Dashboard" (quick guide)
- Trading Pinbars
- Quick Set-Gets with the Dashboard
- Trade the Engulfing Pattern
- Weekly pivot as potential reversal points
- Scalping the short term trend
- Trend trading with important moving averages
- Volatility outbreak
- ... (may continue)
What do we need? We need the SR Dashboard - which you can find here in full version. Or you can use the free but limited version here.
In this blog, we take some "quick shots". I want you to show, how much possibilities the dashboard gives. Bear in mind, you can combine all these things with each other! So you can let the dashboard find YOUR setup.
1. Trend monitoring (Timeframes M30/H4/D1)
We want to know, which pairs are in an uptrend, in a downtrend or move sideways. We want to have this information for multiple timeframes - for the current and the previous period. And we want to get that information at a glance. The dashboard can easily accomplish these tasks.
What we set...
| Use Trend section | true |
| Timeframe 1 | 30 Minutes |
| Timeframe 2 | 4 Hours |
| Timeframe 3 | 1 Day |
... and what we get
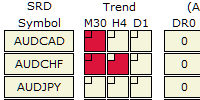 | AUDCAD is down in M30 and was down 30 Minutes ago. No trend in H4 and no trend 4 hours ago. No trend in daily (today) and no trend yesterday. AUDCHF is down in M30 and was down 30 Minutes ago. AUDCHF is down in H4 and there was no trend 4 hours ago. No trend in daily (today) and no trend yesterday. AUDJPY has no trend. Nowhere. |
What we set ...
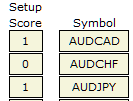
| Score "Trend Up" Timeframe 1 | 3 |
| Score "Trend Down" Timeframe 1 | -3 |
... and what we get
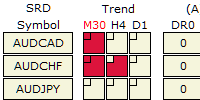 | M30 Timeframe is now marked in red (a score <> 0 was assigned) AUDCAD is down in M30 and was down 30 Minutes ago. No trend in H4 and no trend 4 hours ago. No trend in daily (today) and no trend yesterday. AUDCHF is down in M30 and was down 30 Minutes ago. AUDCHF is down in H4 and there was no trend 4 hours ago. No trend in daily (today) and no trend yesterday. AUDJPY has no trend. Nowhere. |
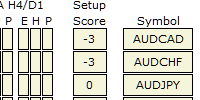 | AUDCAD has a score of -3, because it is down in M30. AUDCHF has a score of -3, because it is donw in M30. AUDJPY has a score of 0, because there is no trend in M30. |
2. Monitoring the Daily Range
We want to know how far the price for a pair has "gone" today or yesterday. We want to know if this range is below or above the average. Let the dashboard do the work for us.
What we set...
| Use (A)DR section | true |
| DR Level "critical high" | 95 (this means - we want a warning if the daily range is greater than 95% of the average daily range) |
| DR Level "critical low" | 25 (this means - we want a warning if the daily range is below than 25% of the average daily range) |
| Score DR "critical high today" | 3 (+3 points to overall score, if today's range is greater than 95% of the average daily range) |
| Score DR "critical high yesterday" | 1 (+1 points to overall score, if yesterdays range was greater than 95% of the average daily range) |
| Score DR "critical low today" | -3 (-3 points to overall score if today's range is below 25% of the average daily range) |
| Score DR "critical low yesterday" | -1 (-1 point to overall score if yesterdays range was below 25% of the average daily range) |
... and what we get
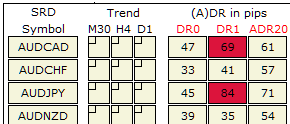 | DR0, DR1 and ADR20 are now marked in red (a score <> 0 was assigned) AUDCAD has a daily range today (DR0) of 47 pips - that's more than 25% but less than 95% of the average daily range of 61 pips (ADR20); yesterday AUDCAD had a range of 69 pips - that's the reason, why it is colored red. It's greater than 95% of ADR20! AUDCHF has a daily range today of 33 pips so far, yesterdays range was 41 pips - Neither one nor the other value was too big or small for a warning. and so on... |
 | AUDCAD has a score of 1, because yesterday's range was greater than 95% of the ADR20. AUDCHF has a score of 0, because there was no abnormal movement. Same as AUDCAD at AUDJPY. |
3. Monitoring multi-timeframe Moving Averages
We want to know if the price for a pair is near a relevant Moving Average e.g. EMA 50 @ M30 or SMA 200 @ D1. If so, we want an alert. In this example we look at EMA50 @ M30, EMA50 @ H1, EMA150 @ H4 and SMA200 @ D1. We want an alert if the price is closer than 10 pips or 15 pips in the higher timeframes.
What we set...
| Use Moving Average Section | true |
| Timeframe of MA 1 | 30 Minutes |
| Mode MA 1 | Exponential (EMA) |
| Period MA 1 | 50 |
| Critical distance to MA 1 (pips) | 10 |
| Score MA 1 | 1 (+3 points to overall score, if the distance price to MA is closer than 10 pips) |
| ---- | ---- |
| Timeframe of MA 2 | 1 Hour |
| Mode MA 2 | Exponential (EMA) |
| Period MA 2 | 50 |
| Critical distance to MA 2 (pips) | 10 |
| Score MA 2 | 1 (+3 points to overall score, if the distance price to MA is closer than 10 pips) |
| ---- | ---- |
| Timeframe of MA 3 | 4 Hours |
| Mode MA 3 | Exponential (EMA) |
| Period MA 3 | 150 |
| Critical distance to MA 3 (pips) | 15 |
| Score MA 3 | 2 (+2 points to overall score, if the distance price to MA is closer than 15 pips) |
| ---- | ---- |
| Timeframe of MA 4 | 1 Day |
| Mode MA 4 | Simple (SMA) |
| Period MA 4 | 200 |
| Critical distance to MA 4 (pips) | 15 |
| Score MA 4 | 3 (+3 points to overall score, if the distance price to MA is closer than 15 pips) |
... and what we get
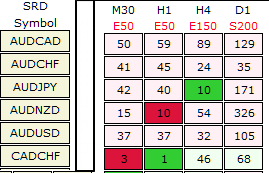 | The header shows the timeframes, mode and period for the configured MAs, the second line is now marked in red (a score <> 0 was assigned) AUDCAD is 50 pips below (lavender background color) EMA50 (M30), 59 pips below EMA50 (H1), 89 pips below EMA150 (H4) and 129 pips below SMA200 (D1). AUDCHF is similar to AUDCAD. AUDJPY is more interesting. The price is 10 pips above (green background color) the EMA150 (H4). ... CADCHF is near EMA50 (M30) and near EMA50 (H1). The price is 46 pips above (honeydew background color) the EMA150 (H4) and 48 pips above the SMA200 (D1). |
 | AUDCAD, AUDCHF and AUDUSD did not get score-points because they are not near a configured MA. AUDJPY has a score of 2 points because the price is near the EMA150 (H4) and we have set a score of 2, if that happens. AUDNZD has a score of 1 point because the price is near the EMA50 (H1) and we have set a score of 1, if that happens. CADCHF has a score of 2 points, because ... you know why don't you? ... For advanced users: Set an alert with a threshold of 2 or 3 and get an alert while you are lying in the sun. ;-) |
4. Monitoring Pivot Points (Daily, Weekly and Monthly)
We want to watch pivot points (you have to know - we are using Fibonacci-Pivots, like S38 or R78). Whenever the price comes close to one of these points, we would like to know about it. Let us see how we can solve this task.
What we set ...
| Use pivot section | true |
| Critical Distance to Daily Pivot (pips) | 5 |
| Score Daily Pivot at Resistance | -1 (-1 point to overall score if the distance price to a resistance-pivot point is closer than 5 pips) It is a negative value because it is a bearish setup (in my definition)- this is relevant for alerts e.g. |
| Score Daily Pivot at Support | 1 (+1 point to overall score, if the distance price to a support-pivot point is closer than 5 pips) It is a positive value because it is a bullish setup (in my definition)- this is relevant for alerts e.g. |
| ---- | ---- |
| Critical Distance to Weekly Pivot (pips) | 8 |
| Score Weekly Pivot at Resistance | -2 (-2 points to overall score if the distance price to a resistance-pivot point is closer than 5 pips) |
| Score Weekly Pivot at Support | 2 (+2 point to overall score if the distance price to a resistance-pivot point is closer than 5 pips) |
| ---- | ---- |
| Critical Distance to Monthly Pivot (pips) | 12 |
| Score Monthly Pivot at Resistance | -3 (-3 points to overall score if the distance price to a resistance-pivot point is closer than 5 pips) |
| Score Monthly Pivot at Support | 3 (+3 points to overall score if the distance price to a resistance-pivot point is closer than 5 pips) |
... and what we get
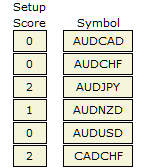
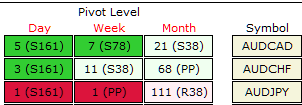 | The dashboard shows the distance to the closest pivot point! AUDCAD is 5 pips above (green background color) daily S161, 7 pips above weekly S78 and 21 pips above (honeydew background color) monthly S38AUDCHF is 3 pips above daily S161, 11 pips above weekly S38 and 66 pips above monthly Pivotpoint PP AUDJPY is 1 pip below (red background color) S161, 1 pip below weekly PP and 111 pips below (lavender background color) the monthly R38 |
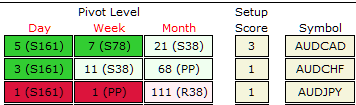 | AUDCAD has a score of 3 points (remember: its a bullish setup), because the price is near the daily S161 and near the weekly S78 and we have set a score of 1 (for daily) and 2 (for weekly), if that happens. AUDCHF has a score of 1 point because the price is near the daily S161 and we have set a score of 1 (for daily), if that happens. AUDJPY is similar to AUDCHF. Please note, that PP does not get score points, because it is neither support nor resistance. |
5. Scanning pairs for candlestick pattern in two timeframes
We want to search the pairs for patterns (e.g. Engulfing and Pinbar-Pattern) and we do not want to have to open every chart for this task. Our preferred timeframes are H4 and D1. Let the dashboard do the work for us.
What we set ...
| Use PA section | true |
| Timeframe of Price Action - TF 1 | 4 Hours |
| Score "bullish Engulfing" | 1 |
| Score "bearish Engulfing" | -1 |
| Score "bullish Pinbar" | 1 |
| Score "bearish Pinbar" | -1 |
| ---- | ---- |
| Timeframe of Price Action - TF 2 | 1 Day |
| Score "bullish Engulfing" | 3 |
| Score "bearish Engulfing" | -3 |
| Score "bullish Pinbar" | 3 |
| Score "bearish Pinbar" | -3 |
... and what we get
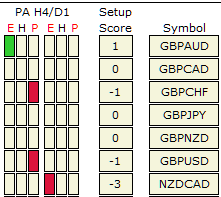 | The E and P (stands for Engulfing and Pinbar) are marked in red because we have configured scores for these patterns. GBPAUD - the dashboard has found a bullish Engulfing (green background color) in H4 - so the overall score is +1. GBPCAD, GBPJPY and GBPNZD - no pattern found - no score. GBPCHF and GBPUSD - the dashboard has found a bearish pinbar (red background color) in H4 - so the overall score is -1. NZDCAD - the dashboard has found a bearish Engulfing in D1 - so the overall score is -3. |
6. Conclusion
You've seen how to quickly find simple setups with the Dashboard. But best of all, you can combine all these things together. If you run the dashboard in multiple instances, you can configure an infinite number of setups and you do not have to constantly sit in front of the monitor. And if you prefer to sit on the beach rather than in front of the monitor, then just let all the alerts be sent to you.
Green pips and happy trading!


")