

About
With the SR Dashboard, you get a powerful tool to control some of the most important information in trading. Assemble a setup according to your strategy and get informed as soon as this setup is valid. Assign different points to selected conditions. Choose from Trend, Average Daily Range, Moving Averages, Pivot (Daily, Weekly, Monthly), Highs and Lows, and Candlestick Patterns.
You can find the dashboard in a free version at https://www.mql5.com/en/market/product/34863
The full dashboard can be found here: https://www.mql5.com/en/market/product/34855
Usage
With the SR Dashboard, you will be able to find some interesting trading setups in a faster and smarter way. Some of these setups are described in our new blog series:
- Using the "Netsrac SR Dashboard" (quick guide)
- Trading Pinbars
- Quick Set-Gets with the Dashboard
- Trade the Engulfing Pattern
- Weekly pivot as potential reversal points
- Scalping the short term trend
- Trend trading with important moving averages
- Volatility outbreak
- ... (may continue)
Display of the dashboard
| section | image | description |
|---|---|---|
| symbol |  | Here the symbols are listed. You can open a new chart by clicking on the symbol. If you have assigned a template in the options, this will be used when opening the new chart. You will find the display for the symbol on the left and right side. |
| trend |  | The current (large box) and trend of the previous period (small box) are displayed here. By the way, the trend is calculated from the indicators ADX and Aroon. It is an internal function, not changeable. |
| (A) DR | 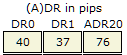 | DR0 - Daily Range of the current day in pips DR1 - Daily Range of the previous day in pips (Sundays are not taken into account) ADR20 - Average Daily Range of past 20 days in pips (Sundays are not taken into account) |
| RSI | 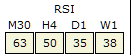 | Watch the RSI in four different timeframes at the same time. You can define an overbought/oversold-Level for each timeframe. |
| Moving Averages | 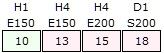 | Here the defined Moving Averages, as well as the respective distance in pips, are indicated to these MA. In this section, you will keep track of four important moving averages from different timeframes. You will see information about the timeframe, mode and period in the headline of this section. The display fields change color when configured thresholds are exceeded or fallen below. |
| Pivot level | 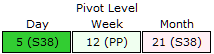 | Here you can see the distances of the price in pips to the nearest pivot level. Here, the Fibonacci levels are calculated on Daily, Weekly and Monthly. Three examples to indicate level: R61 means "Resistance at 61% Retracement", S78 means "Support at 78% Retracement", PP means "Pivot Point". The display fields change color when configured thresholds are exceeded or fallen below. |
| High / low |  | Here the distances are displayed in pips to the nearest daily, weekly or monthly high or low. It does not display the highest high or the lowest low of the respective time span. Shown is the nearest low of any of these periods! The display fields change color when configured thresholds are exceeded or fallen below. |
| Price Action / Candlestick Pattern |  | Here are shown finished candlestick patterns. A distinction is made between Engulfing (E), Hammer (H), Inverted Hammer (H) and Pinbar (P). If one of these patterns is detected, the display field changes accordingly. |
| Setup Score | | Here the respective score of the symbol is displayed. If you have given scores for certain conditions, these are added together and displayed here. As soon as the defined threshold for the score is reached, a notification (alert) is triggered. |
options
Section "SYMBOLS"
| option | description |
|---|---|
| underlyings | A list of underlyings separated by commas. Please make sure that all symbols selected here are also marked as active in MT4. Otherwise, the Dashboard does not provide correct values for this underlying. |
| Single Asset Mode | (Only in the full versions of the dashboard) Use the dashboard in Single Asset Mode to use it for one asset only and get a quick overview for this. |
Section "TREND"
In this section, the settings for the trend display are made. By the way, the trend is calculated from ADX and Aroon. The formula for this is fixed in the program and can not be changed.
| option | description |
|---|---|
| Use trend section | Set this option to false if you do not need it. You save CPU resources. |
| Timeframe 1 | Define the timeframe for the first timeframe to be monitored. As a rule, the timeframe on which the trading decision is made is used here. |
| Trend Up Timeframe 1 | This value will be added to the overall score as soon as the trend in this timeframe is "Long". |
| Score "Trend Down" Timeframe 1 | This value is added to the total score as soon as the trend in this timeframe is "Short". |
| Score "Trend Neutral" Timeframe 1 | This value is added to the total score as soon as the trend in this timeframe is "Neutral". |
| Trend Change Score in Timeframe 1 | This value will be added to the overall score as soon as the trend changes in this timeframe. |
| ... | The use of Timeframe 2 and Timeframe 3 options is no different than Timeframe 1. |
| Color "Trend Up" | Set here the color that should be used to display an "Uptrend". |
| Color "Trend Down" | Set here the color that should be used to display a "Downtrend". |
| Color "Trend Neutral" | Set here the color that should be used to display a "sideways trend". |
Section "(A) DR"
In this section, the settings for the Daily Range and the Average Daily Range are made.
| option | description |
|---|---|
| Use (A) DR section | Set this option to false if you do not need it. You save CPU resources. |
| DR level "critical high" | Enter here a value from which a Daily Range would like to classify as "critically high". Important: This value is given as a percentage! This is the percentage of ADR from 20 days! |
| Score DR level "critical high today" | This value is added to the total score as soon as the daily range's percentage of the current day is above the configured value. |
| Score DR Level "critical high today & yesterday" | This value will be added to the total score as soon as the percentage of the Daily Range of the current day and the previous day is above the configured value. |
| DR Level "critical low" | Enter here a value, from which a Daily Range would like to classify as "critical low". Important: This value is given as a percentage! This is the percentage of ADR from 20 days! |
| Score DR Level "critical low today" | This value will be added to the total score as soon as the percentage of the Daily Range of the current day is below the configured value. |
| Score DR Level "critical low today & yesterday" | This value is added to the total score as soon as the percentage of the Daily Range of the current day and the previous day is below the configured value. |
| Use the score as a multiplier instead of a summand | High volatility is nor bearish either bullish. So you can use the ADR-Score as a multiplier instead of a summand. So you can e.g. double the value of your setup - if it is bullish, it will be "more bullish", with an ADR-Score. If it is bearish, it will be "more bearish". |
| Color DR "normal" | Set here the color that should be used to display a "normal" Daily Range. |
| Color DR "critical low" | Set here the color that should be used to display a "critically low" Daily Range. |
| Color DR "critical high" | Set here the color that should be used to display a "critically high" Daily Range. |
Section "RSI"
| option | description |
|---|---|
| Use RSI section | Set this option to false if you do not need it. You save CPU resources. |
| Timeframe of RSI x | Set the timeframe for the RSI. |
| Period of RSI x | Set the period of the RSI. Use the standard of 14 or any other value. |
| RSI overbought level | Set the overbought level for each RSI |
| RSI oversold level | Set the oversold level for each RSI |
| Score if RSI is overbought | Set a score for the case of overbought RSI |
| Score if RSI is oversold | Set a score for the case of oversold RSI |
Section "MOVING AVERAGES"
| option | description |
|---|---|
| Use Moving Average section | Set this option to false if you do not need it. You save CPU resources. |
| Timeframe of MA 1 | Set the timeframe for the first moving average here. |
| Fashion MA 1 | Set the calculation mode (Simple, Exponential, Smoothed, Linear weighted). |
| Period MA 1 | Set the period number. Important values are for example 20, 50, 100, 150 and 200. |
| Critical Distance to MA 1 | Set the value in pips, from which a distance to the MA should be considered critical. From this value, a score is calculated if you have assigned one. |
| Score MA 1 | If the critical distance is undercut, this value is added to the overall score. |
| Score if lower MA 1 / Score if price is above MA 1 | These options are only available for MA 1. Use these if you want to add a score to the overall score, even if the price has not dropped below the critical distance. You can use it to create a setup that is a moving average, depending on the position of the price. |
| ... | The settings of MA 2 to 4 are similar to those of MA 1. |
| Color MA distance normal - price above MA | Set here the color that will be used when the price is above the MA. |
| Color MA distance critical - price above MA | Set here the color, which is used, if the price is above the MA and the "critical distance" was fallen below. |
| Color MA distance normal - price below MA | Set here the color that will be used when the price is below the MA. |
| Color MA distance critical - price below MA | Set here the color, which is used, if the price is below the MA and the "critical distance" was fallen below. |
Section "PIVOT LEVEL"
| option | description |
|---|---|
| Use Pivot Section | Set this option to false if you do not need it. You save CPU resources. |
| Critical Distance to Daily Pivot (pips) | Set the value in pips above which a distance to the pivot should be considered critical. From this value, a score is calculated if you have assigned one. |
| Score if Price is at critical distance to Daily Pivot | If the critical distance is undercut, this value is added to the overall score. |
| Score Daily Pivot at Resistance | This value is added when the price is at a resistance pivot. |
| Score Daily Pivot at Support | This value is added when the price is at a support pivot. |
| ... | The settings of the Weekly and Monthly Pivots are similar to those of the Daily Pivot. |
| Color Pivot distance normal - price is below Pivot | Set here the color that will be used when the price is below the pivot. |
| Color Pivot distance critical - price is below Pivot | Set here the color, which is used, if the price is under the pivot and the "critical distance" was fallen below. |
| Color Pivot distance normal - price is above Pivot | Set here the color that will be used when the price is above the pivot. |
| Color Pivot distance critical - price is above Pivot | Set here the color, which is used, if the price is above the pivot and the critical distance was undercut. |
Section "HIGH / LOW"
| option | description |
|---|---|
| Use High / Low section | Set this option to false if you do not need it. You save CPU resources. |
| Days to look back | Enter here the number of days with which you want to compare highs and lows. |
| Critical Distance to High / Low Daily | Set the value in pips, from which a distance to the high or low should be considered critical. From this value, a score is calculated if you have assigned one. |
| Score if Price is at critical distance to Daily H / L | This value is added when the price is at a critical distance to a high or low. |
| ... | The settings for the Weekly and Monthly highs and lows are similar to those of the Daily highs and lows. |
| Color "distance between price and low" normal | Set here the color that will be used when the price is at a normal distance to the next low. |
| Color "distance between price and low" critical | Set here the color, which is used, if the price is at a critical distance to the next low. |
| Color "distance between price and high" normal | Set here the color that will be used when the price is at a normal distance to the next high. |
| Color "distance between price and high" critical | Set here the color that will be used when the price is at a critical distance to the next high. |
Section "PRICE ACTION / CANDLESTICK PATTERN"
| option | description |
|---|---|
| Use PA section | Set this option to false if you do not need it. You save CPU resources. |
| Timeframe of Price Action - TF 1 | Set the first timeframe for the patterns. |
| Score Engulfing, Hammer / Inverted Hammer, Pinbar | This value is added if a pattern could be found in the selected timeframe and the last period. |
| .... | The settings in timeframe 2 are identical to those of the first timeframe. |
| Color if there is no pattern | Set here the color, which is used, if no pattern could be found. |
| Color if there is a "bullish pattern" | Set here the color, which is used, if a bullish pattern could be found. |
| Color if there is a "bearish pattern" | Set here the color, which is used, if a bearish pattern could be found. |
Section "COLORS / APPEARANCE"
| option | description |
|---|---|
| Caption font / fontsize / color | Set here the font, font size and color for the headlines. |
| Values font / fontsize / color | Set here the font, font size and color for the values. |
| Symbols font / fontsize / color | Set the font, font size and color for the symbols here. |
| Color of symbol background | Set the background color of the icons. |
| Color of symbol background if alert is active | Set the background color of the icons when an alarm is active (ie the threshold has been exceeded in the score). |
Section "ALERT / SYSTEM"
| option | description |
|---|---|
| Alert, if score is greater or equal to ... | Set the (positive) value from which an alarm is generated. If the overall score is greater than or equal to this value, an alarm is triggered. |
| Alert, if score is smaller or equal to ... | Set the (negative) value from which an alarm is generated. If the overall score is less than or equal to this value, an alarm is triggered. |
| Use screen alert | Use the screen alert (true) or not (false). |
| Use Notifier Alert | Use the Notifier alert (for example, for the smartphone) (true) or not (false). |
| Use Mail Alert | Use the mail alert (true) or do not use (false). |
| Timeout for alerts in minutes | The alert is suspended for this count of minutes to prevent persistent alarms when value changes occur. |
| Alerts from this hour | You get alerts (if you have set them) from this hour ... |
| Alerts until (including) this hour | ... until (and including) this hour. If you want alerts around the clock, enter 0 here and 0 in the option above. |
| Name of template for charts to open | Enter here the name of a template, which should be used for charts to be opened. Clicking on an underlying-symbol will open a chart with this template. |
| Errorlog | This function is only needed in case of error and has no function for you. Leave this option to false. |
A few words to the score-system
For each condition that can be found with the dashboard, you can give a "score". This "score" can have a value from -3 to +3. For example, if a condition was found that has a score of +2 and another condition was found that has a score of +3 - then we have a total score of +5. Now you can configure thresholds for an alert, one for a negative "setup-value" and one for positive "setup-value".
It is very important that you understand this concept! Feel free to contact me, if you have trouble to understand it!
Get the full version for MT4: https://www.mql5.com/en/market/product/34855
Get the lite version for MT4: https://www.mql5.com/en/market/product/34863
Get the full version for MT5: https://www.mql5.com/en/market/product/56701
Good Luck and green pips to you!


")