

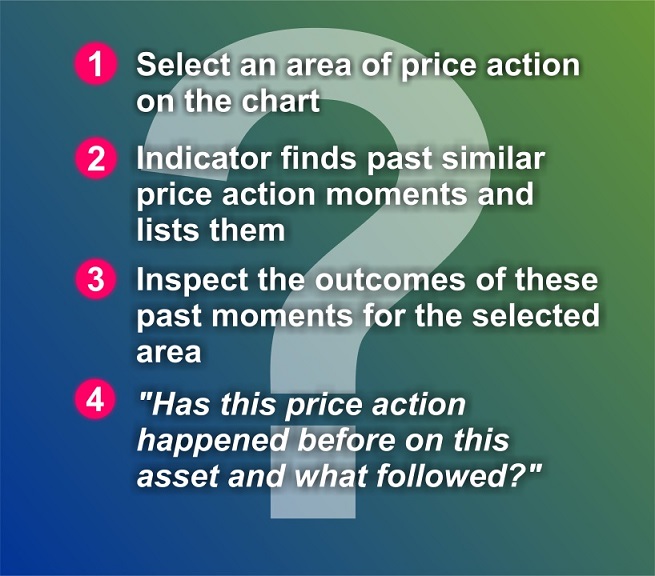
What is the Similar Price Action indicator?
For a symbol and timeframe if we take any region of it's price action we can compare it against every other region of the same symbol and timeframe.
If the comparison is rapid enough we can pull estimates for what could happen in real time.
We can then project those estimates unto our original selected region.
MT5 version : https://www.mql5.com/en/market/product/133318
MT4 version : https://www.mql5.com/en/market/product/133347
Display settings :
- Theme : select one of the 2 display themes
- Font size mode : Select auto for the indicator to decide on the best size of it's panel or select manual if you want to specify the font size yourself in the input field Font Size (if manual).The entire deck is redesigned on it's own based on the font size you provide.
- Result table rows : Enter the amount of rows you want on the deck . This does not affect how many similar price action sequences are selected rather it sets the size of the table.
- Style halo with theme : If true the on chart markings will be styled similarly to the selected theme . If you set this to false then you can find additional display settings for the on chart elements and adjust them to your liking.
SimiPac search engine settings :
- Max results to collect : This figure defines how many "top" most similar sequences will be retained for inspection. Before selection the sequences are sorted descending based on their score and the top amount makes it to the results table.
- Predictions bars/candles : This sets the size of the prediction (right side of sequences) area in bars.While you can freely drag and select as many candlesticks as you like for the left side the right side result area is controlled by this parameter
- Deflection in bars/candles : One of the biggest issues with patterns is sequential similarity.If a sequence of candles is similar to another one then if we move one bar to the left on that sequence it will still be similar resulting in some useless entries around the same area.
To avoid this we keep the highest scoring one that is at least this many bars (of this setting) away from any other sequence left or right. - Antebars comparison method : This is the method used to compare the left sides of the sequences.
- relative with open : the calculation of each price point is subtracted from the open price of the sequence and divided by the vertical size of the sequence
- absolute with open : the calculation of each price point is subtracted from the open price of the sequence but is not divided since we are comparing sequences of the same asset and timeframe
- relative from min value : from the calculation of each price point we subtract the bottom and divide by the vertical size of the sequence.This is the default selection and it ensures we will be getting similar comparison ranges across any sequence
- absolute from min value : from the calculation of each price point we subtract the bottom and dont divide anything.
- H->L comparison weight : how important is the High to Low size in the price comparison
- O->C comparison weight : how important is the Open to Close size in the price comparison
- Antebars comparison price weight : how important is the overall price comparison for the ranking (vs indicator comparisons later on)
- Ma comparison method : Relative will compare the MAs of 2 sequences adjusted to their ranges , absolute will compare them without adapting their range sizes
- Ma comparison weight : how important is the ma comparison for the ranking
- Atr comparison method : Relative will compare the ATRs of 2 sequences adjusted to their ranges , absolute will compare them without adapting their range sizes. A relative setting here detects volatility shifts while an absolute setting matches similar volatilities
- Atr comparison weight : how important is the atr comparison for the ranking
- Rsi comparison method : same as the other 2 , relative and absolute , although rsi is quite bound on its own so an absolute setting is okay
- Rsi comparison weight : how important is the rsi comparison for the ranking
- Volume map mode :
Activity : Will display where the right side (results) of the sequences tend to spend most of the volume , similarly to a volume profile
Aversion : Will display which areas have resulted the most swings within the results . Where theres price aversion in other words.
Think of these 2 like magnet poles . Activity shows attraction aversion shows repulsion. - Volume map sectors : to save on calculations we dont store each price point for constructing the volume map . Essentially this divides the right side projection of your selected region into how ever many sectors you specify here and it grades them.Set it to 0 to use everything it finds.
- Volume map :: ignore % of avg bar size around open : projecting all these results on the volume map had an inherent flaw.Everything starts from the close price of the left side of your selected sequence . So that would make all maps useless as most activity would be on the open price of the projection . To counter this we require results bars to have exited above or below 1.618 times the average volatility of the asset before grading the volume map.So if one of the resulting candlestick sequences starts at the open price and falls we wont register that as a swing simply because it started within the ignore range.
- The periods for all fast and slow indicators follow
- Halo cover color : The halo is the projection of a sequence over another sequence . The cover is a color we specify to slightly obscure the normal chart in order to make the overlays more visible . You can alter the color and the opacity (0->255) where 0 is totally invisible and 255 fully visible. This is finally filtered by the slider for visibility on the deck.
Download the demo here :
You can download an unlimited for EURUSD only demo that works on the live chart here.
The strategy tester kinda butchers the features so feel free to test with this version.
Download and place in indicators folder , no other requirements , no DLLs , all settings available.
Thank you .

Files:


")
![[XAUUSD]: Weekly Liquidity Activation Points (timings), June 22-26, 2026](https://c.mql5.com/6/1013/splash-preview-771790.png "[XAUUSD]: Weekly Liquidity Activation Points (timings), June 22-26, 2026")
")