This is the fifth episode of a blog series on how to use the „Netsrac SR Dashboard" (SRD) to find trading opportunities. The SRD is designed to reduce your time in front of the monitor. It can find many setups for us. All we have to do is trade those setups.
I have been asked by some people how to operate the dashboard correctly. That's why I want to start this blog series. We will cover the following topics:
- Using the "Netsrac SR Dashboard" (quick guide)
- Trading Pinbars
- Quick Set-Gets with the Dashboard
- Trade the Engulfing Pattern
- Weekly pivot as potential reversal points
- Scalping the short term trend
- Trend trading with important moving averages
- Volatility outbreak
- ... (may continue)
In order to find the best entry into a swing, we need relevant price tags or price zones. We use the pivots for this. In fact, we use Weekly Fibo-pivots, which are based on Fibonacci numbers and are based on the price movement of the past trading week. We assume that many traders will pay attention to these pivots and the price will therefore react there. Of special relevance are the 38, 61, 78 and 100 Pivots. We will also take a special look at these. We also look at the Daily Range. This is to identify currency pairs that may tend to pullback or to consolidate.
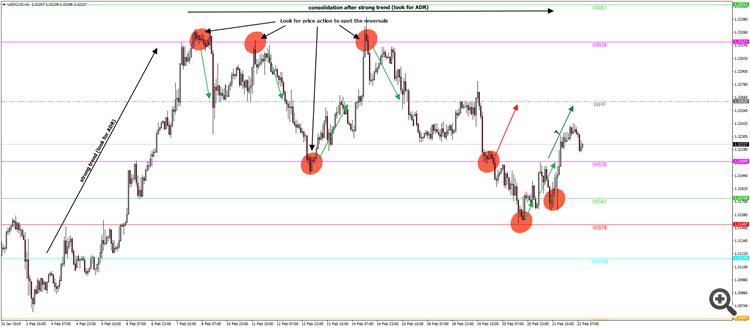
Please also look at the following picture, it shows what we want to pay attention to. The red dots show potential reversal zones, the green lines are the swings, we are looking for. The red line is a potential loser - but bear in mind, you need to look at price action, in every case.
- We want to monitor the ADRs to better predict consolidation. So we have to activate the section "(A)DR" in SRD.
- We want to be informed when the price is near a relevant price (pivot) level. So we activate the section "PIVOT LEVEL" in SRD.
- We don't need other information for this strategy. So please deactivate (set "false") all other sections. (Of course, you can add other sections (like Candlestick pattern) to get better signals, but we don't want to make it too complicated at this time.)
| Variable in SR Dashboard-Options | Value |
|---|---|
| Use Trend section | false |
| Use (A)DR section | true |
| Use RSI section | false |
| Use Moving Average section | false |
| Use Pivot section | true |
| Use High/Low section | false |
| Use PA section | false |
First look at the dashboard
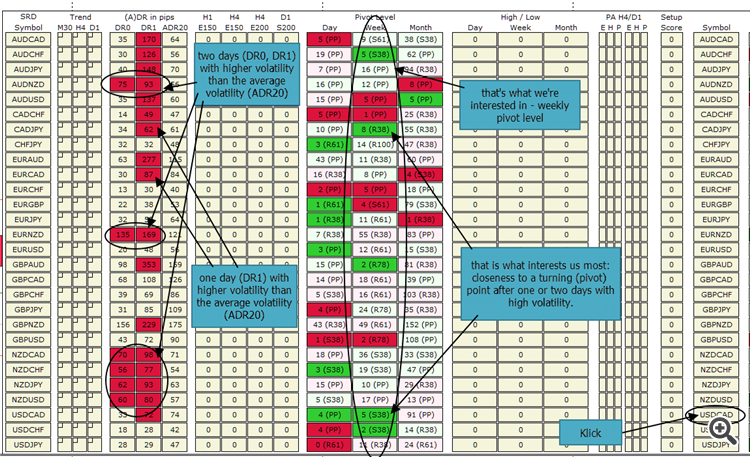
Now let's take a look at our dashboard. It should look like the following picture (without the "paintings", of course ;-) ).
Look again and think twice, what is the dashboard showing?
Look at the pairs with a potential setup
Now take a look at USDCAD. Why? We had a high volatility yesterday and the price is at the S38 Pivot.
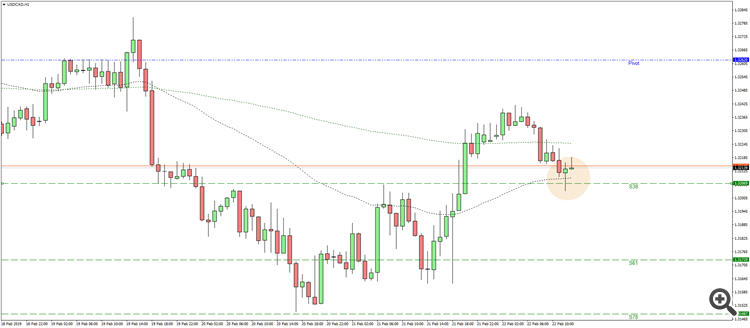
So let's open a chart with USDCAD. You can make this little step easier by clicking on the symbol-icon in the right or left of the dashboard and perhaps even setting a template before. But we'll come to that later - maybe.
You see, the price is at S38 and we have a bullish pinbar and we had a downswing after a little uptrend. It's a long, isn't it? It's up to you.
Configure an Alert for your setup
Now it would be nice that we do not have to sit in front of the monitor to search for a setup. To do that, we need to think about how the dashboard generates alerts.
For each condition that can be found with the dashboard, we can give a "score". This "score" can have a value from -3 to +3. For example, if a condition was found that has a score of +2 and another condition was found that has a score of +3 - then we have a total score of +5. Now you can configure thresholds for an alert, one for a negative "setup-value" and one for positive "setup-value". Also important to understand: A high volatility is nor bearish either bullish. So we have to use the ADR-Score as a multiplier instead of a summand. So you can e.g. double the value of your setup - if it is bullish, it will be "more bullish", with an ADR-Score. If it is bearish, it will be "more bearish".
It is very important that you understand this concept! Feel free to contact me, if you have trouble to understand it!
Let's think again about what we really want.
- We want to find the pairs that had a huge daily range yesterday or today.
- We want to find the pairs whose price is at a pivot level.
- We want to find bullish setups (price is at a support pivot-level) and rate it with a positive score.
- We want to find bearish setups (price is at a resistance pivot-level) and rate it with a negative score.
- We want to make bullish setups "more bullish", if the Daily Range today or yesterday is higher than the average daily range. Vice versa for bearish setups.
- We want alerts for both setups.
How we can accomplish these tasks? Easy, if you know what you have to do!
Our settings including scores and alerts:
| Variable in SR Dashboard-Options | Value |
|---|---|
| (A)DR section | ---- |
| DR Level "critical high" | 100 (That's the threshold for the percentage value of the average range) |
| Score DR "critical high today" | 2 |
| Score DR "critical high yesterday" | 2 |
| Use the score as a multiplier instead of a summand | true (so the score for DR will be used as multiplier) |
| PIVOT LEVEL section | ---- |
| Critical Distance to Weekly Pivot (pips) | 8 |
| Score Weekly Pivot at Resistance | -3 (it is a negative score, because it's a bearish setup) |
| Score Weekly Pivot at Support | 3 (it is a positive score, because it's a bullish setup) |
| ALERT / SYSTEM section | ---- |
| Alert, if score is greater or equal to ... | 6 (because we want the price at Support-Pivot (+3) and we want a high volatility today or yesterday (multiplier 2) |
| Alert, if score is smaller or equal to ... | -6 (because we want the price at Resistance-Pivot (-3) and we want a high volatility today or yesterday (multiplier 2) |
| Use Screen-Alert | true (in this case, we want the alerts at the screen - you can configure mobile notifications or emails too) |
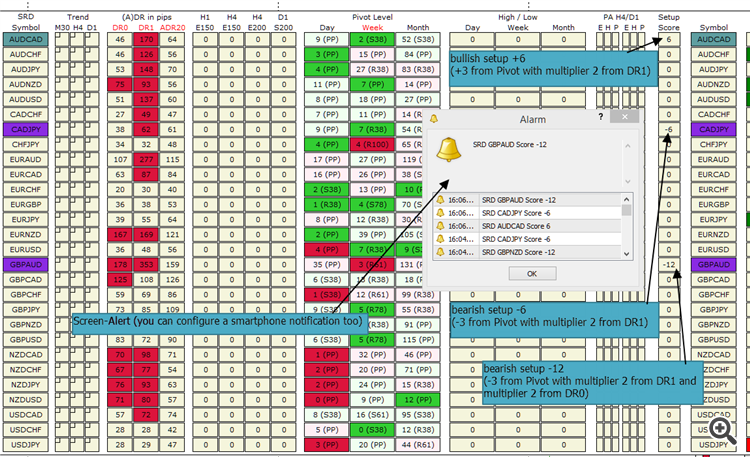
Let's take a look at our dashboard now:
That's all. Now we have configured our SR Dashboard to find weekly pivot points in pairs with high volatility. Attached you will find a set file so you can start right away.
Get the full version: https://www.mql5.com/en/market/product/34855
Get the lite version: https://www.mql5.com/en/market/product/34863
Good Luck and green pips to you!


