
Why entering on a pullback is safer than entering on a breakout

Why entering on a pullback is almost always safer than entering on a breakout
When the price exceeds the previous high or low, the movement is often already in an active phase, and the trader opens a position after a strong impulse.
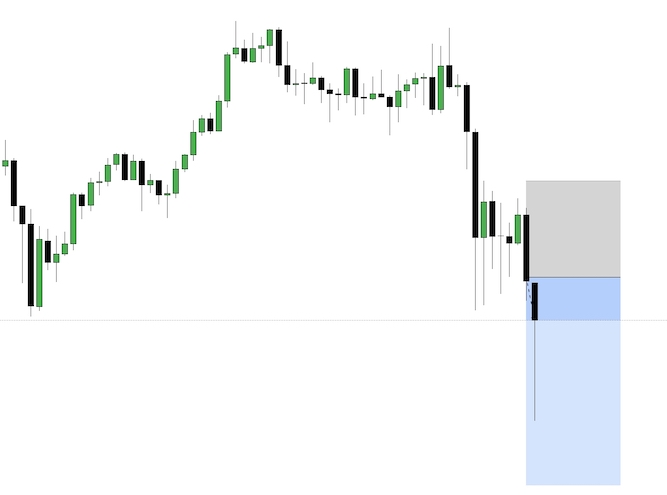
Fig. 1. Example of a breakout trade
At first glance, such an entry seems logical: the market is moving, so the movement will continue. However, in practice, the price very often corrects after an impulse. If the entry is made at the very breakout, the position can almost immediately fall into a pullback. Even if the direction of the trade is chosen correctly, the temporary drawdown can be quite deep.
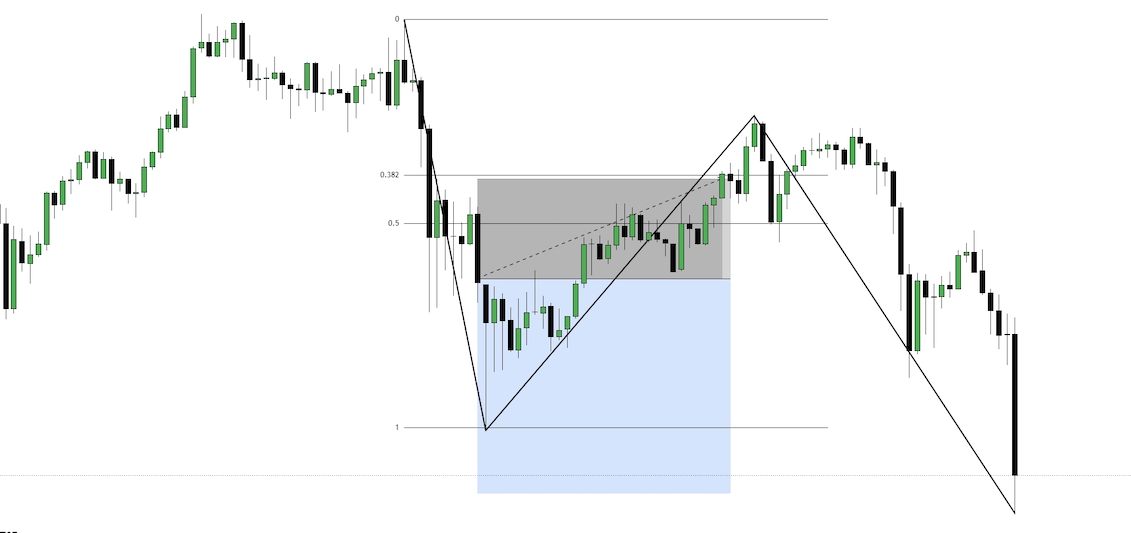
Fig. 2. Example of a correction after an impulse and further continuation of the movement
Entering the market at the moment of a breakout
Entering the market at the moment of a breakout is an attempt to join a movement that has already begun. The trader opens a position at the moment when the price goes beyond the previous range or updates the extreme.
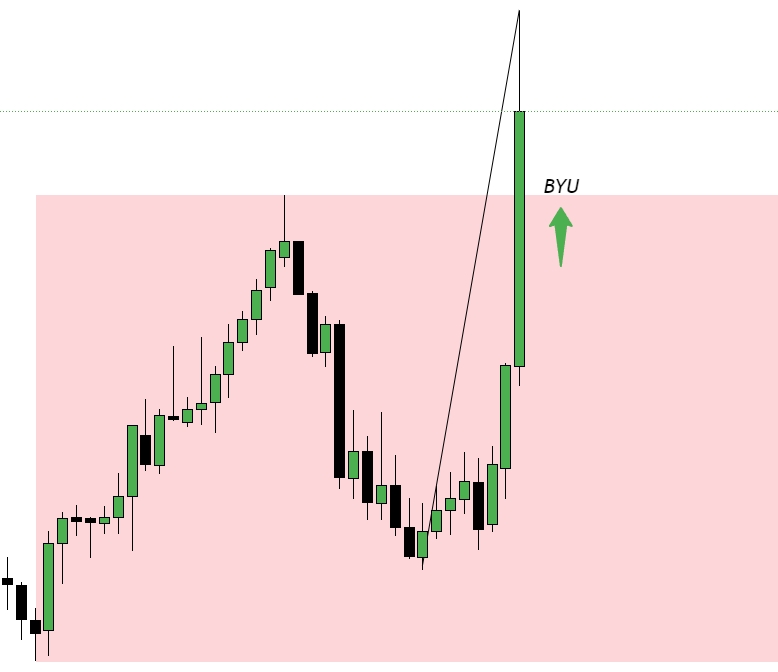
Fig. 3. Example of opening a trade at a breakout
The main problem with this type of entry is that the price has already completed part of the movement. After a strong impulse, the market often reverses, forming a correction.
As a result, a position opened on a breakout may immediately come under pressure from a pullback. In addition, StopLoss in such trades usually has to be placed further from the entry point, which worsens the risk/reward ratio.
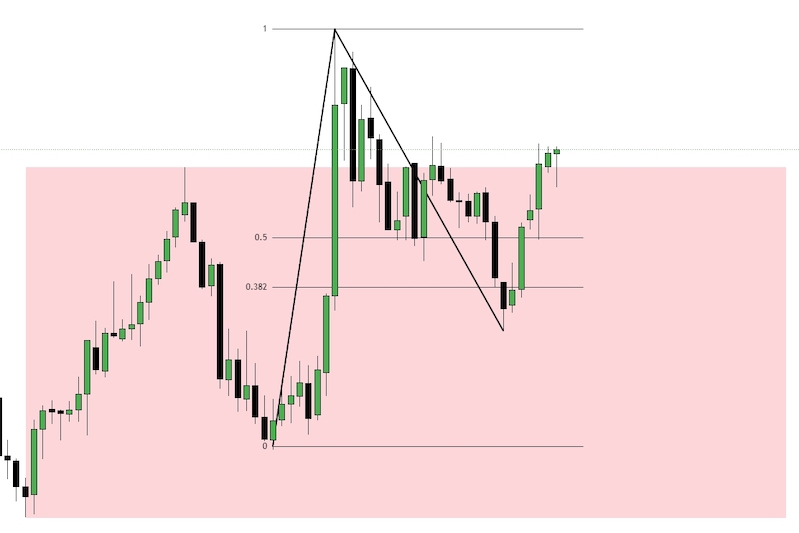
Fig. 4. Example of a correction after a breakout
Entering the market after a correction
Another approach is to wait for a correction after an impulse movement and look for an entry point on the pullback.
With this type of trading, you do not try to enter a movement that has already gone a significant part of the way. Instead, you wait for the price to pull back and return to previous levels.
These are exactly the situations that are easy to find with the Owl Smart Levels. The indicator shows the direction of movement through Valable ZigZag and also marks fractals that can be used to build Fibonacci levels. When the price returns to these levels, a zone appears where the correction may end and the trend may continue.
At this point, a trader has the opportunity to open a position closer to the level where the risk of the trade becomes clear and controllable. StopLoss can be placed behind the nearest level, and the potential trend movement remains ahead.
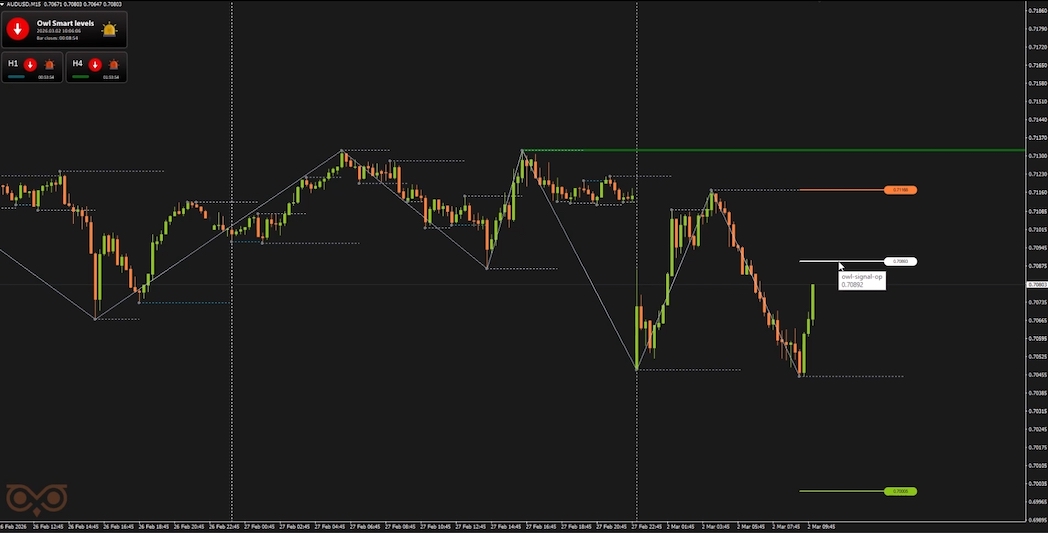
Fig. 5. Example of a signal from the Owl Smart Levels indicator after a correction
In fact, a trader opens a position not at the moment of an already accelerated movement, but when the correction is about to end and there is a possibility of the trend continuing.
For more information on how such pullbacks are formed and why they occur in a trend, see the article “How correction levels work in a trend.”
If you want to learn more about the Owl Smart Levels strategy itself and see real examples of how it works, I recommend checking out the following materials:
Recommended for reading
I'm Sergei Ermolov, follow me and don't miss more useful tools for profitable trading on the Forex market.


 & AMD Framework")
