Simple Mean Reversion Trading Strategy

Introduction
Mean reversion is a type of contrarian trading where the trader expects the price to return to some form of equilibrium which is generally measured by a mean or another central tendency statistic. This article discusses a really simple mean reversion trading strategy.
Quick Introduction to Mean Reversion
Markets generally move in irregular cycles. This means that, when we look at the charts, we tend to see ups, downs, and relatively flat phases. The key to trading and investing is to be able to determine the changes in these phases which are also called market regimes.
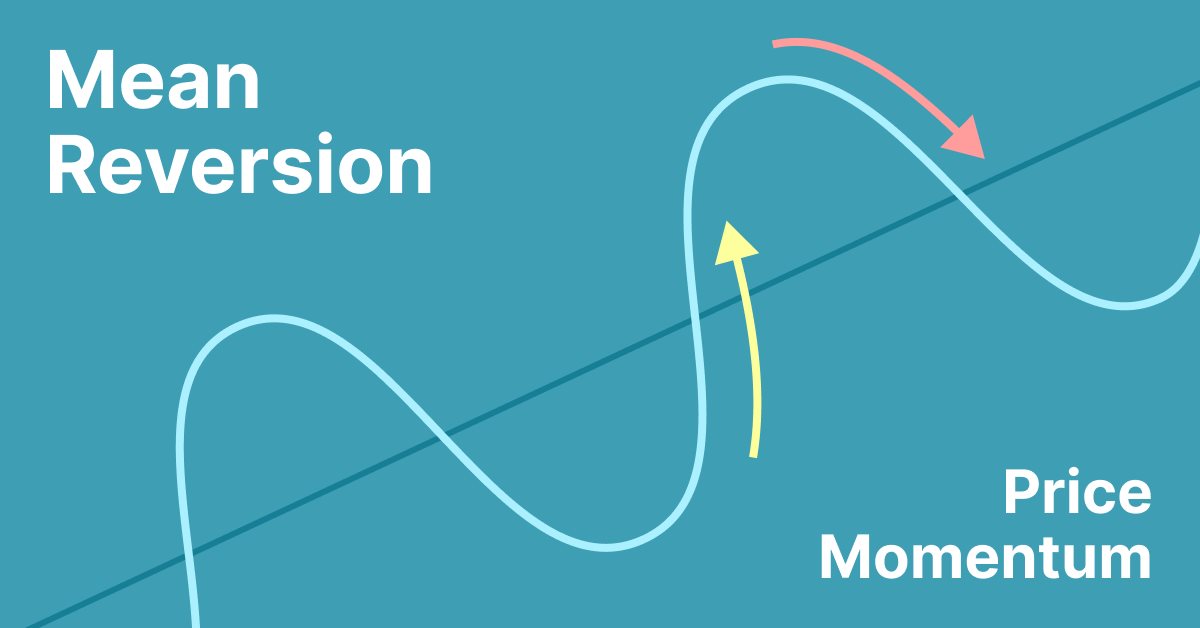
Mean reversion can be in the form of a moving average where if the market goes too far from it, it is likely to go back to its area.
What is Mean Reversion?
Mean reversion is a financial term for the assumption that an asset's price will tend to converge to the average price over time.
Using mean reversion as a timing strategy involves both the identification of the trading range for a security and the computation of the average price using quantitative methods. Mean reversion is a phenomenon that can be exhibited in a host of financial time-series data, from price data, earnings data, and book value.
When the current market price is less than the average past price, the security is considered attractive for purchase, with the expectation that the price will rise. When the current market price is above the average past price, the market price is expected to fall. In other words, deviations from the average price are expected to revert to the average. This knowledge serves as the cornerstone of multiple trading strategies.
Stock reporting services commonly offer moving averages for periods such as 50 and 100 days. While reporting services provide the averages, identifying the high and low prices for the study period is still necessary.
Mean reversion has the appearance of a more scientific method of choosing stock buy and sell points than charting, because precise numerical values are derived from historical data to identify the buy/sell values, rather than trying to interpret price movements using charts (charting, also known as technical analysis) although the RSI indicator and Average True Range (ATR) are nascent attempts to capture such systematic pattern.
Many asset classes, even exchange rates, are observed to be mean reverting; however, this process may last for years and thus is not of value to a short-term investor.
Mean reversion should demonstrate a form of symmetry since a stock may be above its historical average approximately as often as below.
A historical mean reversion model will not fully incorporate the actual behavior of a security's price. For example, new information may become available that permanently affects the long-term valuation of an underlying stock. In the case of bankruptcy, it may cease to trade completely and never recover to its former historical average.
In finance, the term "mean reversion" has a slightly different meaning from "return or regression to the mean" in statistics. Jeremy Siegel uses the term "return to the mean" to describe a general principle, a financial time series in which "returns can be very unstable in the short run but very stable in the long run." Quantitatively, it is the standard deviation of average annual returns that declines faster than the inverse of the holding period, implying that the process is not a random walk, but that periods of lower returns are then followed by compensating periods of higher returns, for example in seasonal businesses.
The following Figure illustrates the example.

But how do we measure ‘too far’? We will try a very simple way based only on the position of the price relative to the moving average.
Designing the Strategy
Now that we have a 50-period normalized distance between the market and its 200-period moving average, we are ready to code the following trading signals:
- A long (buy) signal is generated whenever the normalized index drops from 100 after being equal to 100 while the current close price is less than the close price five periods ago and below the 200-period moving average.
- A short (sell) signal is generated whenever the normalized index drops from 100 after being equal to 100 while the current close price is above the close price five periods ago and above the 200-period moving average.
So, this may not be the simplest strategy ever given the conditions, but nevertheless, it is very intuitive and straightforward. The signal function is as follows:
From the last section, we have clear objectives to start designing the strategy:
- A long (buy) signal is generated whenever the market goes so far below its moving average that it is likely to revert to the mean higher.
- A short (sell) signal is generated whenever the market goes so far above its moving average that it is likely to revert to the mean lower.
I will make a modification to the strat to try to get better results where the strategy does not work well (when the equity goes down). I will modify this of the strat:
- Instead of looking the last closes, I will look up, the high's and low's, to try to filter better orders.
The orders open less often.
This is the code modified:
if(previousValue==100)
        {
         if(Normalizado<100 && array_ma[0]>tick.bid  && rates[5].high < rates[1].low )
           {
            Print("Open Order Buy");
            Alert(" Buying");
            Orden="Buy";
            sl=NormalizeDouble(tick.ask - ptsl*_Point,_Digits);
            tp=NormalizeDouble(tick.bid + pttp*_Point,_Digits);
            //trade.Buy(get_lot(tick.bid),_Symbol,tick.bid,sl,tp);
            trade.PositionOpen(_Symbol,ORDER_TYPE_BUY,get_lot(tick.bid),tick.bid,sl,tp,"Buy");
           }
         if(Normalizado<100 && array_ma[0]<tick.ask  && rates[5].low > rates[1].high )
           {
            Print("Open Order Sell");
            Alert(" Selling");
            Orden="Sell";
            sl=NormalizeDouble(tick.bid + ptsl*_Point,_Digits);
            tp=NormalizeDouble(tick.ask - pttp*_Point,_Digits);
            //trade.Sell(get_lot_s(tick.ask),_Symbol,tick.ask,sl,tp);
            trade.PositionOpen(_Symbol,ORDER_TYPE_SELL,get_lot(tick.ask),tick.ask,sl,tp,"Sell");

           }
        }
With theese changes, the strat wins less but looks more stable (sl = 4000 pts).


This EA must be optimized to get better results. You can also variate the code. This is an example of what you can see the strat with an sl of 300 for 30 minutes period. Just search for the best fit according to the symbol and the tyme period used.


The graph seems more stable with sl of 300 pts but more profitable for 4000 pts of sl. We should make an optimization for sl to find a balance for 30 minutes period. But this job I will leave it for you.
Code
This are the inputs
input ENUM_LOT_TYPE        inp_lot_type               = LOT_TYPE_FIX;              // type of lot
input double               inp_lot_fix                = 0.01;                        // fix lot
input double               inp_lot_risk               = 0.01;
input bool     InpPrintLog          = false;       // Print log
ulong                    Expert_MagicNumber       =66777;            //
bool                     Expert_EveryTick         =false;            //
input ENUM_TIMEFRAMES my_timeframe=PERIOD_CURRENT;                  // Timeframe
int    handle_iMA;
input int                  Inp_MA_ma_period     = 200;          // MA: averaging period
input int                  Inp_MA_ma_shift      = 5;           // MA: horizontal shift
input ENUM_MA_METHOD       Inp_MA_ma_method     = MODE_SMA;    // MA: smoothing type
input ENUM_APPLIED_PRICE   Inp_MA_applied_price = PRICE_CLOSE; // MA: type of price
int shift = 49; // loockback normalization
input int ptsl = 350; // points for stoploss
input int pttp = 5000; // points for takeprofit
The first line sets the type of lot to be used, which is a fixed lot size. The next line sets the size of the fixed lot, followed by the size of the risk lot. The next line sets a boolean value to determine whether to print a log or not. The following line sets the magic number for the expert. The next line sets a boolean value to determine whether the expert should be executed on every tick or not. The next line sets the timeframe for the expert. The next few lines set the parameters for the moving average indicator, such as the averaging period, horizontal shift, smoothing type, and type of price. The next line sets the shift for the normalization of the lookback. The next two lines set the points for the stoploss and takeprofit.
In OnInit():
int OnInit()
  {
//---
   handle_iMA=iMA(_Symbol,my_timeframe,Inp_MA_ma_period,Inp_MA_ma_shift,
                  Inp_MA_ma_method,Inp_MA_applied_price);

// Initialize the variable here if needed
   previousValue = 0.0;

//---
   return(INIT_SUCCEEDED);
  }
This code is written in MQL5 language and is used to initialize a variable. The first line of code creates a handle for the iMA function, which is used to calculate the moving average of a given symbol over a specified timeframe. The parameters of the iMA function are set to the values of the input variables Inp_MA_ma_period, Inp_MA_ma_shift, Inp_MA_ma_method, and Inp_MA_applied_price. The second line of code initializes the variable previousValue to 0.0. The last line of code returns a value of INIT_SUCCEEDED, which indicates that the initialization was successful.
In OnTick():
MqlTick tick;
   double last_price = tick.ask;
   SymbolInfoTick(_Symbol,tick);
and
   if(SymbolInfoTick(_Symbol,tick))
      last=tick.last;

   double Last = NormalizeDouble(last,_Digits);
This code is written in the MQL5 language and is used to compare the current ask price of a symbol to the last ask price. The first line creates a variable called 'tick' of type MqlTick. The second line stores the last ask price in the variable 'last_price'. The third line retrieves the tick information for the symbol specified in the variable '_Symbol' and stores it in the variable 'tick'. The fourth line checks if the current ask price is greater than the last ask price stored in the variable 'last_price'. If it is, then something is done.
This code is used to calculate the spread percentage of a given symbol. It starts by retrieving the last price of the symbol using the SymbolInfoTick() function. The last price is then normalized to the number of digits specified by the _Digits parameter. If the normalized last price is greater than 0, the ask and bid prices of the symbol are retrieved and normalized. The spread is calculated by subtracting the normalized bid price from the normalized ask price. The spread is then divided by the point value of the symbol (calculated using the Pow() function) to get the spread in points. Finally, the spread in points is divided by the normalized last price and multiplied by 100 to get the spread percentage. If the spread percentage is less than or equal to the Max_Spread parameter, some action is taken.
For the MA we will use this:
   handle_iMA=iMA(_Symbol,my_timeframe,Inp_MA_ma_period,Inp_MA_ma_shift,
                  Inp_MA_ma_method,Inp_MA_applied_price);
//---
   double array_ma[];
   ArraySetAsSeries(array_ma,true);
   int start_pos=0,count=3;
   if(!iGetArray(handle_iMA,0,start_pos,count,array_ma))
      return;
   string text="";
   for(int i=0; i<count; i++)
      text=text+IntegerToString(i)+": "+DoubleToString(array_ma[i],Digits()+1)+"\n";
//---
   Comment(text);
bool iGetArray(const int handle,const int buffer,const int start_pos,
               const int count,double &arr_buffer[])
  {
   bool result=true;
   if(!ArrayIsDynamic(arr_buffer))
     {
      //if(InpPrintLog)
      PrintFormat("ERROR! EA: %s, FUNCTION: %s, this a no dynamic array!",__FILE__,__FUNCTION__);
      return(false);
     }
   ArrayFree(arr_buffer);
//--- reset error code
   ResetLastError();
//--- fill a part of the iBands array with values from the indicator buffer
   int copied=CopyBuffer(handle,buffer,start_pos,count,arr_buffer);
   if(copied!=count)
     {
      //--- if the copying fails, tell the error code
      //if(InpPrintLog)
      PrintFormat("ERROR! EA: %s, FUNCTION: %s, amount to copy: %d, copied: %d, error code %d",
                  __FILE__,__FUNCTION__,count,copied,GetLastError());
      //--- quit with zero result - it means that the indicator is considered as not calculated
      return(false);
     }
   return(result);
  }
This code is used to calculate and display the moving average (MA) of a given symbol on a given timeframe. The iMA() function is used to calculate the MA, and the iGetArray() function is used to retrieve the MA values from the indicator buffer. The ArraySetAsSeries() function is used to set the array as a series, and the IntegerToString() and DoubleToString() functions are used to convert the array values into strings. Finally, the Comment() function is used to display the MA values in the chart.
To not get volume errors when opening orders we will use this:
//<<<<<<<<<<<<<<<<<<<<<<<<<<<<<<<<<<<<<<<<<<<<<<<<<<<<<<<<<<<<<<<<<<<<<<<<<<<<<<<<<<<<<<<<<<<<<<<<<<<<<<<<<<<<<<<<<<<<<<<<<<<<<<<<<<<<<<<<<<<<<<<<<<<<<<<<<<<<
double get_lot(double price)
  {
   if(inp_lot_type==LOT_TYPE_FIX)
      return(normalize_lot(inp_lot_fix));
   double one_lot_margin;
   if(!OrderCalcMargin(ORDER_TYPE_BUY,_Symbol,1.0,price,one_lot_margin))
      return(inp_lot_fix);
   return(normalize_lot((AccountInfoDouble(ACCOUNT_BALANCE)*(inp_lot_risk/100))/ one_lot_margin));
  }
//+------------------------------------------------------------------+
//<<<<<<<<<<<<<<<<<<<<<<<<<<<<<<<<<<<<<<<<<<<<<<<<<<<<<<<<<<<<<<<<<<<<<<<<<<<<<<<<<<<<<<<<<<<<<<<<<<<<<<<<<<<<<<<<<<<<<<<<<<<<<<<<<<<<<<<<<<<<<<<<<<<<<<<<<<<<
double normalize_lot(double lt)
  {
   double lot_step = SymbolInfoDouble(_Symbol,SYMBOL_VOLUME_STEP);
   lt = MathFloor(lt / lot_step) * lot_step;
   double lot_minimum = SymbolInfoDouble(_Symbol,SYMBOL_VOLUME_MIN);
   lt = MathMax(lt, lot_minimum);
   return(lt);
  }
This code is used to calculate the lot size for a buy order. The first function, get_lot(), takes in a price as an argument and returns the lot size. The lot size is determined by the lot type, which is either fixed or based on the risk percentage. If the lot type is fixed, the function returns the normalized lot size. If the lot type is based on the risk percentage, the function calculates the margin for one lot, calculates the lot size based on the balance and the risk percentage, and returns the normalized lot size. The second function, normalize_lot(), takes in a lot size as an argument and returns the normalized lot size. The normalized lot size is calculated by taking the lot size and dividing it by the volume step and then multiplying it by the volume step. The normalized lot size is then compared to the minimum lot size and the maximum of the two is returned.
To open orders we will use this
trade.PositionOpen(_Symbol,ORDER_TYPE_BUY,get_lot(tick.bid),tick.bid,sl,tp,"Buy");
This code is written in MQL5 and is used to open a new position in the market. The first parameter is the symbol of the asset to be traded. The second parameter is the type of order, in this case a buy order. The third parameter is the lot size, which is calculated using the get_lot() function and the current bid price. The fourth parameter is the current bid price. The fifth and sixth parameters are the stop loss and take profit levels, respectively. The last parameter is a comment that will be added to the order.
The start will be this, according to the initial strat, only changing the close conditions for high low (to get more robust results).
   if(0<=Normalizado<=100 )
     {
      //------------------------------------------------------------------------------
      if(previousValue==100)
        {
         if(Normalizado<100 && array_ma[0]>tick.bid  && rates[5].high < rates[1].low )
           {
            Print("Open Order Buy");
            Alert(" Buying");
            Orden="Buy";
            sl=NormalizeDouble(tick.ask - ptsl*_Point,_Digits);
            tp=NormalizeDouble(tick.bid + pttp*_Point,_Digits);
            //trade.Buy(get_lot(tick.bid),_Symbol,tick.bid,sl,tp);
            trade.PositionOpen(_Symbol,ORDER_TYPE_BUY,get_lot(tick.bid),tick.bid,sl,tp,"Buy");
           }
         if(Normalizado<100 && array_ma[0]<tick.ask  && rates[5].low > rates[1].high )
           {
            Print("Open Order Sell");
            Alert(" Selling");
            Orden="Sell";
            sl=NormalizeDouble(tick.bid + ptsl*_Point,_Digits);
            tp=NormalizeDouble(tick.ask - pttp*_Point,_Digits);
            //trade.Sell(get_lot_s(tick.ask),_Symbol,tick.ask,sl,tp);
            trade.PositionOpen(_Symbol,ORDER_TYPE_SELL,get_lot(tick.ask),tick.ask,sl,tp,"Sell");
           }
        }
     }
   previousValue = Normalizado;
   if(Orden=="Sell" && rates[0].low <array_ma[0])
     {
      trade.PositionClose(_Symbol,5);
      Print("cerro sell");
      return;
     }
   if(Orden=="Buy" && rates[0].high >array_ma[0])
     {
      trade.PositionClose(_Symbol,5);
      Print("cerro buy");
      return;
     }
  }
This code is written in MQL5 language and is used to open and close orders in the Forex market. The code first checks if the value of the variable "Normalizado" is between 0 and 100. If it is, then it checks if the previous value of "Normalizado" was 100. If it was, then it checks if the value of "Normalizado" is less than 100 and if the value of the array_ma[0] is greater than the current bid price and if the high of the last 5 rates is less than the low of the first rate. If all of these conditions are met, then the code prints "Open Order Buy", alerts the user that it is buying, sets the "Orden" variable to "Buy", sets the stop loss and take profit levels, and opens a buy order with the specified parameters.
If the value of "Normalizado" is less than 100 and the value of the array_ma[0] is less than the current ask price and the low of the last 5 rates is greater than the high of the first rate, then the code prints "Open Order Sell", alerts the user that it is selling, sets the "Orden" variable to "Sell", sets the stop loss and take profit levels, and opens a sell order with the specified parameters. After this, the code sets the previous value of "Normalizado" to the current value. Finally, the code checks if the "Orden" variable is set to "Sell" and if the low of the current rate is less than the value of the array_ma[0]. If these conditions are met, then the code closes the sell order and prints "cerro sell". Similarly, if the "Orden" variable is set to "Buy" and the high of the current rate is greater than the value of the array_ma[0], then the code closes the buy order and prints "cerro buy".
Conclusion
The strategy must be optimized in order to be applied on markets but the idea is to present a mean reversion way of thinking about market analysis.
Warning: All rights to these materials are reserved by MetaQuotes Ltd. Copying or reprinting of these materials in whole or in part is prohibited.
This article was written by a user of the site and reflects their personal views. MetaQuotes Ltd is not responsible for the accuracy of the information presented, nor for any consequences resulting from the use of the solutions, strategies or recommendations described.

- Free trading apps
- Over 8,000 signals for copying
- Economic news for exploring financial markets
You agree to website policy and terms of use
And that only the exe is posted, there is no code.
Thanks, it's fixed. The code is now there.
Thanks, it's fixed. The code is now in place
Thank you.
Great work! Thanks for sharing
Thanks!