
The Indicators of the Micro, Middle and Main Trends

Introduction
In the preface to his book "Pattern, Price & Time: Using Gann Theory in Trading Systems" James Hyerczyk wrote:
"My experience in the futures business has shown me that too often traders become hooked on either pattern, price, or time in their analysis. They tend to weight their analysis one way without an equal balance. The most common mistakes are systems built around time to enter and price to exit, or price to enter and time to exit. In addition, traders who use pattern often enter or exit at poor prices or with poor timing. These observations provided further evidence that a combination of all three methods is necessary for success in the marketplace. It is on this premise that I have based my book."
One can not agree with this statement. Let's try to understand how to use some of these methods in practice. The subject of this article is to investigate the possibility of trade automation and the analysis, on the basis of some of the ideas described in the book, in the form of indicators and EAs. Therefore, to better understand the material, it is recommended to read the book (or at least the first part of it - the model) before reading this article.
1.1 The Micro Trend
The graph of a minor trend is shown at Figure 1. Let's briefly consider the rules for constructing a minor trend:
- during an upward movement (when the maximum of the next bar is higher than the maximum of the previous bar, and the minimum of the next bar is higher than the minimum of the previous bar), we connect the next maximum of the bar with the previous one, and get a line of the rising trend;
- during a downward movement (when the minimum of the next bar is lower than the minimum of the previous bar, and the maximum of the next bar is lower than the maximum of the previous bar) connect the next minimum of the bar with the previous one, and get a line of the downward trend;
- if during an upward movement, the maximum of another bar did not exceed the maximum of the previous bar and, thus, the minimum of the next bar is lower than that of the previous bar, then the direction of the movement has been changed to a downward;
- if during a downward movement, the minimum of the next bar is not lower than the minimum of the previous bar, and at the same time, the maximum of the next bar is higher than the maximum of the previous bar, then the direction changed to upward;
- If, for any movement, the minimum of the next bar is higher than the minimum of the previous bar, and at the same time, the maximum of the next bar is lower than the maximum of the previous one, then this bar is called inside (see Fig.1) and does not participate in the construction of the graph;
- If during any movement, the maximum of the next bar is higher than the maximum of the previous bar, and at the same time, the minimum of the next bar is lower than the minimum of the previous bar, then this bar is called outside (see Fig. 1). Depending on the direction of the bar (upwards or downwards), we construct the corresponding segment of the graph.

Figure 1. Minor trends
When the direction of the movement of the graph is changed, there forms the so-called minor peaks and bottoms. The minor bottoms at Figure 1 are marked by the left price label in red, and the minor peaks are marked with right price label in green.
If, during the upward movement, the direction changed to downward, but has not reached the last bottom, then we have a corrective movement. Otherwise, there has been a change in direction. This is likewise for the downward movement.
Thus, the price moves between the bottoms and peaks. Such movements are called swings. At the same time, corrective movements can be generated.
Here are the rules in brief, for constructing the indicator line of the micro trend. A more detailed description can be found in the first part of the book. The graph of this indicator resembles the graph of a well-known ZigZag indicator. But unlike it, it is not redrawn after the closing of another bar, and has no external tunable parameters that affect the construction of the line.
1.2. The GannMicroTrend Indicator
Let's develop an indicators that will display the graph of the micro trend. The appearance should be the same as in Figure 1. Let us also add the output to the display of the latest position of the peaks and bottoms, with respect to time. This indicator is located in the file GannMicroTrend.mq5, attached to this article.
To display this information, use the library, described in the article Create your own Market Watch using the Standard Library Classes. To do this, in the beginning of our indicator's text, add the #include directive:
#include <TextDisplay.mqh>
It is assumed that the above file is located in the \MQL5\Include folder.
The indicator should store in the global variables the parameters of the current trend and the parameters of the latest peak and bottoms. Also, there should be the possibility to specify the depth of the calculation for the given number of bars in history.
To do this, add the external specified parameters:
input int     MaxBars = 1000;
input bool    IsSaveTrendParams = true;
//---------------------------------------------------------------------
input bool    ShowInfo = true;
input int     UpDownInfoShift = 1;
input int     LeftRightInfoShift = 1;
input color   TitlesColor = LightCyan;
input color   TopFieldsColor = Green;
input color   LowFieldsColor = Brown;
//---------------------------------------------------------------------
input color   UpTrendColor = LightGreen;
input color   DnTrendColor = LightPink;
input int     LineWidth = 4;
//---------------------------------------------------------------------
input color   UpStopLossColor = Green;
input color   DnStopLossColor = Brown;
input int     StopLossWidth = 1;
The purpose of these parameters are shown in the following table:
| The name of the parameter |
The purpose of the parameter |
|---|---|
|
The maximum number of bars in history, to which the indicator is drawn. If its 0, then all of the available bars in history are counted and drawn. |
|
If true, then the parameters for the current trend and the parameters of the latest peaks and bottoms are stored in the global variables. |
| If true, then the graph window displays the coordinates of the latest peaks and bottoms. |
|
A vertical shifty from top to bottom of the place of information output. |
|
A horizontal shift from left to right of the place if information output. |
|
The color of the headers during the output of information. |
|
The color of the text during the output of the parameters of the latest peak. |
|
The color of the text during the output of the latest bottoms. |
|
The color of the line drawing of the upward movement. |
|
The color of the line drawing of the downward movement. |
|
The width of the trend lines. |
|
The color of the right price label, indicating the peaks. |
|
The color of the left price label, indicating the bottoms. |
|
The size of the price label, indicating the peaks and bottoms. |
We will be constructing the trend line, using the graphical objects of CChartObjectTrend type. from the set of standard classes. The secondary peaks will be marked by left price label - by the objects of CChartObjectArrowLeftPrice type, while the secondary bottoms - by the objects of CChartObjectArrowRightPrice type. All of these objects are contained in the standard library classes that come with the MetaTrader 5 terminal.
Since in the future we may need the manipulation of the trend lines, as well as the peaks/bottoms, we will store them in a list of objects of type CList, also from a set of standard classes. To do this, add to the beginning of the indicator the directives of inclusion of the header files:
#include  <Arrays\List.mqh>
#include  <ChartObjects\ChartObjectsLines.mqh>
#include  <ChartObjects\ChartObjectsArrows.mqh>
Next, add the objects-lists:
CList*  trend_list_Ptr = NULL;  // list of the trend lines
CList*  up_list_Ptr = NULL;     // list of the peaks
CList*  dn_list_Ptr = NULL;     // list of the bottoms
Now we have all of the necessary elements for the construction of the indicator.
The OnInit function of the indicator is the following:
int OnInit()
{
  trend_list_Ptr = new CList();
  if(CheckPointer(trend_list_Ptr) != POINTER_DYNAMIC)
  {
    Print("Error of creating the object CList #1");
    return(-1);
  }

  up_list_Ptr = new CList();
  if(CheckPointer(up_list_Ptr) != POINTER_DYNAMIC)
  {
    Print("Error of creating the obkect CList #2");
    return(-1);
  }

  dn_list_Ptr = new CList();
  if(CheckPointer(dn_list_Ptr) != POINTER_DYNAMIC)
  {
    Print("Error of creating the object CList #3");
    return(-1);
  }

  if(InitGraphObjects() != 0)
  {
    Print("Error of creating the object TableDisplay");
    return(-1);
  }

  return(0);
}
Here are created the pointers to the object-lists, then the successfulness of the creation is checked. If the pointer is not valid, then an error message is received and with this, the work of the indicator is completed. The place where the error occurred, can be identified by the number with the # char. Next, the table for displaying the parameters for the latest peaks and bottoms is initialized. This is done in the function code InitGraphObjects.
The primary part of our indicator - is the event handler on the need to perform calculations. This is the function OnCalculate. Let's consider it piece by piece. The first part - the check for the need to recalculate the entire displayed portion of the indicator. Such a need arises, for example, when the indicator is first started on the graph, when downloading an updated history on the graph, when a change in the time-frame has occurred. In all of these cases, the value of the argument prev_calculated is equal to zero.
This is verified in the following way:
int index, start = prev_calculated - 1;

if(prev_calculated == 0)
{
  if(CheckPointer(trend_list_Ptr) != POINTER_INVALID)
  {
    trend_list_Ptr.Clear();
  }
  if(CheckPointer(up_list_Ptr) != POINTER_INVALID)
  {
    up_list_Ptr.Clear();
  }
  if(CheckPointer(dn_list_Ptr) != POINTER_INVALID)
  {
    dn_list_Ptr.Clear();
  }

//  Determine the bar number of the beginning of calculations:
  if(MaxBars > 0 && rates_total > MaxBars)
  {
    start = rates_total - MaxBars;
  }
  else
  {
    start = 0;
  }
  time_prev = 0;
  trend_prev = 0;
}
If there is a need to recalculate the entire indicator, then we clear the list of trend lines and the lists of peaks/bottoms Moreover, these graphical objects are also deleted from the graph. Then we determine the number of the bar, from which we need to begin the calculation of the indicator - the start variable. If the value of the MaxBars external variable is greater than zero and is less than the number of bars on the graph rates_total, then the starting bar for the calculation will be equal to:
start = rates_total - MaxBars;
Recall that the indexing of the bars of a time-series start from zero (the recent bar).
If the value of the MaxBars external variable is equal to zero (which means - we need to calculate the indicator on all of the bars of the graph) or greater than the number of bars on the graph, then we need to recalculate all of the values of the indicator for all of the bars on the graph, i.e. start is equal to zero.
Next, there is a cycle of calculation of the trend line and the positions of the secondary peaks/bottoms. The analysis of the maximum and minimum price values of the bars, in accordance with the above rules, is fairly simple, and does not require any further explanation (see the source text in the file GannMicroTrend.mq5).
To draw the sections of a trend line, we use the following simple function:
//---------------------------------------------------------------------
//  Drawing of a section
//---------------------------------------------------------------------
void  CreateCut(datetime _dt1, double _prc1, datetime _dt2, double _prc2, color _clr, int _wd)
{
  string  name = GetUniqName(prefix + " ");
  CChartObjectTrend*  trend_obj = new CChartObjectTrend();
  if(CheckPointer(trend_obj) != POINTER_INVALID)
  {
    trend_obj.Create(0, name, 0, _dt1, _prc1, _dt2, _prc2);
    trend_obj.Color(_clr);
    trend_obj.Width(_wd);
    trend_list_Ptr.Add(trend_obj);
  }
}
Here we use the function to obtain a unique, within the graph, name GetUniqName, described in detail in the article Create your own Market Watch using the Standard Library Classes. In case of a successful construction of the trend line graphical object, its parameters are specified (color and line width), and this object is added to the lines list by calling the CList:: Add method.
To draw the position of the secondary peaks/bottoms, we use the CreateUpStopLoss/CreateDnStopLoss functions, respectively. They are similar as the CreateCut function and add the created objects to their lists.
After the calculation is finished, the parameters of the latest bottoms and peaks are displayed. Here we use the lists, created in the previous step. We obtain these lists already sorted by time according to their increase, and by calling the CList:: GetLastNode method, we obtain the latest object for a peak or a bottom.
The result of the work of the described indicator is presented in the following figure:

Figure 2. The Indicator of a minor trend
2.1. The Middle Trend
The graph of the middle trend reflects the movement of the market, outlined by two bars (two- bar movements). The graph of the middle trend is shown in Figure 2. Let us consider briefly the rules for constructing the graph of the middle trends:
- during an upward movement (when the maximum of the next bar is higher than the maximum of the previous two-bars movement, and the minimum of the next bar is also higher than the minimum of the previous two-bar movement), we combine the next maximum of the bar with the previous maximum of the two-bar movement, and obtain a line of an upward movement of the intermediate trend;
- during a downward movement (when the minimum of the next bar is lower than the minimum of the previous two-bar movement, and the maximum of the next bar is also lower than the minimum of the previous two-bar movement), we combine the next minimum of the bar with the previous minimum of the two-bar movement, and obtain a line of a downward movement of the intermediate trend;
- if during an upward movement, the maximum of the next bar does not exceed the maximum of the previous two-bar movement and, at the same time, the minimum of the next bar is lower than the minimum of the previous two-bar movement, then the direction of movement has changed to downwards;
- if during an upward movement, the maximum of the next bar does not exceed the maximum of the previous two-bar movement and, at the same time, the minimum of the next bar is lower than the minimum of the previous two-bar movement, then the direction of movement has changed to downwards;
- If during any movement, the minimum of the next bar is higher than the minimum of the previous two- bar movement, and, at the same time, the maximum of the next bar is lower than the maximum of the previous two-bar movement, then this bar is called inside (see Figure 2) and it does not participate in the construction of the graph;
- If during any movement, the maximum of the next bar is higher than the maximum of the previous bar, and at the same time, the minimum of the next bar is lower than the minimum of the previous bar, then this bar is called outside (see Figure 2). Depending on the direction of the bar (upwards or downwards), we construct the corresponding segment of the graph.

Figure 3. The middle trend
The only indicator of the reversal of the middle trend upwards - is the intersection of the level of the middle peak. Likewise, the only indicator of the reversal downwards - is the crossover of the middle bottom level.
If the middle trend is upwards, and the market makes an middle swing downwards, but does not annul the previous bottom of the middle swing, it is - a correction. And If the middle trend is downwards, and the market makes the middle swing upwards, but does not annul the previous peak of the middle swing, it is also a correction.
2.2. The GannMiddleTrend Indicator
Let's develop an indicators that will show the graph of the middle trend. The appearance should be the same as in Figure 2. In addition, the positions of the latest peaks and bottoms should be displayed on the screen. This indicator can be found in the file, appended to tis article, GannMiddleTrend.mq5.
In this indicator, for the rendering of the elements of the graph, we will use the indicator buffer and the type of drawing DRAW_COLOR_SECTION. We will need this later in the development of the EA. To access the data of this indicator from the EA, we use the indicator buffer.
The display parameters of the indicator on the screen are specified by the following directives:
#property indicator_buffers    2
#property indicator_plots      1
#property indicator_type1      DRAW_COLOR_SECTION
#property indicator_color1     LightGreen, LightPink
#property indicator_width1     4
Here we specify sequentially:
- the number of indicator buffers (there are only two of them - the data buffer and the buffer of the color index);
- the number of graphs displayed on the screen;
- the type of rendering of the indicator graph (we will render using colored sections);
- the colors that can be specified in the buffer of the color index;
- the line width of the indicator graph;
In the OnInit initialization function we bind the allocated for the indicator buffers, and specify some other indicator parameters.
This is done by the following fragment of the code:
SetIndexBuffer(0, DataBuffer, INDICATOR_DATA);
SetIndexBuffer(1, ColorBuffer, INDICATOR_COLOR_INDEX);

IndicatorSetInteger(INDICATOR_DIGITS, Digits( ));
IndicatorSetString(INDICATOR_SHORTNAME, "GannMiddleTrend");
PlotIndexSetString(0, PLOT_LABEL, "GannMiddleTrend");
PlotIndexSetDouble(0, PLOT_EMPTY_VALUE, 0.0);
Here we specify sequentially:
- a buffer for using in the indicator as a data buffer (for rendуring on the screen);
- a buffer for specifying the color of the sections of the indicator graph;
- the number of decimal points during the display of the indicator values on the screen;
- the short name of the indicator during its displaying on the screen;
- the name of the graphic series (data buffer) when displayed on the screen;
- the value, corresponding to the null value on the screen (without rendering);
The indicator is similar in structure and in external parameters to the indicator of the micro trend GannMicroTrend. The difference is that it uses a direct assignment of values in the indicator buffer and the color buffer, instead of using graphical objects. Therefore, we will not dwell on the details of implementation.
The result of the indicator's work is shown in the following figure:

Figure 4, The intermediate trend indicator
As can be seen, it coincides with the hand-drawn one in Figure 3.
3.1. The Main Trend
The graph of the main trend reflects the movement of the market, outlined by three bars (three-bar movements). The appearance of the graph of the main trend is shown in Figure 5. Let's consider in brief the rules for constructing the main trend:
- during an upward movement (when the maximum of the next bar is higher than the maximum of the previous three-bar movement, and the minimum of the next bar is also higher than the minimum of the previous three-bar movement), we combine the next maximum of the bar with the previous maximum of the three-bar movement, and get a line of the upward movement of the main trend;
- during a downward movement (when the minimum of the next bar is lower than the minimum of the previous three-bar movement, and the maximum of the next bar is also lower than the minimum of the previous three-bar movement), we combine the minimum of the next bar with the previous minimum of the three-bar movement, and get a line of a downward movement of the main trend;
- if during an upward movement, the maximum of the next bar is not exceeding the maximum of the previous three-bar movement, and at the same time, the minimum of the next bar is lower than the minimum of the previous three-bar movement, then the direction has changed to downwards;
- if during an upward movement, the maximum of the next bar is not exceeding the maximum of the previous three-bar movement, and at the same time, the minimum of the next bar is lower than the minimum of the previous three-bar movement, then the direction has changed to downwards;
- If for any movement, the minimum of the next bar is larger than the previous three-bar movement, and at the same time, the maximum of the next bar is lower than the maximum of the previous three-bar movement, then this bar is called inside (see Figure 5), and it doe not participate in the construction of the graph;
- If during any movement, the maximum of the next bar is higher than the maximum of the previous bar, and at the same time, the minimum of the next bar is lower than the minimum of the previous bar, then this bar is called outside (see Figure 5). Depending on the direction of the bar (upwards or downwards), we construct the corresponding segment of the graph.

Figure 5. The main trend
The only indicator of the reversal of the main trend upwards - is the crossover of the level of the main peak. Likewise, the only indicator of the downwards reversal - is the crossover of the level of the main bottom.
If the primary trend is upwards, and the market forms a downwards swing, but does not annul the previous bottom swing, it is - a correction. And if the main trend is downwards, and the market forms upwards swing, but does not annul the previous peak swing, it is also a correction.
3.2. The GannMainTrend Indicator
Let's develop an indicators that will display the graph of the main trend. The appearance should be the same as in Figure 5. In addition, the positions of the latest peaks and bottoms should be displayed on the screen. This indicator is located in the file, appended to this article, GannMainTrend.mq5.
The indicator is identical by its structure and external parameters to the GannMiddleTrend middle trend indicator, therefore, we will not dwell on the details of the implementation. The result of the indicator's work is shown in the following figure:

Figure 6. The indicator of the main trend
4. Trading Using the Swings Chart
So, we have an instrument for analyzing the market in terms of the Model - the indicators of the micor, middle, and main trends. Now let's try to develop a simple trading system, based on the price swings.
In James Hyerczyk's book, he proposes the following strategy:
- Identify sections with long-term movements downwards (upwards);
- After the formation of a stagnant, moving in the horizontal direction, market, place an order to buy over the peak (to sell under the bottom) of the latest swing;
- The protective stop is placed just below the bottom (just above the peak) of the latest swing;
- After opening the position, the stop is moved after the price, under the generated bottoms (peaks) of the new swings;
Let's illustrate this in a drawing:

Figure 7. Swing Trading
At extremely high price levels, it is recommended to consider the possibility of go short, and at the extremely low price levels - the possibilities of go long. Figure 7 illustrates the graph of the middle trend. We will Identify the sections with long-term movements by the graph of the main trend. We will identify the sections of the "stagnant" market by the graph of the middle trend. The position will be monitored by the middle trend graph.
Here is what the same section look like on the graph of main trend:

Figure 8. The section on the chart of the main trend
A long-term downward movement (swing) is between the main peak 1.36913 and the main bottom 1.18758. This movement takes 1815.5 four-digit points. Then comes the section of the "stagnant" market, with an almost horizontal trend from 1.24664 to 1.21495 (see Figure 7). This movement takes 316.9 points. After this, the price breaches the level of the intermediate peak of the latest swing on the intermediate trend graph, and goes upwards.
We set the initial stop just below the intermediate bottom and the latest swing 1.21495, and monitor the position on the graph of the intermediate trend. As a result of this trade, we will get a profit of about 1.31186 - 1.23966 = 722.0 points.
5. Trade Signals Class for Use in MQL5 Wizard
Before designing the code for the implementation of our trading system, let's schematically imagine the whole course of the trade. Consider the following illustration:

Figure 9. Long positions trading
The adjustment of the position BUY consists of the following:
- Define, by the graph of the main trend, a long-term downward movement (section A-B in Figure 9). The duration and magnitude of the movement is specified by the parameters dT and dP, respectively. The values of these parameters should be determined on the basis of studying the history of this instrument.
- After the formation of the main bottom on the graph of the main trend (point B in Figure 9), wait for the formation of points C and D on the graph of the intermediate trend. These points, together with point B, form the intermediate B-C and C-D swings. If the duration and magnitude of these swings does not exceed the specified values, then we assume that they formed a horizontal trend (or a "stagnant" market).
- Wait for the reach of the level of the intermediate C peak (or the most recent intermediate peak, which is formed after C). After the breach, place the stop just below the intermediate bottom at point D (or the most recent intermediate basу, which is formed after C).
- Monitor the position as the upward movement continues, by moving the stop under the formed intermediate bottom (just below the points F and L).
- Depending on the mode of capital management, we can add to the position volume, in the points of breach, of the formed intermediate peaks (G and M points).
So, to build an Expert Advisor, we need the following components: a module to generate buy/sell signals; a module of the trailing stop of the opened position, and possibly a module, responsible for the "pyramiding" position (money-management).
When writing this part, the following articles were used: MQL5 Wizard: How to Create a Module of Trading Signals, MQL5 Wizard: How to Create a Module of Trailing of Open Positions, MQL5 Wizard: How to Create a Risk and Money Management Module.
The development of the module, responsible for generating trading signals, consists of the following:
- Add a preprocessor directive to include the standard mqh-file, which contains all of the base classes for the generation of an Expert Advisor. This is done the following way:
#include <Expert\ExpertSignal.mqh>
Insert this directive at the beginning of our module of generating a trading signal.- The addition of special strings, in the form of comments, which indicate to the MetaEditor editor that this file should be used when generating the EA:
// wizard description start
//+------------------------------------------------------------------+
//| Description of the class                                         |
//| Title=Signal based on swings on charts                           |
//| of the middle and main trends according to Gann (iCustom)        |
//| Type=Signal                                                      |
//| Name=TGannBreakSignal                                            |
//| Class=TGannBreakSignal                                           |
//| Page=                                                            |
//| Parameter=MinMainSwingContinuance,int,5                          |
//| Parameter=MinMainSwingSize,double,300.0                          |
//| Parameter=MinMiddleSwingContinuance,int,3                        |
//| Parameter=MaxMiddleSwingSize,double,200.0                        |
//| Parameter=OpenPriceSpace,double,5.0                              |
//| Parameter=StopLossSpace,double,5.0                               |
//+------------------------------------------------------------------+
// wizard description end
Here we see the parameter Title, which specifies the name of the module, which appears in the list MetaEditor' during the generation of the EA (see description below). An important parameter - Type, which determines that the given module is a module of signal generation. Also, the external parameters and their default values are present.
All of these lines are added immediately after the directive of inclusion of the standard file ExpertSignal.mqh.
- The description of the class, of the descendant of the base class, described in the file ExpertSignal.mqh. This class should implement some functionality, which is missing in the CExpertSignal base class. The description of our class has the follows view (some non essential parts are not shown here):
class TGannBreakSignal : public CExpertSignal
  {
private:
   int               min_main_swing_continuance;    // minimum swing duration time of the main tren
   double            min_main_swing_size_points;    // minimum swing amplitude on the chart of the main trend
   int               min_middle_swing_continuance;  // minimum swing duration time on the chart of the middle trend
   double            max_middle_swing_size_points;  // maximum swing amplitude of the chart of the middle trend
   double            open_price_space;              // distance between the open price and peak/bottom
   double            stop_loss_space;               // distance between the stop loss price and peak/bottom

   datetime          main_swing_lf_datetime;        // time of left point of a swing on the chart of the main trend
   double            main_swing_lf_price;           // price of left point of a swing on the chart of the main trend
   datetime          main_swing_rt_datetime;        // time of right point of a swing on the chart of the main trend
   double            main_swing_rt_price;           // price of right point of a swing on the chart of the main trend
   int               main_swing_continuance;        // swing duration time on the chart of the main trend
   double            main_swing_size_points;        // swing amplitude (in points) on the chart of the main trend

   datetime          middle_swing_lf_datetime;      // time of left point of a swing on the chart of the middle trend
   double            middle_swing_lf_price;         // price of left point of a swing on the chart of the middle trend
   datetime          middle_swing_rt_datetime;      // time of right point of a swing on the chart of the middle trend
   double            middle_swing_rt_price;         // price of right point of a swing on the chart of the middle trend
   int               middle_swing_continuance;      // swing duration time on the chart of the middle trend
   double            middle_swing_size_points;      // swing amplitude (in points) on the chart of the middle trend

   int               handle_main_swing;
   int               handle_middle_swing;
   double            main_swing_buff[];
   double            middle_swing_buff[];
   datetime          time_buff[];
   double            price_buff[];
public:
                     TGannBreakSignal();   // constuctor
                    ~TGannBreakSignal();   // destructor
   //   Settings:
   void              MinMainSwingContinuance(int _cont);
   void              MinMainSwingSize(double _size);
   void              MinMiddleSwingContinuance(int _cont);
   void              MaxMiddleSwingSize(double _size);
   void              OpenPriceSpace(double _space);
   void              StopLossSpace(double _space);

   int               GetMainSwingContinuance();    // gets swing duration time on the chart of the main trend
   double            GetMainSwingSizePoints();     // gets swing amplitude (in 4-digit points) on the chart of the main trend
   int               GetMiddleSwingContinuance();  // gets swing duration time on the chart of the middle trend
   double            GetMiddleSwingSizePoints();   // gets swing amplitude (in 4-digit points) on the chart of the middle trend

   // overloaded methods of the CExpertSignal class:
   virtual bool      ValidationSettings();
   virtual bool      CheckOpenLong(double &price,double &sl,double &tp,datetime &expiration);
   virtual bool      CheckOpenShort(double &price,double &sl,double &tp,datetime &expiration);
   virtual bool      InitIndicators(CIndicators *indicators);

   //   Additional methods:
protected:
   //   Sets swing parameters of the main trend
   void              SetMainSwingParameters(datetime _lf_dt,double _lf_price,datetime _rt_dt,double _rt_price);
   //   Sets swing parameters of the middle trend
   void              SetMiddleSwingParameters(datetime _lf_dt,double _lf_price,datetime _rt_dt,double _rt_price);
   // Gets swing parameters of the main trend
   int               GetMainSwing();
   // Gets swing parameters of the middle trend
   int               GetMiddleSwing( );
  };
The purpose of data-members is clear from the comments. Consider some of the methods of the class.
First of all, we need to redefine the methods of the base class. The first method is used to check the correctness of the specified external parameters of the EA:
//---------------------------------------------------------------------
// Validation of settings
//---------------------------------------------------------------------
bool TGannBreakSignal::ValidationSettings()
  {
   if(this.min_main_swing_continuance<=0)
     {
      Print("Wrong Parameter: min_main_swing_continuance = ",
           this.min_main_swing_continuance);
      return(false);
     }
   if(this.min_main_swing_size_points<=0.0)
     {
      Print("Wrong Parameter: min_main_swing_size_points = ",
            DoubleToString(this.min_main_swing_size_points,1));
      return(false);
     }
   if(this.min_middle_swing_continuance<=0)
     {
      Print("Wrong Parameter: min_middle_swing_continuance = ",
             this.min_middle_swing_continuance);
      return(false);
     }
   if(this.max_middle_swing_size_points<=0.0)
     {
      Print("Wrong Parameter: max_middle_swing_size_points = ",
             DoubleToString(this.max_middle_swing_size_points,1));
      return(false);
     }

   return(true);
  }
Here, we make a simple check of the external parameters for correctness. It is clear that the amplitude of the swing (in points) and its duration in bars can not be less than or equal to zero. In case of an incorrectly specified external parameters, the method returns false.
Next, let's consider the methods of generating signals for the opening of positions.
The check for the need to open a long position is done by the following, inherited from the base class, method:
//---------------------------------------------------------------------
// Checks conditions to open long position
//---------------------------------------------------------------------
bool TGannBreakSignal::CheckOpenLong(double &_price,double &_sl,
                                         double &_tp,datetime &_expiration)
  {
   if(this.GetMainSwing()==-1)
     {
      return(false);
     }

   if(this.GetMiddleSwing()==-1)
     {
      return(false);
     }

// If the main swing upward, exit
   if(this.main_swing_rt_price>=this.main_swing_lf_price)
     {
      return(false);
     }

// If the middle weak swing isn't formed, exit:
   if(this.middle_swing_rt_price>=this.middle_swing_lf_price)
     {
      return(false);
     }

// Check swing parameters on the main trend chart
   if(this.main_swing_continuance<this.min_main_swing_continuance ||
     this.main_swing_size_points<this.min_main_swing_size_points)
     {
      return(false);
     }

// Check swing parameters on the middle trend chart
   if(this.middle_swing_continuance<this.min_middle_swing_continuance ||
      this.middle_swing_size_points>this.max_middle_swing_size_points)
     {
      return(false);
     }

   double unit=this.PriceLevelUnit();

// If the price has crossed the peak of the weak middle swing, set signal to open long position:
   double delta=this.m_symbol.Bid()
             -(this.middle_swing_lf_price+this.open_price_space*unit);
   if((delta>=0.0) && (delta<(10.0*unit)))
     {
      _price=0.0;
      _sl = this.m_symbol.NormalizePrice(this.middle_swing_rt_price - stop_loss_space*unit);
      _tp = 0.0;

      return(true);
     }

   return(false);
  }
First, two methods for obtaining the parameters of the latest swaings are called, for the graphs of the main and intermediate trends - TGannBreakSignal::GetMainSwing and TGannBreakSignal::GetMiddleSwing. If these methods were successful, then we can analyze the parameters of the swings.
Since, we are checking for the presence of the signal for opening a long position, the swings should be downwards. We compare the positions of points A and B (see Fig.9) - if the point B has a lower price than point A, then the price swings was downwards.
Next, we check for the presence of points C and D (see Figure 9). Moreover, point D must have a lower price than point C. If this condition is met, then we check the parameters of swings of the main and intermediate trends. The duration and magnitude of movement is checked.
If all of the previous checks were successful, then the last check is performed - whether or not the price crossed the peak of the intermediate swing. If it did, then fill the stop value and return the result true.
The check for the need to open a short position is done by calling the method TGannBreakSignal:: CheckOpenShort, which performs the checks similar to the method TGannBreakSignal:: CheckOpenLong, but in a mirror-image in the price axis.
Thus, we have reviewed the structure and the basic methods of the module, responsible for the generating of trading signals. The described module is attached to this article in the file GannTrendSignal.mqh.
The second module that we will need - is the module of trailing stop of an open position. This module is also developed based on the standard classes, and consists of the following:
- The addition of the preprocessor directive to include the standard mqh-file, which contains the base classes for generating the code for position trailing.
This is done the following way:
#include <Expert\ExpertTrailing.mqh>
Insert this directive at the beginning of the module of position trailing.
- The addition of special strings, in the form of comments, indicate to the editor MetaEditor that this file should be used to generate position trailing in the EA:
// wizard description start
//+------------------------------------------------------------------+
//| Description of the class                                         |
//| Title=Trailing on peaks/bottoms on the chart of the middle trend |
//| Type=Trailing                                                    |
//| Name=MiddleTrend                                                 |
//| Class=MiddleTrendTrailing                                        |
//| Page=                                                            |
//| Parameter=StopLossSpace,double,5.0                               |
//+------------------------------------------------------------------+
// wizard description end
//+------------------------------------------------------------------+
Here, the parameter Type is set equal to the "Trailing" value, - this indicates that this module should be used to support the position (trailing). Also, the external parameters and their default values are present.
All of these lines are added immediately after the directive of including the standard file ExpertTrailing.mqh.
- The description of the class, a descendant of the base class, described in the file ExpertTrailing.mqh. This class should implement some functionality, missing in the base class CExpertTrailing. The description of our class has the follows view (some non essential parts are not shown here):
class MiddleTrendTrailing : public CExpertTrailing
  {
private:
   datetime          middle_swing_lf_datetime;  // time of left point of a swing on the chart of the main trend
   double            middle_swing_lf_price;     // price of left point of a swing on the chart of the main trend
   datetime          middle_swing_rt_datetime;  // time of right point of a swing on the chart of the main trend
   double            middle_swing_rt_price;     // price of right point of a swing on the chart of the main trend
   double            stop_loss_space;           // the distance between peak/bottom and stop loss price

   int               handle_middle_swing;
   double            middle_swing_buff[];
   datetime          time_buff[];
   double            price_buff[];
public:
                     MiddleTrendTrailing();     // constructor
                    ~MiddleTrendTrailing();     // destructor
private:
   int               GetMiddleSwing();          // get parameters of the middle swing

public:
   //   Settings:
   void              StopLossSpace(double _space);
   //   Overloaded methods of CExpertTrailing class:
   virtual bool      ValidationSettings();
   virtual bool      InitIndicators(CIndicators *indicators);
   virtual bool      CheckTrailingStopLong(CPositionInfo *position,double &sl,double &tp);
   virtual bool      CheckTrailingStopShort(CPositionInfo *position,double &sl,double &tp);
  };
The basic methods, redefined in our class - MiddleTrendTrailing:: CheckTrailingStopLong and MiddleTrendTrailing:: CheckTrailingStopShort. These two methods check for the conditions for modification of the stop-loss for a long and short position, respectively.
Consider the method MiddleTrendTrailing:: CheckTrailingStopLong in more detail:
//---------------------------------------------------------------------
// Checks conditions of trailing stop for long position
//---------------------------------------------------------------------
bool MiddleTrendTrailing::CheckTrailingStopLong(CPositionInfo *_position,double &_sl,double &_tp)
  {
   if(_position==NULL)
     {
      return(false);
     }

   if(this.GetMiddleSwing()==-1)
     {
      return(false);
     }

   double sl_req_price = this.m_symbol.NormalizePrice(MathMin(middle_swing_lf_price,middle_swing_rt_price)
                      - this.stop_loss_space * this.m_adjusted_point );
   if(_position.StopLoss() >= sl_req_price )
     {
      return(false);
     }

   _tp = EMPTY_VALUE;
   _sl = sl_req_price;

   return(true);
  }
First we call the method for obtaining the parameters of the latest swing for the middle trend graph - TGannBreakSignal:: GetMiddleSwing. If this method succeeds (returned a zero value), it is possible to analyze the parameters of the swings.
Next, we calculate the price level for placing the stop-loss, on the basis of the obtained swing parameters. If the calculated level of the stop-loss are lower than the current one (for the long position), then we fill the parameter of the method _sl new value sl_req_price and return true. Otherwise, return false - this suggests that the level of the stop-loss does not require modification.
The method of checking for the need of modifying the stop-loss for a short positions is built analogously.
Thus, we have reviewed the structure and the basic methods of the module, responsible for the trailing of an open position (trailing). The described module is attached to this article in the file GannTrailing.mqh.
The Generation of the EA on the basis of the trading signals
The generation of the EA by a template, using the "Masters MQL5", is a fairly simple task. It consists of a sequence of steps:
- Step 1
Using the commands of the main menu MetaEditor'a File / New, call the master of the EA generation. The screen displays a window of the dialog of the following view:

Figure 10. Creating ready Expert Advisor dialog in MQL5 Wizard
Select the "radio-button" with the inscription "EA (generate)" and click the "Next " button - go to the next step of generating the EA.
- Step 2
In this step, we specify the general parameters of the EA - the name, the "magic" number, etc. The following dialog window appears:

Figure 11. General properties of the Expart Advisor
Specify the value of the parameter EveryTick in true - we need the work of the EA for every tick, the "magic" number can be left unchanged. Click the "Next" button and proceed to the next step of the generation.
- Step 3
In this step, specify the parameters of the signals for the EA. First, we select the particular type of a signal from the list:

Figure 12. The selecting of the module of trade signals
Select the name of our signal, written earlier, and the dialog of the following type appears on the screen:

Figure 13. Input parameters of the trading signal module
Here we can correct the needed to us default values of the parameters. Again, press the "Next" button and proceed to the next step.
- Step 4
In this step, select the type of trailing for supporting the open position. We can select any one from the list, but we will select the method of the previously developed trailing-stop:

Figure 14. Select the type of the trailing position
We get the following dialog window:

Figure 15. Specifying the trailing parameters
Here, we can adjust the default values for the specified external parameters. Press the "Next" button and proceed to the next step.
- Step 5

Figure 16. Specifying the parameters of money management
Here we can select the parameters for capital management (the method of calculating the working lot). Leave it as is - trading with a fixed trading volume. Press the "Done" button obtain a ready generated EA with a specified name, algorithm of position opening, trailing, and rules of capital management.
Test the generated EA to make sure it is working:

Figure 17. Test the created Expert Advisor
We can see that the trends, which were correctly identified, were taken completely (to the extent that this method allows). Moreover, we used the default parameters, specified by general considerations.
Conclusion
We have factually considered only the first part of the Gann theory and its application in trading systems and market analysis - the model. It seems that the best results of its application can be achieved in those time periods, where the division of the graph into bars, corresponds to the natural organization of trade.
For the stock markets - this is trade using daily, weekly, and monthly intervals. For the currency market - this is trade, using session intervals. For the commodity markets - this is trade, using, not only daily, weekly, and monthly intervals, but also seasonal fluctuations on the market.
Post Conclusion
I decided to do a little extra research, not directly relevant to the topic, but concerning the idea of Gann. More specifically, the question: Does the price, during its movement mark the so-called "round" levels? I.e. the price levels, ending with the figures 50 and 100 for the Euro-currencies and stocks (for the Japanese yen, a "round" price level is one ending in 40).
For this, let's construct a distribution diagram of peaks/bottoms on the last figures after the decimal point. For the five-digit quotations, there are the last three digits after the decimal point (the last digit - tenths of a point). We will use the intermediate trend graph for daily bars.
On a circular axis, we plot the last digits of the price, from zero to fifty (round to the tenths of a point), while on the vertical axis - the number of peaks/bottoms formed at these levels. Construct it separately for the peaks, bottoms, and the total figure.
Here's what we have for some of the major currency pairs in the interval from the year 2000. to 2011. and a daily time-frame:
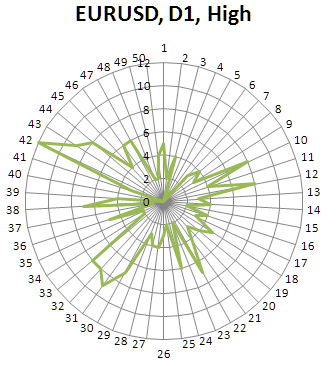
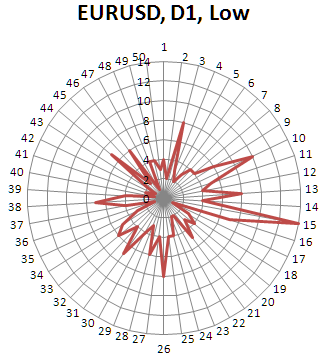
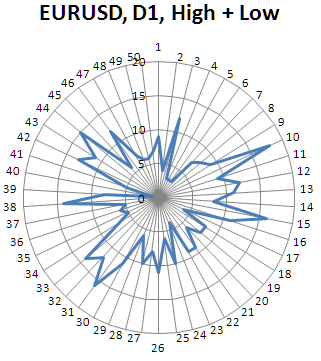
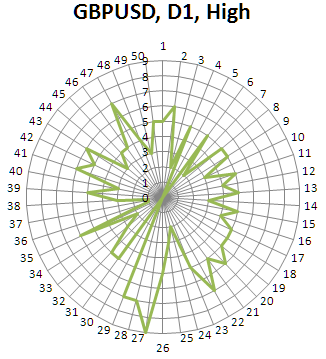
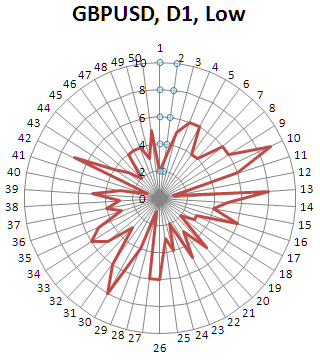
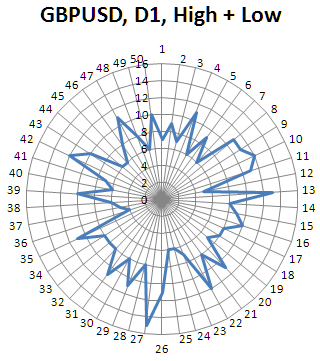
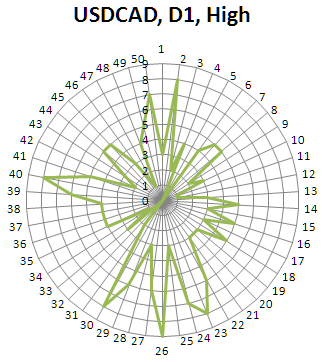
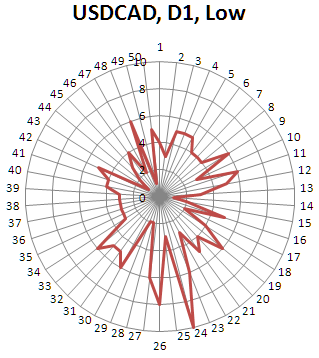
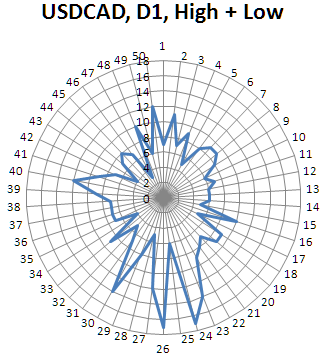
How can we interpret these results? First of all, there are distortions in the diagrams. I.e. not all price values are equally likely to form peaks/bottoms. Secondly, these values do not coincide exactly with the "round" values - which is what was basically expected. Whether or not this can be used for trade is difficult to say. This requires a more serious research. Perhaps more interesting results, from a practical point of view, can be obtained on the stock market.
At least, this is another instrument for the analysis of the history and not the worst amongst its kind.
Translated from Russian by MetaQuotes Ltd.
Original article: https://www.mql5.com/ru/articles/219
Warning: All rights to these materials are reserved by MetaQuotes Ltd. Copying or reprinting of these materials in whole or in part is prohibited.
This article was written by a user of the site and reflects their personal views. MetaQuotes Ltd is not responsible for the accuracy of the information presented, nor for any consequences resulting from the use of the solutions, strategies or recommendations described.

 Tracing, Debugging and Structural Analysis of Source Code
 The Implementation of Automatic Analysis of the Elliott Waves in MQL5
 How to Order an Expert Advisor and Obtain the Desired Result
 Electronic Tables in MQL5
- Free trading apps
- Over 8,000 signals for copying
- Economic news for exploring financial markets
You agree to website policy and terms of use
this indicator does not open on my mt5 can anyone help me???????????
Why my MQL5 Wizard is different from yours?
In step of "Parameters of Signal Module" , I could't find Signal based on Middle/Micro trend. In addition, I already compile the indicator and be able to use it into icustom idicator.
Dima mentioned a "Masters MQL5" template that appears to be used to make the MT5 Signals Module recognize ganntrendsignal.mqh. I'm unable to find this Masters MQL5 template.
I copied ganntrendsignal.mqh to the MySignals folder in MT5 and the file remains unrecognized.
I'm presently reading Trading Signal Generator Based on a Custom Indicator - MQL5 Articles. The sample mysignal.mqh file posted there is recognized by the MT5 Signals Module. Maybe the code in mysignal.mqh holds the answer.
The generated EA doesn't work...
What's wrong??
Here is classic me, replying 13 years later...
Thank you, Atsushi, for posting a source file of your generated EA. I have come to believe that the MT5 Wizard has been extensively updated, and that Dima was simply referring to the old Wizard as the "MQL5 Masters Template." As a result, the current Wizard likely cannot work with the old signals mqh files posted in this thread. Therefore, I opened your old EA source code and noticed two potential issues:
I actually did this, and your code otherwise appears to be running with the indicators pre-attached to the chart. I received 3 non-fatal "Changing of timeseries is forbidden" statements in the Experts tab, but based on Error: CExpertBase::SetPriceSeries: changing of timeseries is forbidden - Automatic Trade - Expert Advisors and Automated Trading - MQL5 programming forum, I believe that I can ignore it.
One caveat is that this workaround doesn't work in the current version of MT5 Strategy Tester. I'm presently waiting for trading conditions to return true in forward testing...
Quick update...
The problem is not the MT5 Strategy Tester. It's the old Gann.mq5 EA and mqh files that are incompatible with the entire updated MT5 platform. There were no trades executed in forward testing just like in back testing.
Upon further inspection of the indicators' source codes, I found a ready-made GlobalVariable coupled with each pointer. GlobalVariableGet is the answer for EA coding!