Absolute Bands
- Indikatoren
-
Aleksey Ivanov
 👑 Theoretischer Physiker, Programmierer, Händler mit 15 Jahren Erfahrung.
------------------------------------------------------------------------------------------
💰 Präsentierte Produkte: - Version: 1.0
Konstruktionsprinzipien des Indikators.
Der Absolute-Bands-Indikator (AB-Indikator) erinnert in seinem Aussehen und seinen Funktionen an den Bollinger-Bands-Indikator, ist aber aufgrund der deutlich geringeren Anzahl von Fehlsignalen, die an ihn ausgegeben werden, für den Handel noch effektiver. Diese Effektivität des Absolute Bands Indikators ist auf seine Robustheit zurückzuführen.
Beim Bollinger Bands Indikator befinden sich auf beiden Seiten des gleitenden Durchschnitts - Ma - Linien, die von Ma um die StandardabweichungenStd=Sqrt(<(X- Ma)^2>) beabstandet sind ( wobei X der Kursverlauf ist, <...> das Mittelungsverfahren für eine bestimmte Anzahl von Balken ist) multipliziert mit der Zahl (standardmäßig 2,0). In der Mathematik ist bewiesen, dass eine Schätzung, die ein Minimum der Standardabweichung liefert, eine mathematische Erwartung ist, d.h. der gleitende Durchschnitt, auf dem der Bollinger Bands Indikator basiert. Die Bollinger Bänder enthalten also alle Punkte der Kursgeschichte in konzentrierter Form.
Der Absolute Bands-Indikator basiert auf dem Median = (Max + Min) / 2 gleitende Medianlinie. Auf beiden Seiten des Medians befinden sich Linien, die durch die absoluten Abweichungen der gleitenden Durchschnitte <| X- Median | >, multipliziert mit einer Zahl (standardmäßig 1,5), von ihm beabstandet sind. Gleichzeitig ist es der Median, der die mittleren absoluten Abweichungen minimiert, was vom Indikator Absolute Bands verwendet wird. Die mittleren absoluten Abweichungen sind weniger empfindlich gegenüber den oft rein zufälligen Preisspitzen, die auf dem Markt auftreten, was den Indikator Absolute Bands robuster oder weniger empfindlich gegenüber solchen Emissionen macht. Während zufällige Preisspitzen dazu führen, dass der klassische Bollinger Bands-Indikator falsche Signale gibt.
Absolute Bands-Indikatoren und der Handel mit ihnen.
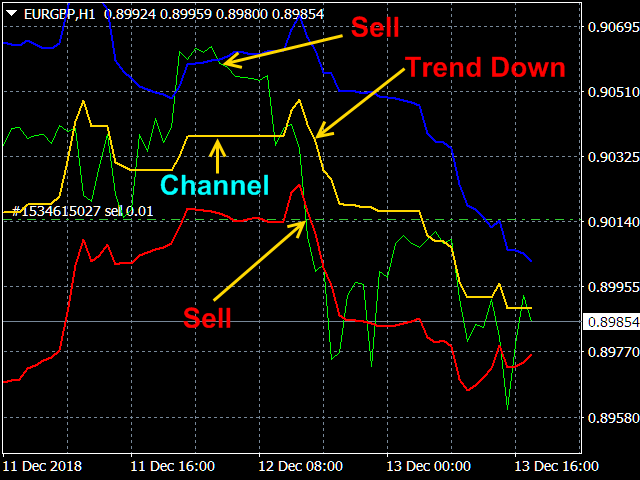
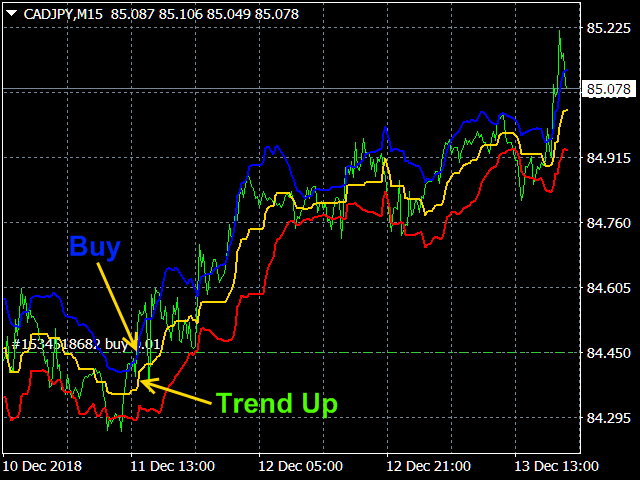
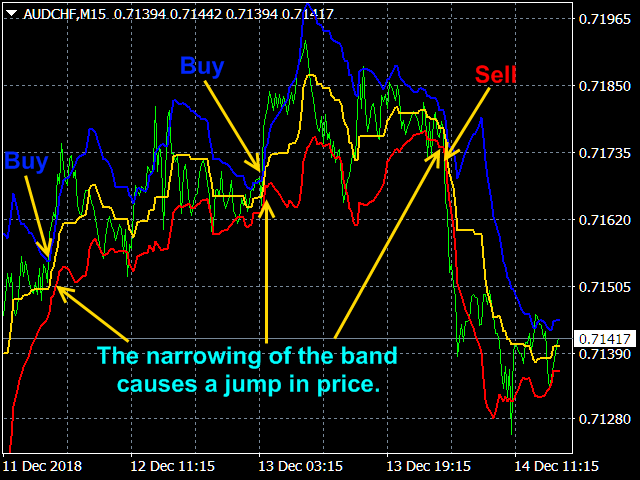
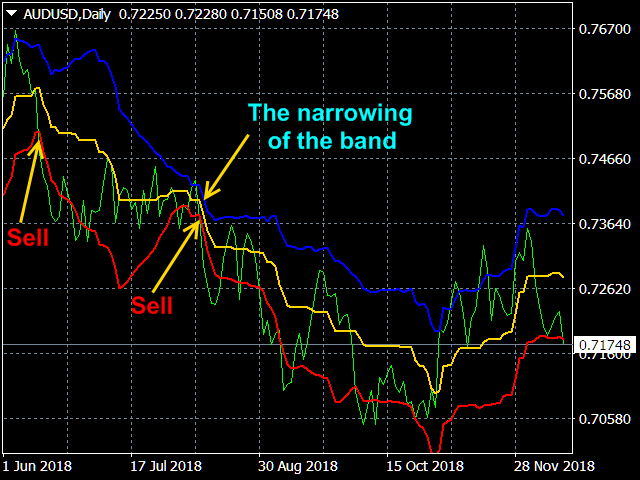
Ein Trend entsteht nach einer Periode der Preiskonsolidierung, die durch den Absolute Bands Indikator in der horizontalen Mittellinie und der Konvergenz der oberen und unteren Linie ausgedrückt wird. Wenn nach der Konsolidierungsphase (1.1) die obere und die untere Linie divergieren, (1.2) der Preis über die obere Linie steigt (oder unter die untere Linie fällt) und (1.3) die mittlere Linie stark ansteigt (sinkt), dann zeigt dies den Beginn des Trends an, und Sie müssen eine Position zum Kauf(Verkauf) eröffnen.
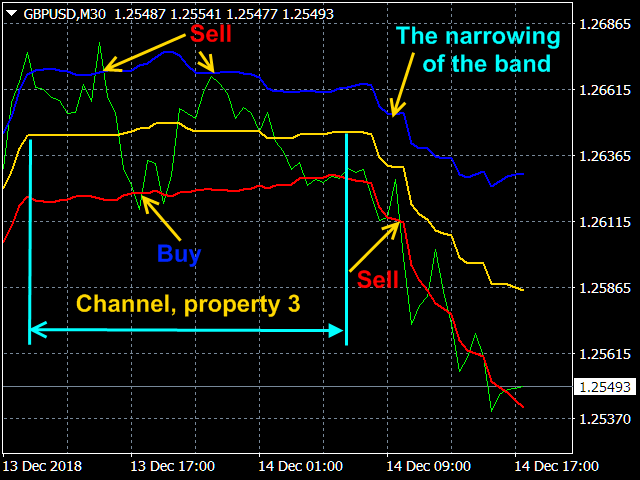
Wenn sich der Kurs von der oberen Linie nach unten bewegt (von der unteren Linie nach oben) und die mittlere Linie horizontal verläuft, deutet dies auf den Ursprung des Kanals hin (der Kurs erreicht höchstwahrscheinlich die gegenüberliegende Grenze), und Sie müssen Positionen auf Verkaufen(Kaufen) eröffnen.
Wenn auf Spitzen und Täler außerhalb der Grenzen des Bandes des Indikators Absolute Bands Spitzen und Täler innerhalb seines Bandes folgen, kann eine zuvor etablierte Tendenz (Trend, Kanal) enden.
Alle diese Situationen sind in den Screenshots dargestellt.
Einstellungen des Indikators.
- Preistyp - angewandter Preis. Werte: Schlusskurs, Eröffnungskurs, Höchstkurs, Tiefstkurs, Medianpreis ( (Hoch + Tief)/2 - Standard), Typischer Preis ((Hoch + Tief + Schluss)/3),Gewichteter Preis ( (Hoch + Tief + 2*Schluss)/4).
- Die Mittelungsperiode - Mittelungsperiode. Beliebige ganze Zahl ( standardmäßig 20 ).
- Kanal Breite Faktor - Kanalbreitenfaktor. Werte: jede reelle Zahl ( standardmäßig 1,5 ).


Good indicator combinations