Signal Bands
- Indikatoren
-
Aleksey Ivanov
 👑 Theoretischer Physiker, Programmierer, Händler mit 15 Jahren Erfahrung.
------------------------------------------------------------------------------------------
💰 Präsentierte Produkte: - Version: 3.0
- Aktualisiert: 30 Juni 2020
- Aktivierungen: 5
Signal Bands ist ein sensibler und praktischer Indikator, der eine tiefgehende statistische Verarbeitung von Informationen durchführt. Er ermöglicht es, auf einem Diagramm (1) den Preistrend, (2) den klaren Preiskanal und (3) latente Anzeichen einer Trendänderung zu erkennen. Der Indikator kann auf Charts beliebiger Perioden verwendet werden, ist aber aufgrund seiner hohen Empfindlichkeit gegenüber dem aktuellen Marktzustand besonders nützlich für das Scalping.
Die Funktionen des Indikators:
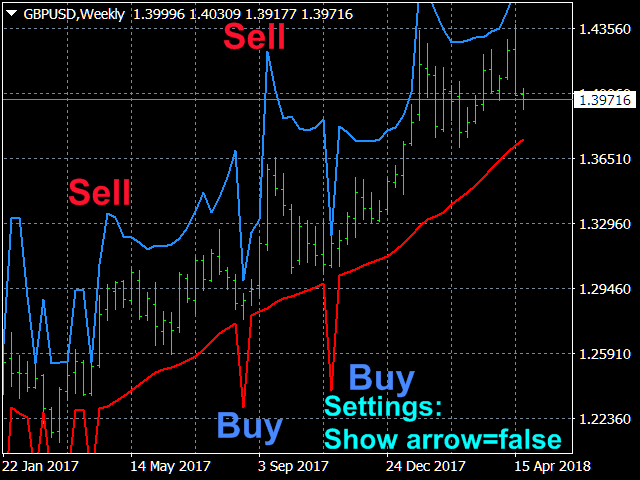
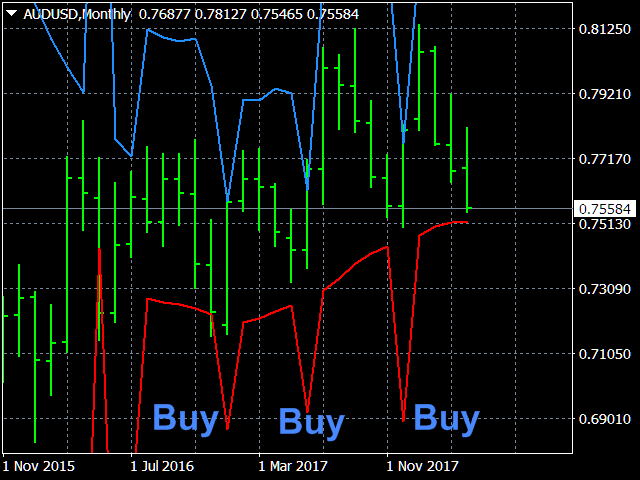
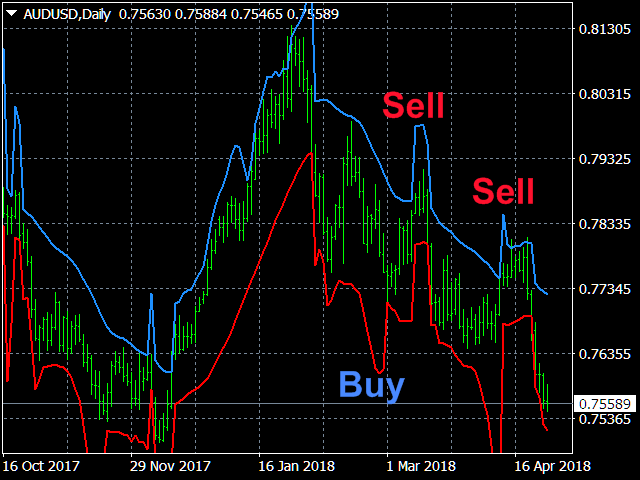
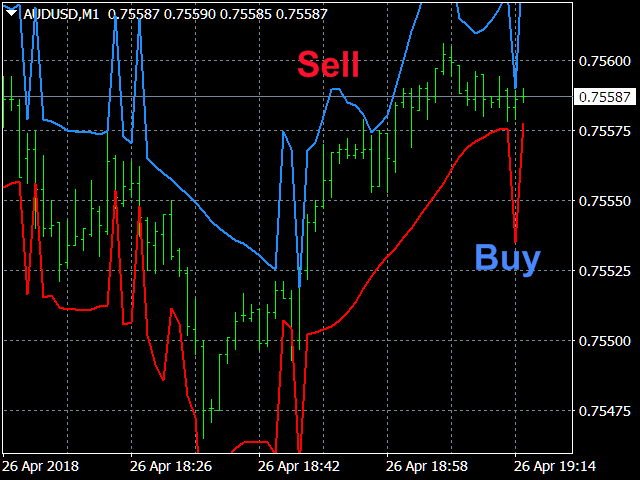
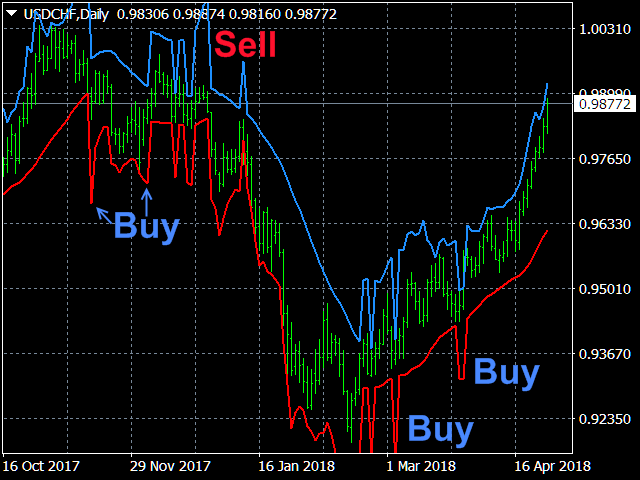
- Erstens zeichnet der Signalband-Indikator Kanäle, in die alle Kursschwankungen genau hineinpassen, so dass der Kurs bei den Standardparametern niemals die Grenzen dieses Kanals überschreitet (außer beim Auftreten sehr hoher Spitzenwerte der Signalinformationen).
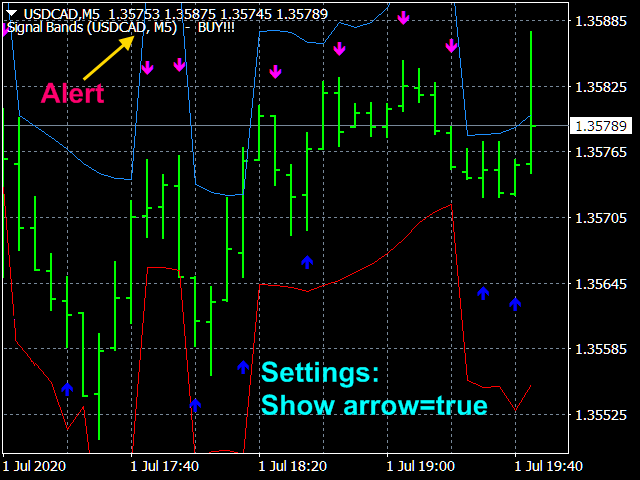
- Scharfe Bewegungen auf den Kanallinien (scharfe Spitzen) deuten auf eine Änderung der Kursrichtung hin. Signale, die von solchen scharfen Spitzen geliefert werden, sind oft vorauseilend, d.h. sie treten etwa 1-2 Takte vor dem Beginn einer Preisumkehr auf. Eine scharfe Abwärtsspitze an der unteren Linie des Kanals nach unten ist das Kriterium für die Umkehr des Kurses nach oben. Umgekehrt geht die scharfe Aufwärtsspitze an der oberen Kanallinie der Kursumkehr nach unten voraus.
Die Signale des Signalband-Indikators werden algorithmisch auf der Grundlage der Analyse der aktuellen Dichte der Preiswahrscheinlichkeit gebildet, die vor dem Moment der Preisrichtungsänderung aufgrund kurzfristiger Preisausschläge (die bei den meisten Händlern darauf abzielen könnten, den StopLoss zu erreichen) in die der neuen Bewegung entgegengesetzte Richtung eine starke Asymmetrie aufweist.
Die Anzeigen des Indikators sind äußerst einfach und bedürfen keiner besonderen Erklärung. Blaue Pfeile, die nach oben zeigen, sind ein Kaufsignal, rote Pfeile, die nach unten zeigen, sind ein Verkaufssignal.
Der Signalband-Indikator kann sowohl für den Handel nach Scalper-Strategien als auch für langfristige Handelsstrategien verwendet werden. Der Indikator verfügt über alle Arten von Alarmen. Der Indikator wird nicht neu gezeichnet.
Einstellungen des Indikators
- Preis-Typ. Werte: Schlusskurs, Eröffnungskurs (Standard), Höchstkurs, Tiefstkurs, Mittelkurs ((Hoch + Tief)/2), Typischer Kurs ((Hoch + Tief + Schluss)/3), Gewichteter Kurs ((Hoch + Tief + 2*Schluss)/4).
- Die Methode der Mittelwertbildung. Werte: Einfach (Standard), Exponential, Geglättet, Linear gewichtet.
- Der Mittelungszeitraum - Mittelungszeitraum. Ganzzahlig. Standardwert ist 20.
- Kanalbreitenfaktor - Kanalbreitenfaktor. Die reelle Zahl Standardwert ist 1.0.
- Der Faktor der Empfindlichkeit . -Der Koeffizient der Empfindlichkeit auf die Preissprünge. Die reale Zahl. Werte von 2,0 bis 6,0. Standardwert ist 4,0.
- Show one branch? - Nur einen Zweig anzeigen? Werte: true - ein Zweig, false - zwei Zweige.
- Pfeilanzeigen? (nur im Modus mit einem Zweig) - Signale mit Pfeilen anzeigen. Werte: true (Standard), false -
- Linien- und Pfeildicke-Werte: - jede positive ganze Zahl(1 Standard).
- Die Signalmethode -Art der Handelswarnung. Werte:Nein (Standard), Alarm senden, Drucken (im Experten), Kommentar (im Chart), Ton + Druck, Ton + Kommentar, Ton, Push + Kommentar, Push, Mail + Kommentar, Mail.