Quality trend
- Indikatoren
-
Aleksey Ivanov
 👑 Theoretischer Physiker, Programmierer, Händler mit 15 Jahren Erfahrung.
------------------------------------------------------------------------------------------
💰 Präsentierte Produkte: - Version: 1.10
- Aktualisiert: 8 Juli 2023
- Aktivierungen: 5
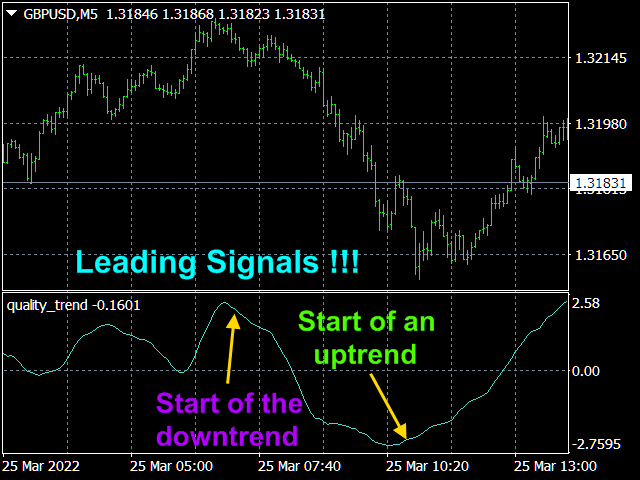
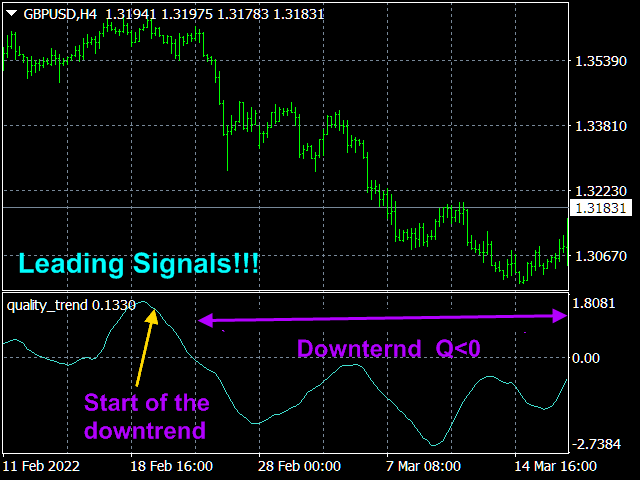
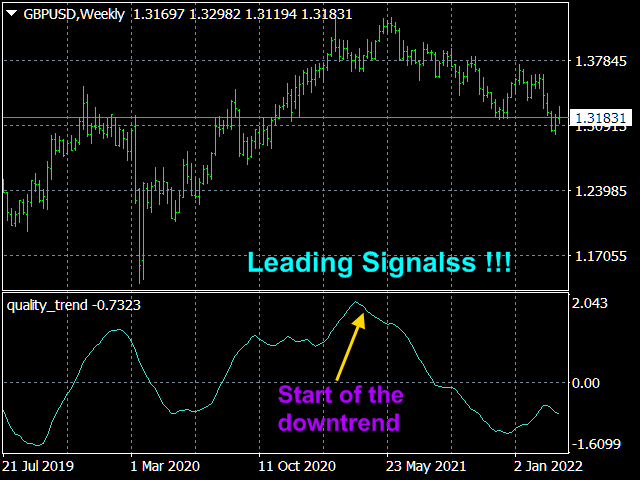
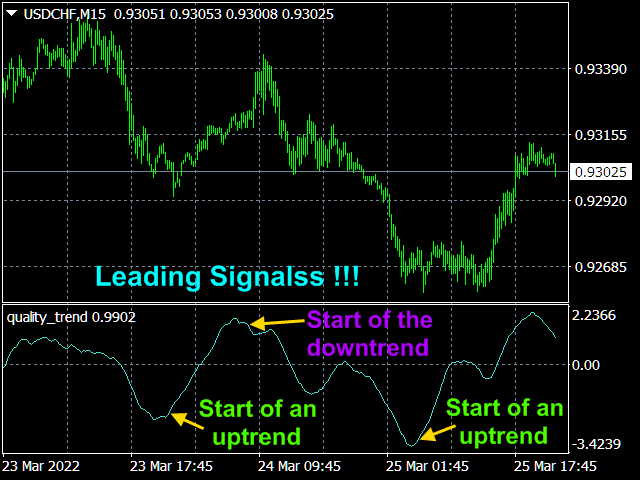
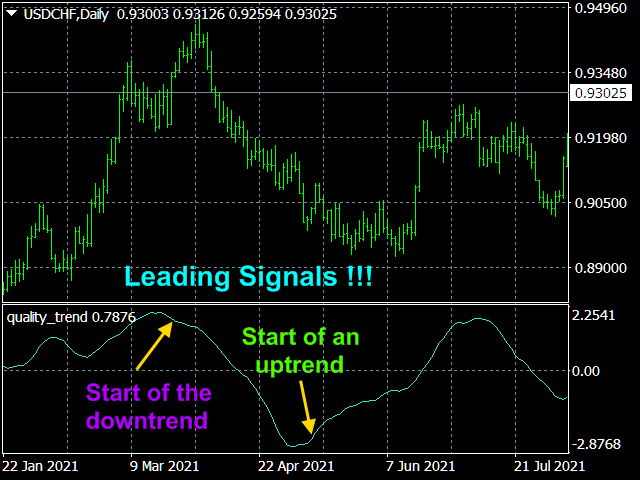
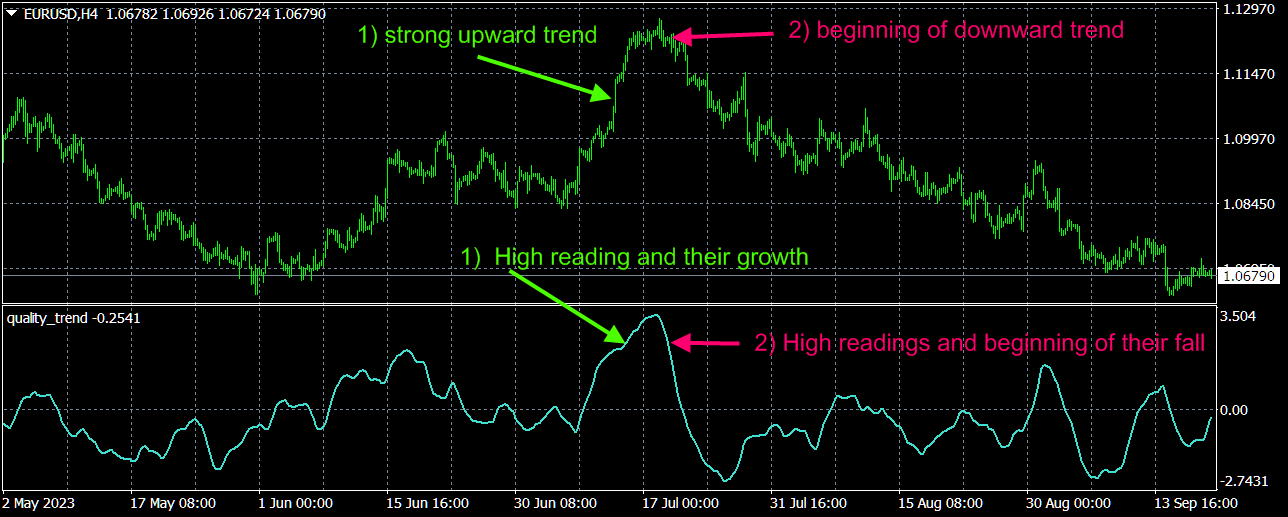
Der Indikator Qualitätstrend drückt das Verhältnis zwischen der Stärke eines Trends oder der Geschwindigkeit seines Anstiegs (Rückgangs) und dem Grad seiner Geräuschlosigkeit oder einer bestimmten Norm der Amplituden der chaotischen Schwankungen eines steigenden (fallenden) Preises aus. Die Position der Indikatorlinie über Null zeigt einen steigenden Trend an, unter Null - einen fallenden Trend, die Schwankung der Indikatorlinie in der Nähe von Null zeigt einen flachen Verlauf an. Beginnt die Indikatorlinie schnell um den Nullpunkt zu schwanken und sich diesem anzunähern, so deutet dies auf den bevorstehenden Beginn einer Trendbewegung hin. Häufig deutet eine Zunahme des Rauschens selbst eines schnell wachsenden Trends oder ein Anstieg der Volatilität auf bevorstehende Veränderungen auf dem Markt hin, insbesondere auf das Ende der entsprechenden Trendbewegung. Wenn also die Werte eines Indikators mit einem hohen Qualitätsfaktor plötzlich zu sinken beginnen, deutet dies auf das bevorstehende Ende der entsprechenden Trendbewegung hin. Die Indikatorwerte sind daher oft vorlaufend und zeigen das nahe Ende einer Trendbewegung mit einem Übergang zu einem Flat oder sogar einer Richtungsänderung der Trendbewegung an. Alle diese nützlichen Indikatoroptionen sind in den Screenshots dargestellt.
Der Indikator hinkt nicht hinterher und wird nicht neu gezeichnet.

I've only used this product for 2 weeks and it has made a notable difference. There was one minor issue with the indicator and the author was responsive and had the issue fixed shortly. This is a very good product and seems unique in it's action as the author explains.