Profit Trade
- Indikatoren
-
Aleksey Ivanov
 👑 Theoretischer Physiker, Programmierer, Händler mit 15 Jahren Erfahrung.
------------------------------------------------------------------------------------------
💰 Präsentierte Produkte: - Version: 1.10
- Aktualisiert: 21 Mai 2020
- Aktivierungen: 5
Das Prinzip der Konstruktion von Indikatorlinien.
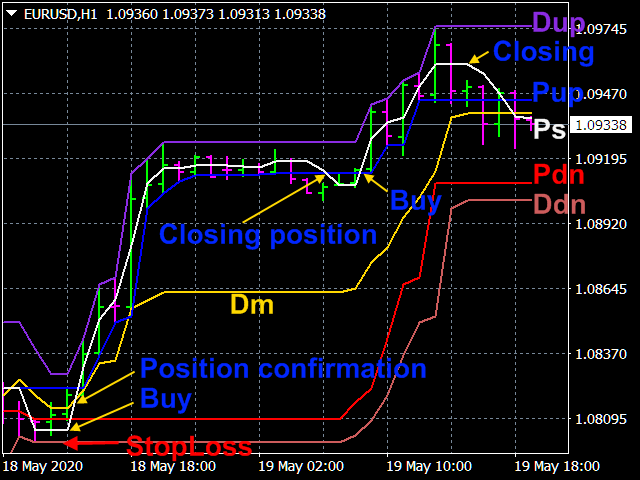
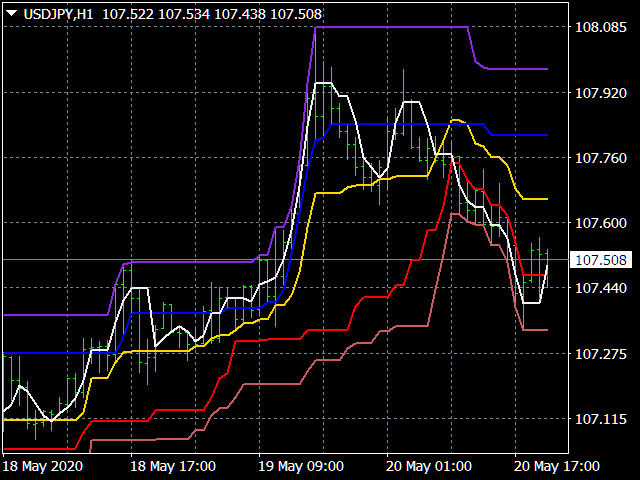
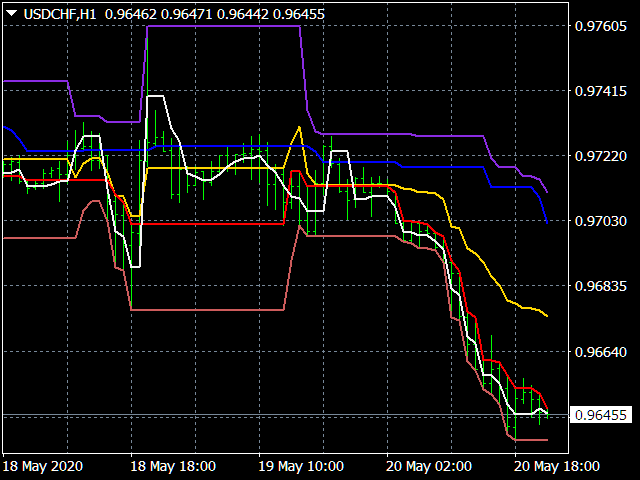
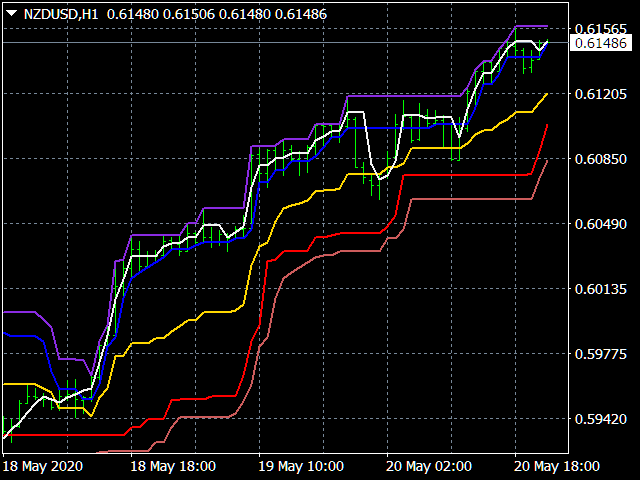
Profit Trade ist ein sehr effektiver Indikator für den Handel. Profit Trade ist eine Weiterentwicklung des bekannten Donchian-Kanal-Indikators . Die obere (blau-violette Farbe) Dup und die untere (indisch-rötliche) Ddn-Linie des Indikators werden auf die gleiche Weise wie beim Donchian-Kanal konstruiert, basierend auf den höchsten (Hoch von High) und niedrigsten (Tief von Low) Kursen der vorangegangenen n1 = 20 Perioden. Die mittlere Linie (Gold) Dm wird auf die gleiche Weise wie beim Donchian-Kanal-Indikator als Durchschnitt der beiden oben genannten Linien gebildet. Die (blaue) Pup-Linie, die sich unmittelbar unter der oberen Dup-Linie befindet, wird auf der Grundlage des Maximums der Tiefstwerte der vorangegangenen n1 Perioden gebildet. Die (rote) Pdn-Linie, die sich unmittelbar über der unteren Ddn-Linie befindet, wird in ähnlicher Weise auf der Grundlage des Höchstkurs-Tiefs gebildet. Darüber hinaus wird auf der Grundlage eines Algorithmus, der dem gleitenden Median des Durchschnittspreises (High + Low) / 2 ähnelt, jedoch mit einer kürzeren Periode n2 = 3, die Signallinie (WhiteSmoke) Ps gebildet.
Die Vorteile des Indikators.
Der Indikator zeigt den aktuellen Zustand des Marktes in einer klaren und alle charakteristischen Preisskalen abdeckenden Form an. Die in Profit Trade verwendete Filterung ist extrem robust; und dieser Indikator zeichnet sich nicht neu. Die Einstellungen des Indikators sind extrem einfach.
Handeln mit dem Profit-Trade-Indikator.
Die obere Dup-Linie und die untere Ddn-Linie decken alle aktuellen Kursschwankungen für den Zeitraum n1 ab und skizzieren einen groß angelegten Kanal. Der Kurs durchbricht diesen großräumigen Kanal, wenn sich die Marktbedingungen ändern. Tritt ein Aufwärtstrend ein, dann passt der Kurs fast immer in den engen Kanal, der durch die Dup- und Pup-Linien gebildet wird. Bei einem Abwärtstrend wird der Kurs durch die Linien Ddn und Pdn in einen engen Kanal geklemmt. Bei der Fortsetzung von Trends, die sich aus dem Durchbruch eines großräumigen Kanals ergeben, geht die Signallinie Ps immer durch die Mitte solcher auf- oder absteigender Kanäle. Wenn die Signallinie Ps die Pup-Linie im aufsteigenden Kanal von oben nach unten oder die Pdn-Linie im absteigenden Kanal von unten nach oben kreuzt, deutet dies auf einen Richtungswechsel des entsprechenden Trends hin. Eine weitere Durchschneidung der Mittellinie Dm durch die Signallinie Ps bestätigt den sich abzeichnenden Trend. Ein früheres Signal für eine Änderung der Trendrichtung ist ein scharfer Knick in der Signallinie Ps, wenn sie aus der Richtung parallel zur Horizontalen gegen den etablierten Trend gerichtet wird. Wenn die Signallinie, die zunächst horizontal verläuft, in die Richtung des Trends abknickt, wird dieser Trend fortgesetzt. Wenn der Trend aufwärts gerichtet ist und mit dem Verlassen des unteren Kanals beginnt, der durch die Linien Ddn und Pdn begrenzt wird, muss der StopLoss einer Kaufposition auf der Linie Ddn platziert werden. Bei einem Abwärtstrend, der von den Kanälen Dup und Pup ausgeht, muss der StopLoss der Verkaufsposition auf der Dup-Linie platziert werden.
Wenn die Signallinie Ps die Pup-Linie im Aufwärtskanal von oben nach unten oder die Pdn-Linie im Abwärtskanal von unten nach oben kreuzt, kann dies ebenfalls auf einen Rollback des entsprechenden Trends hinweisen. Gewinnbringende Positionen müssen in diesem Fall geschlossen werden; und wir warten, bis Ps die Pup-Linie im Aufwärtskanal von unten nach oben oder die Pdn-Linie im Abwärtskanal von oben nach unten kreuzt, was den Abschluss des Rollbacks anzeigen wird. Dann eröffnen wir wieder Positionen entsprechend dem Trend. Der StopLoss wird in diesem Fall ebenfalls wie zuvor beschrieben definiert, allerdings in einem kleineren Zeitrahmen.
Das Flat wird durch lange, horizontale Indikatorlinien gekennzeichnet, die in ihrer Länge mit den Trendbereichen vergleichbar sind. Die Eröffnung von Positionen auf dem Flat ist unerwünscht.
Eine Analyse der Marktlage sollte mit einer Betrachtung eines großen Zeitrahmens beginnen, der die Richtung des aktuellen Trends bestimmt. Wenn der Markt flach ist, ist es besser, keine Positionen zu eröffnen. Wir eröffnen Positionen entsprechend dem Trend in einem kleineren Zeitrahmen. Wenn es zu einem Pullback kommt, ist es ebenfalls nicht wünschenswert, die entsprechende Position gegen den Trend zu eröffnen, da wir zum Zeitpunkt des Rollbacks nicht wissen, wie lange er dauern wird, was sich als gering erweisen kann.
Einstellungen des Indikators.
- Die Haupt-Mittelungsperiode - eine beliebige positive ganze Zahl (20 Standard).
- Mittelungszeitraum der Signallinie - Beliebige positive ganze Zahl (Standardwert 3).
- Linienstärke -Beliebige positive Ganzzahl ( 1 Standardwert).


Der Benutzer hat keinen Kommentar hinterlassen