Probability distribution PRO
- Indikatoren
-
Aleksey Ivanov
 👑 Theoretischer Physiker, Programmierer, Händler mit 15 Jahren Erfahrung.
------------------------------------------------------------------------------------------
💰 Präsentierte Produkte: - Version: 1.10
- Aktualisiert: 23 August 2020
- Aktivierungen: 5
Der Indikator wird verwendet für:
- Definition von Preiswahrscheinlichkeitsverteilungen. Dies ermöglicht eine detaillierte Darstellung des Kanals und seiner Grenzen sowie die Vorhersage der Wahrscheinlichkeit des Auftretens eines Preises in jedem Segment seiner Schwankungen;
- die Definition des Zeitpunkts des Kanalwechsels.
Der Indikator analysiert den Kursverlauf auf niedrigeren Zeitskalen und berechnet die Wahrscheinlichkeitsverteilung des Preises auf höheren Zeitskalen. Dank der Prognosealgorithmen kann der Indikator Wahrscheinlichkeitsverteilungen und gleitende Durchschnitte ohne Verzögerungen berechnen, die normalerweise mit herkömmlichen gleitenden Durchschnitten einhergehen.
Die Funktionsweise des Indikators basiert auf der Verarbeitung einer tiefen und detaillierten Kursgeschichte. Bevor Sie den Indikator auf einem Symboldiagramm starten, sollten Sie daher die Kurshistorie (Tools/History Center) des Symbols herunterladen und"Max bars in history" und"Max bars in chart" auf den höchstmöglichen Wert erhöhen (Tools/Options/Charts). Der Indikator führt eine große Anzahl von Berechnungen durch und ist daher sehr ressourcenintensiv. Er benötigt mindestens eine 4-Kern-CPU mit 2,8 GHz und 4,00 GB RAM. Wenn der Indikator den MetaTrader 4 stark belastet, verringern Sie den Parameter "Anzahl der zählbaren Balken des aktuellen Charts" in den Indikatoreinstellungen auf den Standardwert von 200.
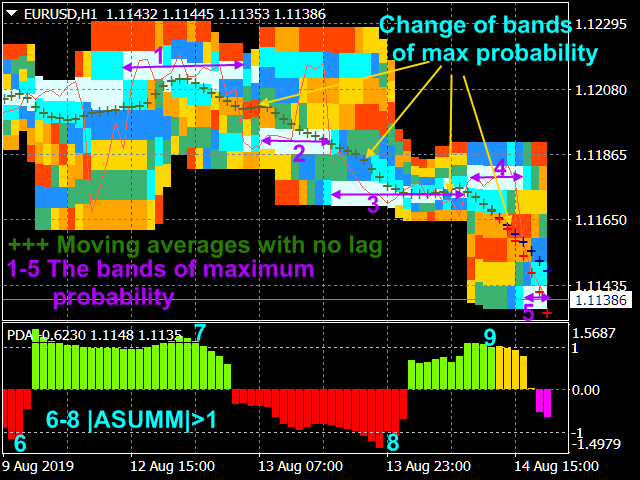
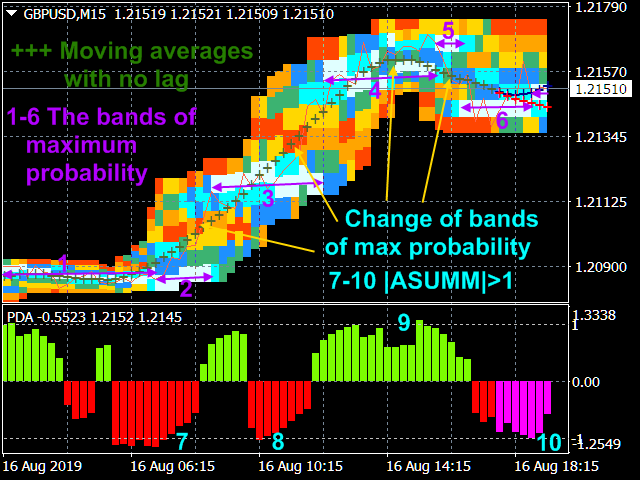
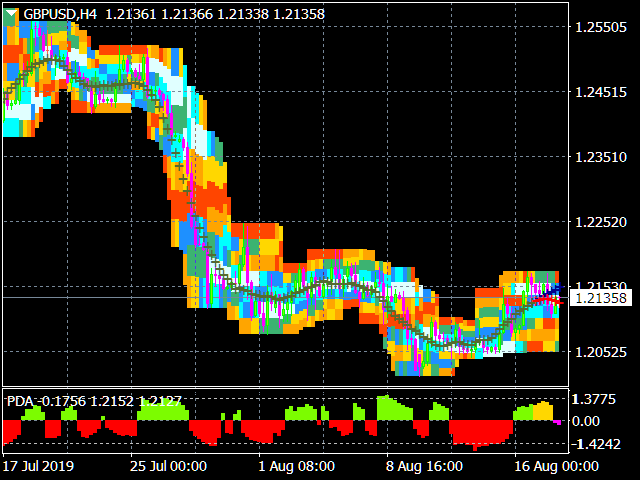
Das Programm teilt die Gesamtpreisschwankung für einen bestimmten Mittelungszeitraum in sieben gleiche Intervalle auf und berechnet die Häufigkeit der Preistreffer in diesen Intervallen. Auf der Grundlage dieser Berechnungen bildet der Indikator die Wahrscheinlichkeitssäulen, die auf zwei Arten im Hauptfenster des Terminals angezeigt werden können:
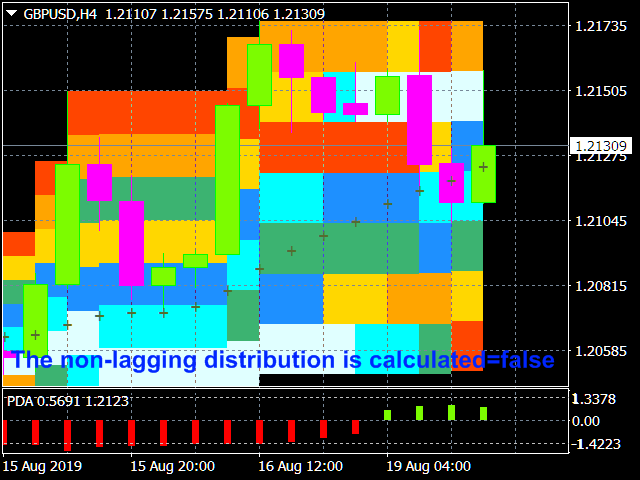
- als Farbcode, nach der Art des sichtbaren Lichtspektrums, wobei die wahrscheinlichsten Werte näher am violetten Bereich liegen, während die unwahrscheinlichsten Werte nahe am roten Bereich liegen. Die Intervalle werden entsprechend eingefärbt (die Reihenfolge der Kodierung der abnehmenden Wahrscheinlichkeit anhand der Farbskala wird in den Einstellungen festgelegt und kann von den Benutzern geändert werden);
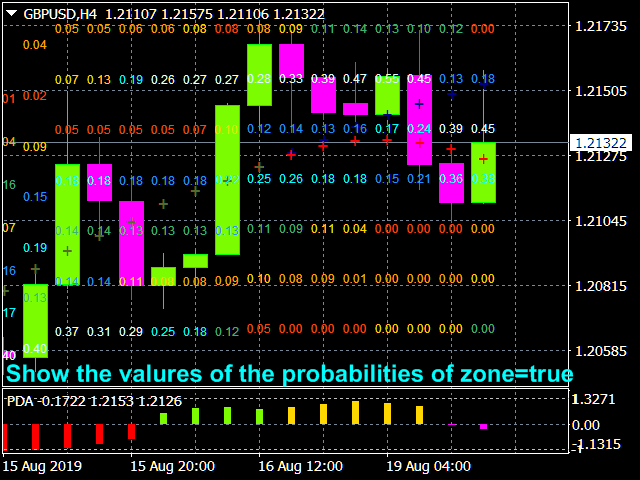
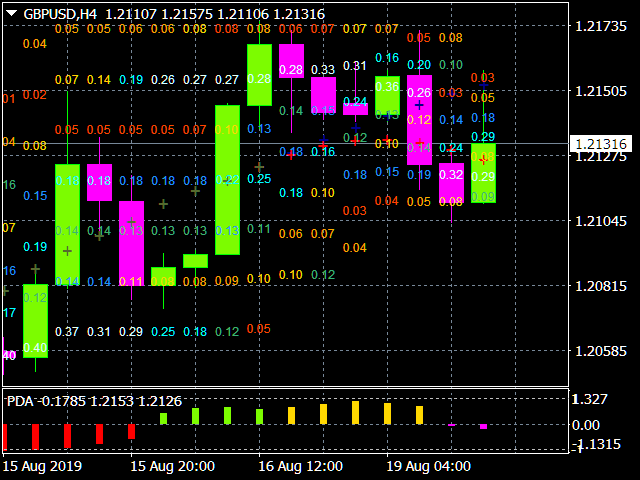
- als Werte, die die Wahrscheinlichkeit angeben, die gegebenen Intervalle mit der entsprechenden Farbe zu treffen.
Der Indikator berechnet auch die nicht nacheilende normalisierte Asymmetrie
ASUMM= (< (x - <x>)^3 >)^(1/3)/ (< (x - <x>)^2 >)^(1/2),
wobei <...> das Mittelungszeichen ist, das, wenn es die Einheit übersteigt, als ein starkes Signal für die Änderung der Richtung eines zuvor etablierten Trends dient.
Betriebsarten und Einstellungen
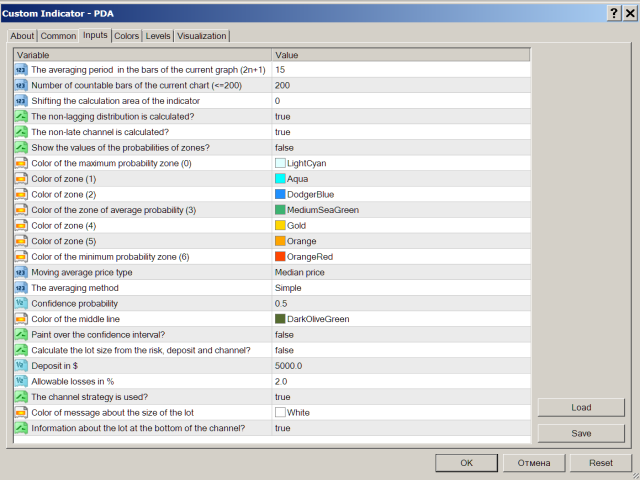
Algorithmus-Einstellungen:
- Die Mittelungsperiode in den Balken des aktuellen Diagramms (2n+1) - Mittelungsperiode (1-99).
- Anzahl der zählbaren Balken des aktuellen Diagramms (<=200) - Anzahl der berechneten Balken des Indikators (1-200).
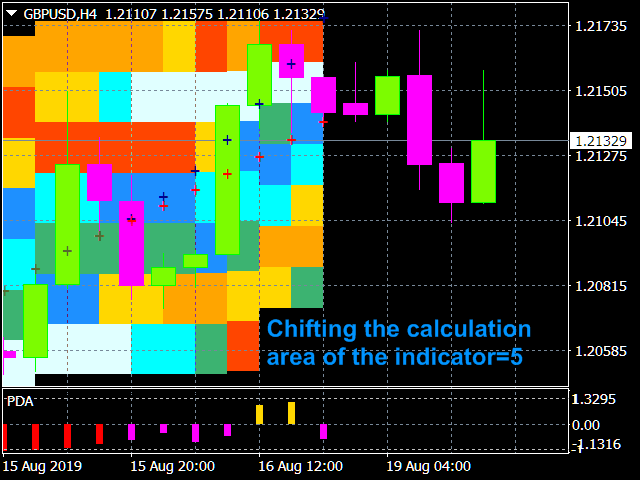
- Verschiebung des Berechnungsbereichs des Indikators - globale Indikatorverschiebung (0-100).
- Die nicht-nacheilende Verteilung wird berechnet - Berechnung einer nicht-nacheilenden Verteilung.
- Der nicht verspätete Kanal wird berechnet - Berechnung des aktuellen nicht verspäteten Kanals.
- Anzeige der Werte der Zonenwahrscheinlichkeiten - Anzeige der Zonenwahrscheinlichkeitswerte.
Farb- und Anzeigeeinstellungen:
Farben in absteigender Reihenfolge der Wahrscheinlichkeitsdichte.
- Farbe der Zone der maximalen Wahrscheinlichkeit (0);
- Farbe der Zone (1);
- Farbe der Zone (2);
- Farbe der Zone der durchschnittlichen Wahrscheinlichkeit (3);
- Farbe der Zone (4);
- Farbe der Zone (5);
- Farbe der Zone der minimalen Wahrscheinlichkeit (6) ;
Parameter des nicht nacheilenden gleitenden Durchschnitts.
- Typ des gleitenden Durchschnittspreises.
- Die Methode der Mittelwertbildung.
- Konfidenzwahrscheinlichkeit - Werte: von 0 bis 0,999 (0,5 als Standard).
- Farbe der Linie des gleitenden Durchschnitts=clrDarkOliveGreen; - Die Farbe der Indikatorlinie und ihres Zahlenbereichs.
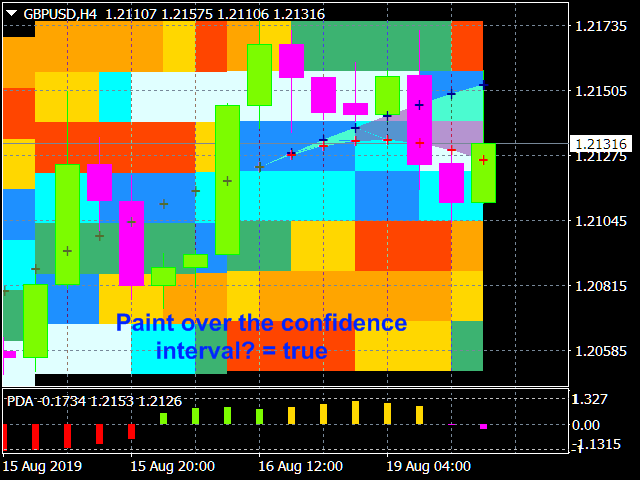
- MalenSie über das Vertrauensintervall ? Werte: true, false(standardmäßig).
Einstellungen für den Handelsmodus:
- Berechnen Sie die Losgröße aus dem Risiko, der Einlage und dem Kanal
- Einzahlung in $
- Erlaubte Verluste in %
- Die Channel-Strategie wird verwendet - true - Intra-Channel-Strategie (false - Channel-Durchbruchsstrategie)
- Farbe der Meldung über die Größe des Lots
- Information über das Lot am unteren Ende des Kanals (false - Information am oberen Ende des Kanals)
Intra-Kanal-Strategie. Die Strategie wird im Falle einer gebildeten weißen Linie verwendet - Bereich der maximalen Wahrscheinlichkeit. Eröffnen Sie die Order, wenn der Preis in den gelben oder orangen Bereich abweicht. Schließen, wenn der Preis in den weißen Bereich zurückkehrt.
Trendfolgestrategie. Ein Auftrag wird eröffnet, wenn eine Änderung des Bandes festgestellt wird (die Mitte fällt in den roten oder gelben Bereich).
StopLoss wird etwas weiter als die Kanalgrenzen platziert.