StatChannel
- Indikatoren
-
Aleksey Ivanov
 👑 Theoretischer Physiker, Programmierer, Händler mit 15 Jahren Erfahrung.
------------------------------------------------------------------------------------------
💰 Präsentierte Produkte: - Version: 1.20
- Aktualisiert: 4 September 2019
- Aktivierungen: 5
Das Prinzip des Indikators.
Der StatChannel ( SC) Indikator ist eine Weiterentwicklung des Bollinger Bands Indikators ( ВВ). BB ist ein gleitender Durchschnitt, auf dessen beiden Seiten zwei Linien eingezeichnet sind, die von ihm durch Standardabweichungen std multipliziert mit dem entsprechenden Koeffizienten getrennt sind. Dabei ergibt sich ein gleitender Durchschnitt mit einer Mittelungsperiode von (2n + 1) Balken immer mit einer Verzögerung von n Balken, und auch die Standardabweichung std wird mit einer Verzögerung von (2n + 1) Punkten auf n Balken berechnet. Eine solch starke Verzögerung mindert die Effizienz der Verwendung von BB.
Der SC-Indikator wird auf die gleiche Weise wie ein klassischer BB-Indikator konstruiert, jedoch nur auf der Grundlage des nicht verzögerten gleitenden Durchschnitts. Eine solche Kurve wird an den Punkten (Inf, n + 1] berechnet, als gleitender Durchschnitt am Segment (Inf, 0], wobei 0 die Nummer des letzten Balkens ist, um n Balken nach hinten verschoben, und an den Punkten des Segments [n, 0] geschätzt. Die Schätzung ist ein gekrümmter Sektor (übergreifendes Konfidenzintervall), in dem die Linie des nicht nacheilenden gleitenden Durchschnitts mit einem bestimmten Konfidenzniveau liegt. Der nicht-nacheilende Durchschnitt ist auch von einem nicht-nacheilenden std umgeben, der an den Punkten (Inf, n + 1) auf die gleiche Weise wie der nicht-nacheilende gleitende Durchschnitt und an den Punkten des Segments [n, 0] durch einen speziellen Algorithmus bestimmt wird, der die Menge der Werte std berechnet, die innerhalb des angegebenen Wertes des Konfidenzintervalls liegen.
Handeln Sie mit dem SC-Indikator.
Der SC-Indikator bildet die Verteilungsmuster der aktuellen Kanäle, in die sich alle Preisschwankungen haufenweise und gleichmäßig einfügen. Die Zahl der mittleren Linie gibt direkt die Werte für den aktuellen Kurs an, die in das vorgegebene (in den Einstellungen) Konfidenzniveau passen. Die Zahlen der oberen und unteren Linie beschreiben die zulässigen Abweichungen der Preisschwankungen nach oben bzw. unten.
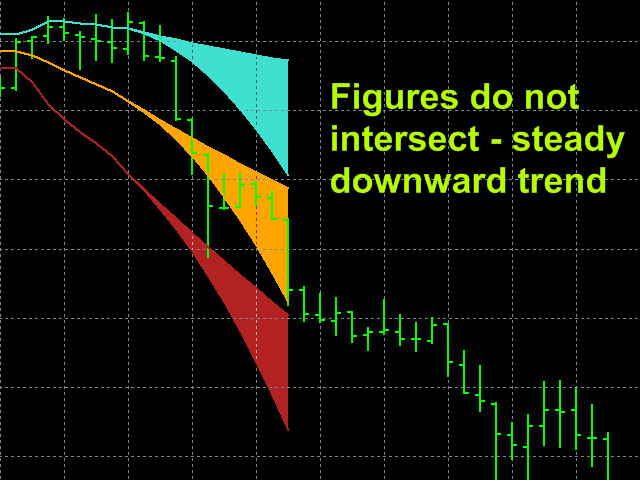
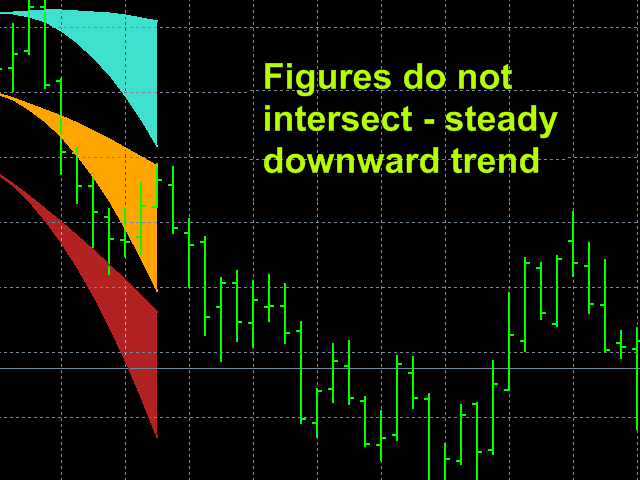
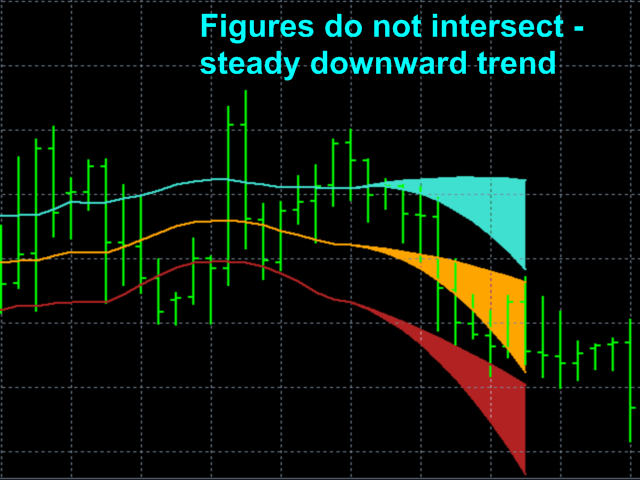
Bewegt sich die untere Grenze des Figurensektors der mittleren Komponente des SC-Indikators nach oben, so liegt ein Aufwärtstrend vor. Ist die obere Begrenzung des gekrümmten Sektors der mittleren Komponente des SC-Indikators nach unten gerichtet, liegt ein Abwärtstrend vor. In solchen Fällen können Sie mit einem bestimmten Konfidenzniveau auf die Richtigkeit der ermittelten Trendrichtung vertrauen.
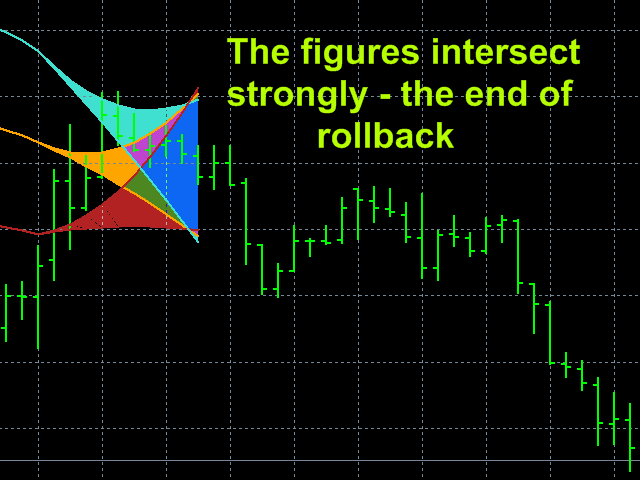
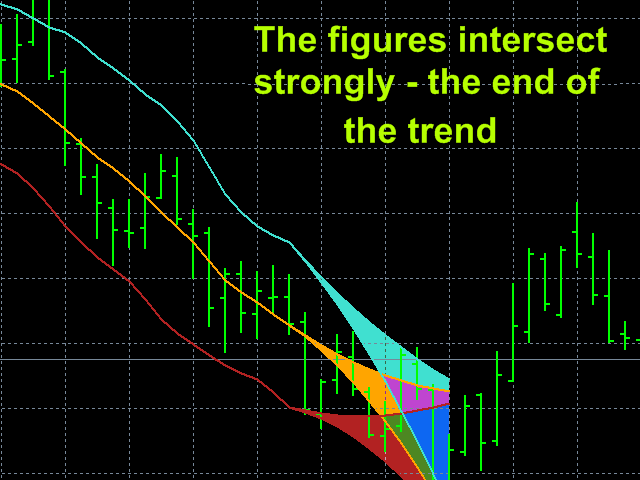
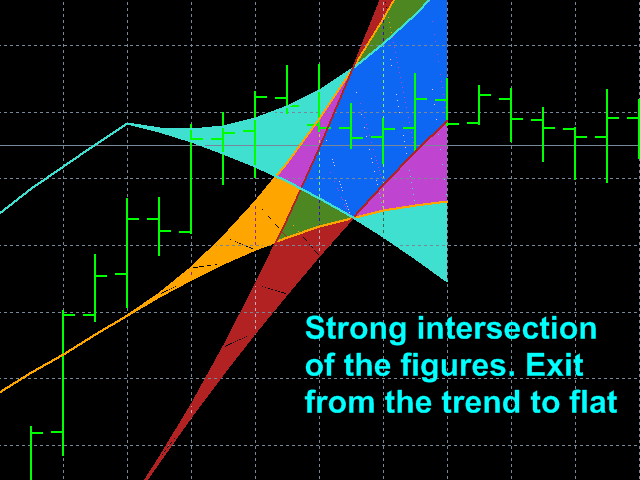
Bewegt sich die obere Grenze des Zahlensektors der mittleren Komponente des SC-Indikators nach oben und die untere Grenze nach unten, liegt ein Flat vor, das als Signal zum Schließen von Trendpositionen dient.
Wenn die farbigen Sektoren klar geteilt sind, dann müssen Sie, wenn sich der Preis dem oberen Rand der oberen Linie nähert, eine Position auf Verkaufen eröffnen, und wenn sich der Preis dem unteren Rand der unteren Linie nähert, auf Kaufen, was natürlich getan werden muss, wenn es einen ausgeprägten Trend in Bezug auf die Richtungen gibt, d. h..Spielen Sie also nicht gegen diesen Trend. Schließt man hingegen Positionen, so verkauft man , wenn der Kurs auf den Zahlenbereich der unteren Linie fällt, und kauft , wenn der Kurs auf den Zahlenbereich der oberen Linie steigt.
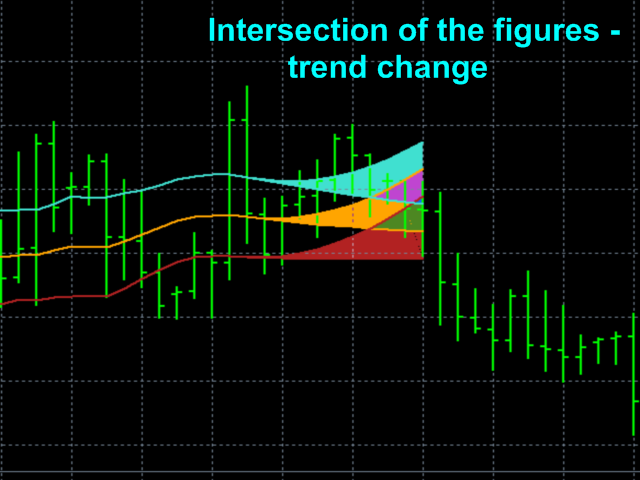
Eine starke Überschneidung der Sektoren deutet auf eine hohe Wahrscheinlichkeit eines Trendwechsels hin.
Einstellungen des Indikators.
- Preistyp - angewandter Preis. Werte: Schlusskurs, Eröffnungskurs, Höchstkurs, Tiefstkurs, Medianpreis ((Hoch + Tief)/2 - Standard), Typischer Preis ((Hoch + Tief + Schluss)/3), Gewichteter Preis ((Hoch + Tief + 2*Schluss)/4).
- Die Mittelungsmethode - Mittelungsmethode. Werte: Einfach (Standard), Exponential, Geglättet, Linear gewichtet.
- Die Mittelungsperiode - Mittelungsperiode. Werte: eine beliebige ganze Zahl (Standardwert 21).
- Konfidenzwahrscheinlichkeit Werte: eine beliebige reelle Zahl von 0 bis 0,999 (0,67 Standardwert).
- Kanalbreitenfaktor in STD - Kanalbreitenfaktor in Standardabweichungen Werte: eine beliebige reelle Zahl (Standardwert 1,0).
- Globale Verschiebung - Globale Verschiebung des Beginns der Indikatormesswerte in Balken. Werte: eine beliebige positive Ganzzahl (Standardwert 0).
- Farbe der oberen Zeile - Farbe der oberen Zeile und des Zahlenbereichs. Voreinstellung Türkis.
- Farbe der Mittellinie - Farbe der Mittellinie und des Figurensektors. Standardwert Orange.
- Bottom line color - Farbe der unteren Linie und des Figurensektors. Standardmäßig FireBrick.
- Das Konfidenzintervall übermalen? - Zum Einfärben des Zahlenbereichs des Konfidenzintervalls. Werte: true (Standard), false.


Good indicator.