CCFpExtraValue
- Indikatoren
-
Stanislav Korotky
 Trading is just my hobby. I'm working in IT industry. So developement of experts, indicators, and script is not a problem at all to me. Wide range of technologies are used: MQL4, MQL5, system and applied programming, web-services, neural networks and more.
New: - Version: 1.1
- Aktualisiert: 24 November 2021
- Aktivierungen: 5
Dies ist ein Cluster-Indikator für mehrere Währungen mit erweiterter Funktionalität. Er zeigt lineare Veränderungen im relativen Wert von Tickern und Währungen auf jährlicher, monatlicher und wöchentlicher Basis an. Er berechnet die Werte auf die gleiche Weise wie CCFpExtra, verwendet aber keine gleitenden Durchschnitte. Stattdessen werden alle Zahlen mit einem Anfangswert zu einem bestimmten Zeitpunkt in der Geschichte verglichen, zum Beispiel zu Beginn eines Jahres, eines Monats oder einer Woche. Als Ergebnis kann man genaue Veränderungen der Werte sehen und traditionelle technische Analysen darauf anwenden, wie z.B. Unterstützungs- und Widerstandslinien, Kanäle, Fibo-Levels usw.
Wie bei CCFpExtra sind weitere Merkmale des Indikators:
- Beliebige Gruppen von Tickern oder Währungen;
- Zeitliche Angleichung der Balken für verschiedene Symbole mit korrektem Umgang mit eventuell fehlenden Balken;
- bis zu 30 Instrumente (nur die ersten 8 werden angezeigt).
Parameter
- Instrumente - durch Komma getrennte Liste von Instrumenten mit einer gemeinsamen Währung;
- für Forex-Symbole ist die gemeinsame Währung entweder eine Kurswährung oder eine Basiswährung, die in allen angegebenen Symbolen erkannt wird;
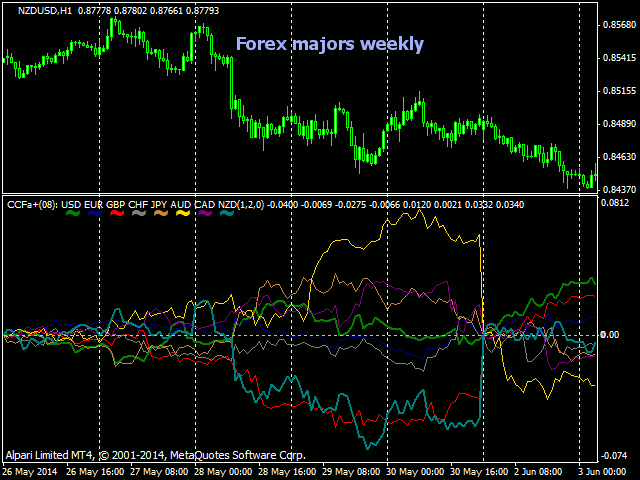
- wenn die automatische Erkennung fehlgeschlagen ist (wie bei Nicht-Forex-Tickern), wird der Parameter DefaultBase verwendet (hier bedeutet 'base' eine gemeinsame Währung für alle Ticker, nicht eine Basiswährung eines Forex-Symbols); der Standardsatz von Instrumenten umfasst alle Forex-Majors EURUSD, GBPUSD, USDCHF, USDJPY, AUDUSD, USDCAD, NZDUSD;
- bitte beachten Sie, dass NZDUSD auf einigen Demoservern fehlen kann, vergessen Sie also nicht, dies entsprechend zu ändern;
- MA_Methode - Methode des gleitenden Durchschnitts, die Standardeinstellung ist linear gewichtet;
- Preis - Typ des auf den gleitenden Durchschnitt angewendeten Preises, die Voreinstellung ist der offene Preis;
- Smooth - Zeitraum des gleitenden Durchschnitts für die Glättung, die Voreinstellung ist 1;
- All_Bars - Anzahl der zu berechnenden Balken, 0 bedeutet alle verfügbaren Balken, Standardwert ist 1000;
- BarByBar - false bedeutet, dass der 0-te Balken bei jedem Tick neu berechnet wird, true (Voreinstellung) bedeutet, dass der Balken nur einmal berechnet wird (beim 1. Tick und beim Schließen);
- AlignmentHint - ein Hinweisstring für den nächsten Parameter;
- Alignment - was als Anfangspunkte verwendet werden soll: 0 - Jahr, 1 - Monat, 2 - Woche, 3 - benutzerdefiniertes Startdatum; Standard - 0;
- Start - Datum für den benutzerdefinierten Startpunkt;
- Shift - Anzahl der Tage, um die die Anfangspunkte verschoben werden; Standardwert - 0;
- DefaultBase - zu verwendende Standardwährung; wird nur verwendet, wenn die Basis nicht automatisch erkannt werden kann.
Beschreibung
Achten Sie beim Ausfüllen von Instruments darauf, dass Sie vorhandene Symbole eingeben - wenn das Symbol falsch geschrieben oder auf Ihrem Server nicht verfügbar ist, tritt ein Fehler auf. Wenn der Parameter Instrumente ein Symbol enthält, das in Market Watch fehlt oder dessen Daten unzureichend sind, schreibt der Indikator eine Meldung in das Expertenprotokoll.
Wenn die Anzahl der Instrumente größer als 8 ist, nehmen alle Instrumente an den Berechnungen teil und wirken sich auf die Chartlinien aus, aber nur die ersten 8 werden angezeigt. Obwohl es möglich ist, mehr als 8 Linien zu haben, würde dies zu Schwierigkeiten bei der Wahrnehmung führen.
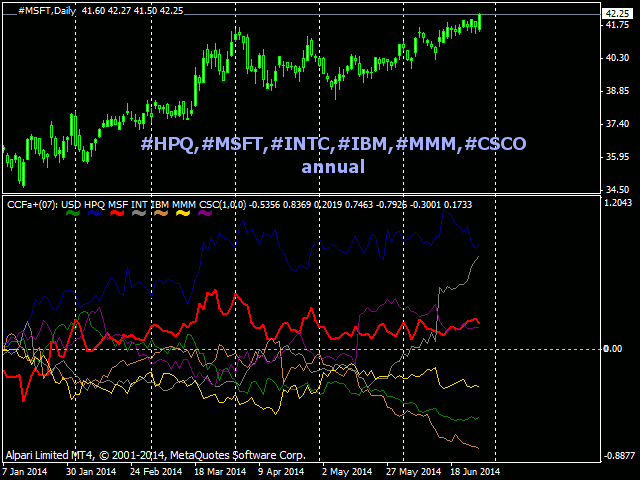
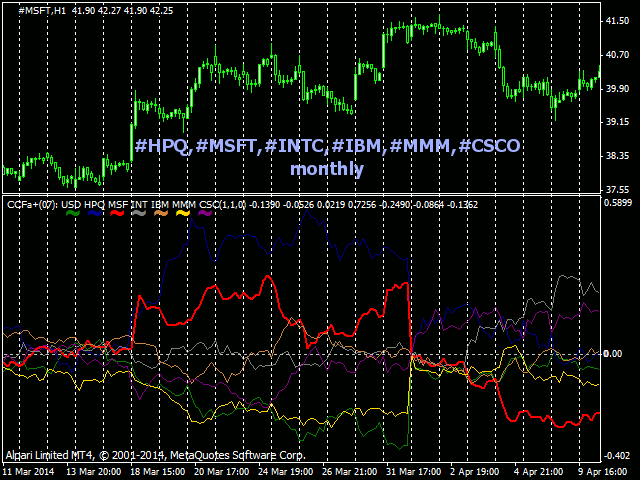
Mit CCFpExtraValue können Sie viele interessante Cluster analysieren, z. B. die Ölindustrie (#LKOH, #ROSN, #SGNS, #SIBN), Lebensmittel (Weizen, Mais, Soja), Banken usw. Die folgenden Screenshots zeigen zum Beispiel die großen Devisenmärkte und die Blue Chips des IT-Sektors.