RenkoButterfly
- Indikatoren
-
Sergey Deev
 I'm implementing your ideas in MQL4: https://www.mql5.com/ru/job/new?prefered=work2it
 - Version: 1.1
- Aktualisiert: 18 November 2021
- Aktivierungen: 5
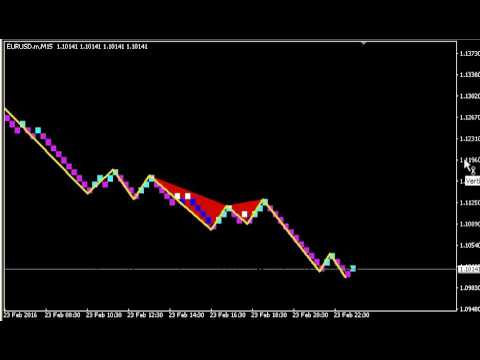
Der Indikator zeigt Renko-Balken auf dem Diagramm an, verwendet sie, um die ZigZag-Trendlinien zu zeichnen, die die lokalen Tiefs und Hochs der Preisbewegung verbinden, und hebt sie auf der Grundlage der Gartley-Muster hervor, die die potenziellen Preisumkehrpunkte anzeigen.
Renko - spezialisierte Darstellung der Kursbewegung, bei der das Diagramm nicht bei jedem Balken des Zeitrahmens angezeigt wird, sondern nur unter der Bedingung, dass der Kurs mehr als die angegebene Anzahl von Punkten überschritten hat. Renko-Balken sind nicht an einen Zeitrahmen gebunden, so dass der Indikator auf jedem Zeitrahmen mit der gleichen Effizienz arbeiten kann.
Diese Implementierung des ZigZag wird auf der Grundlage von zwei Parametern dargestellt - zzDev (Mindestabweichung in Prozent der vorherigen Bewegung) und zzBack (die Mindestanzahl der Renko-Balken, die sich in die der vorherigen Bewegung entgegengesetzte Richtung bilden).
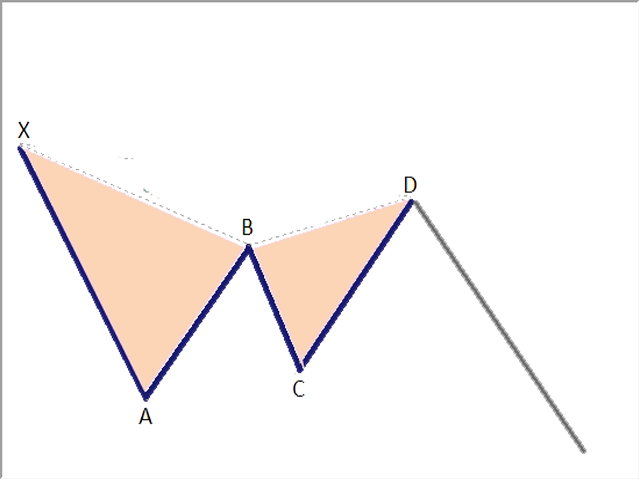
Die Gartley-Muster werden entsprechend dem angegebenen Verhältnis hervorgehoben. Ein Beispiel für die Benennung der Scheitelpunkte finden Sie im Screenshot, Proportionen - in den Indikatorparametern. Die im Indikator standardmäßig eingestellten Proportionen dienen lediglich dazu, die Anzahl der identifizierten Figuren zu erhöhen und die Funktionsfähigkeit des Indikators zu demonstrieren. Sie können genauere Werte für den Indikator eingeben, um bestimmte Muster zu erkennen. Der Indikator kann so konfiguriert werden, dass er Muster mit ähnlicher Struktur erkennt - Schmetterling, Fledermaus, Krabbe, Weißer und Schwarzer Schwan. Der Indikator zeigt nur das zuletzt gebildete Muster auf dem Chart an.
Beschreibung der Parameter des Indikators:
- RenkoBar - Größe eines Renko-Balkens in Punkten (wird bei 5-stelligen Kursen automatisch neu berechnet);
- CountBars - die Anzahl der Renko-Balken, die auf dem Chart angezeigt werden;
- bearColor - Farbe eines bärischen Renko-Balkens;
- bullColor - Farbe eines bullischen Renko-Balkens;
- hideBars - Flagge zum Ausblenden der üblichen Balken im Diagramm;
- zzDev - Abweichung von der vorherigen Bewegung in Prozent;
- zzBack - Abweichung von der vorherigen Bewegung als Anzahl der Renko-Balken;
- zzColor - Farbe der ZigZag-Linien;
- zzWidth - Breite der ZigZag-Linien;
- AB_min, AB_max - Einstellungen der AB/XA-Verhältnisse;
- BC_min, BC_max - Einstellungen des BC/AB-Verhältnisses;
- CD_min, CD_max - Einstellungen der CD/BC-Verhältnisse;
- AD_min, AD_max - Einstellungen der AD/XA-Verhältnisse;
- patternBullColor - Farbe des bullischen Musters;
- patternBearColor - Farbe des bärischen Musters;
- useAlert - aktiviert Pop-up-Warnungen;
- useMail - aktiviert E-Mail-Benachrichtigungen;
- useNotification - aktiviert Push-Benachrichtigungen.