FreqoMeterForecast
- Indikatoren
-
Stanislav Korotky
 Trading is just my hobby. I'm working in IT industry. So developement of experts, indicators, and script is not a problem at all to me. Wide range of technologies are used: MQL4, MQL5, system and applied programming, web-services, neural networks and more.
New: - Version: 1.2
- Aktualisiert: 22 November 2021
- Aktivierungen: 5
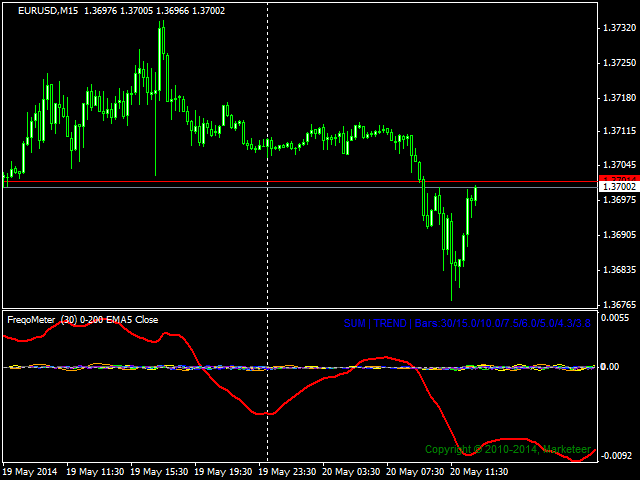
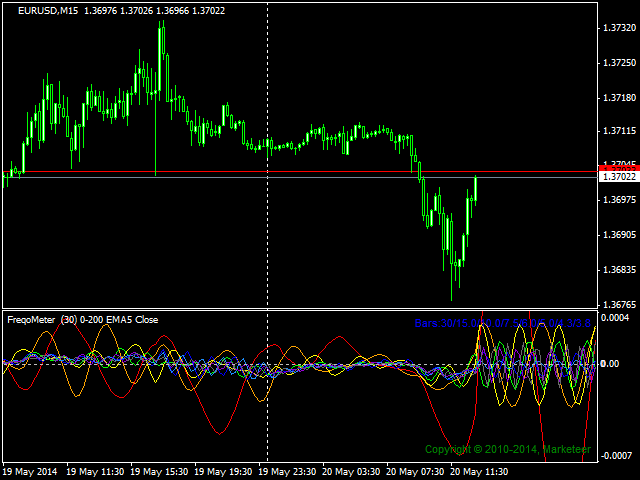
Die Hauptidee dieses Indikators ist die Analyse und Vorhersage von Wechselkursen durch Fourier-Transformation. Der Indikator zerlegt die Wechselkurse in die wichtigsten Oberschwingungen und berechnet deren Produkt in der Zukunft.
Sie können den Indikator als eigenständiges Produkt verwenden, aber für eine bessere Vorhersagegenauigkeit gibt es einen anderen verwandten Indikator - FreqoMaster - der FreqoMeterForecast als Backend-Engine verwendet und mehrere Instanzen von FreqoMeterForecast für verschiedene Frequenzbänder kombiniert.
Parameter:
- iPeriod - Anzahl der Balken in der Hauptperiode der Analyse; sie wird für die anderen 7 Oberwellenberechnungen verwendet - insgesamt passen 8 Frequenzen in die gegebene Zeitreihe; standardmäßig - 30;
- iStartFrom - Anzahl der Balken, bei denen die Analyse beginnt (links in der Historie) und bei denen die Vorhersage beginnt (rechts); Standardwert - 0;
- iWindowSize - Anzahl der Balken, die ein Fenster zur Anzeige der Frequenzzerlegung bilden; standardmäßig - 200;
- iForecast - Anzahl der zu prognostizierenden Balken; standardmäßig - 100; wenn sie größer als iPeriod ist, wird stattdessen iPeriod verwendet;
- ShowSum - aktiviert/deaktiviert die Ausgabe der Oberschwingungssumme; standardmäßig - true; wenn aktiviert, wird eine rote fette Linie für die Summe verwendet;
- ShowTrend - aktiviert/deaktiviert die Trendkorrektur; standardmäßig - true;
- EMAPeriod - Zeitraum für die Glättung; Standardwert - 5;
- PriceType - zu verwendender Preistyp; standardmäßig - 0 (close);
Der Indikator arbeitet bar für bar, ohne Ticks zu verarbeiten. Er wird bei jedem neuen Balken neu gezeichnet, das ist so vorgesehen.