Trapezoidal Support and Resistance MT5
- Indikatoren
- Version: 4.5
- Aktualisiert: 19 November 2021
- Aktivierungen: 5

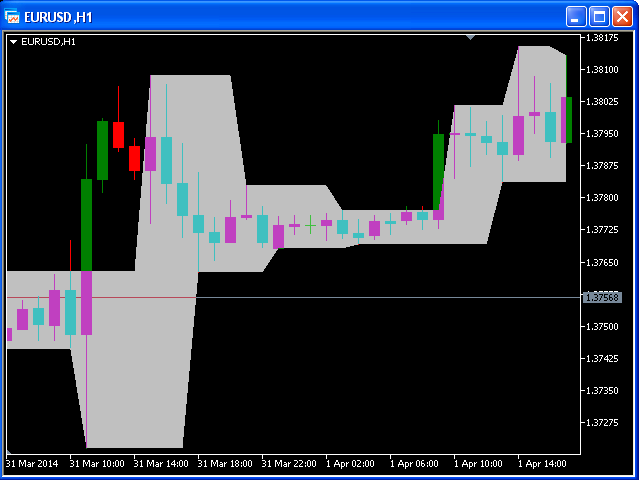
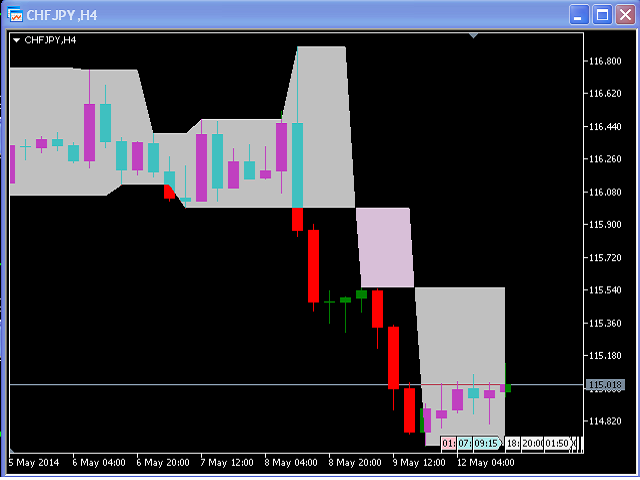
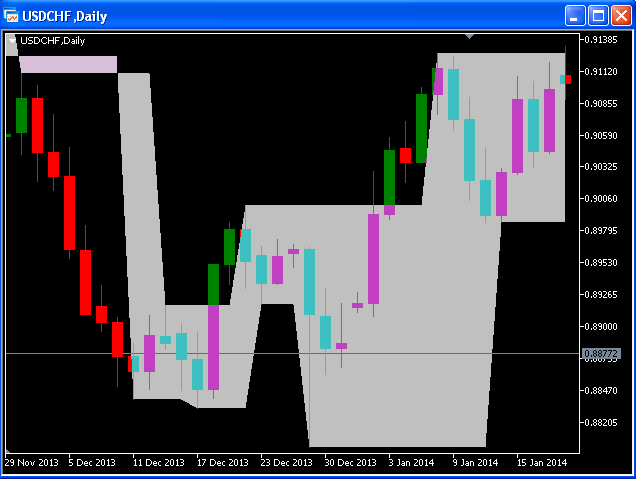
"Unterstützungs- und Widerstandsniveaus - Punkte, an denen ein Wechselkurstrend unterbrochen und umgekehrt werden kann - werden häufig für kurzfristige Wechselkursprognosen verwendet.
Man kann diesen Indikator als Kauf-/Verkaufssignal verwenden, wenn der aktuelle Kurs über oder unter die Widerstands- bzw. Unterstützungsniveaus steigt, und als StopLoss-Wert für die eröffnete Position.