Trapezoidal Support and Resistance MT5
- Indicadores
- Versión: 4.5
- Actualizado: 19 noviembre 2021
- Activaciones: 5

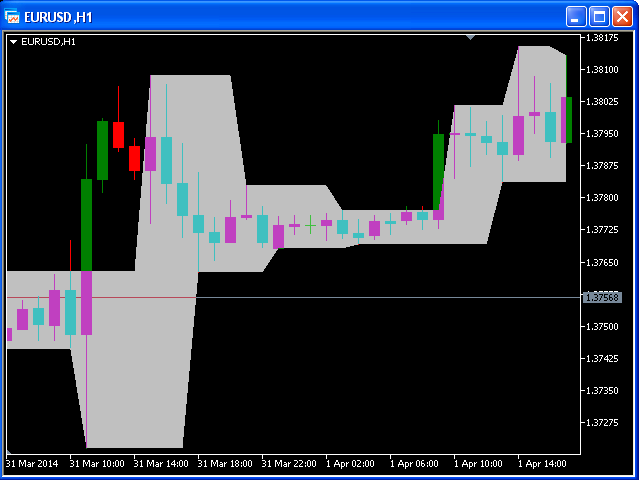
Los niveles de "Soporte" y "Resistencia" - puntos en los que la tendencia del tipo de cambio puede ser interrumpida e invertida - son ampliamente utilizados para la previsión del tipo de cambio a corto plazo.
Uno puede utilizar este indicador como señales de Compra/Venta cuando el precio actual va por encima o más allá de los niveles de Resistencia/Soporte respectivamente y como un valor de StopLoss para la posición abierta.