MTF Fractal Support Resistance
- Indikatoren
- Version: 2.5
- Aktualisiert: 24 April 2020
- Aktivierungen: 5

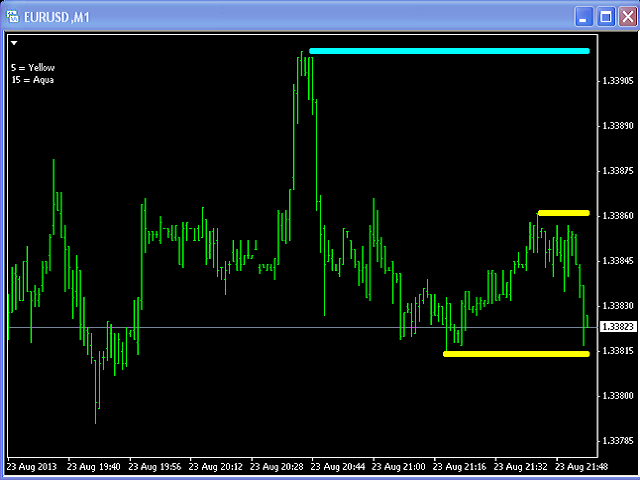
Dieser Multi TimeFrame Indikator basiert auf dem klassischen Indikator "Fractals".
2 Eingaben:
TimeFrame1;
ZeitFrame2;
Sie können alle verfügbaren TimeFrame-Werte (von M1 (Period_M1) bis MN1 (Period_MN1)) eingeben, die gleich oder größer ( >= ) als die Periode des aktuellen TimeFrame sind.
Die letzten Fraktale werden als farbige Linien (Dots Line) der Unterstützung und des Widerstands für die Preisbewegung angezeigt.