MultiTimeFrame DeMarker
- Indikatoren
- Version: 4.4
- Aktualisiert: 22 November 2021
- Aktivierungen: 5

Dieser Indikator basiert auf einem klassischen DeMarker-Indikator.
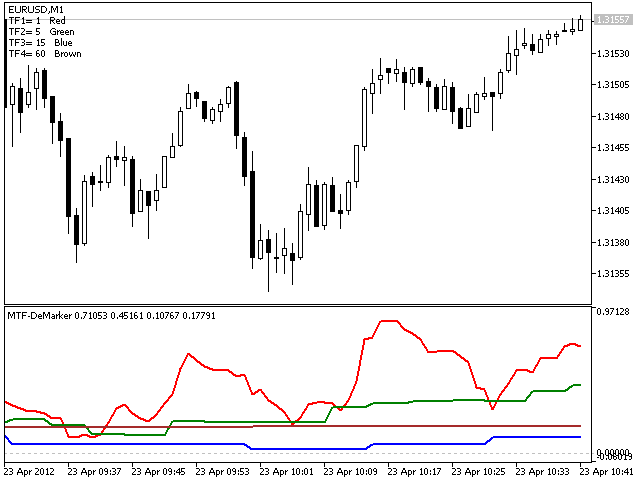
Der Multi TimeFrame-Indikator MTF-DeMarker zeigt Daten aus den 4 von Ihnen gewählten Zeitrahmen an.
Standardmäßig hat dieser Indikator externe Parameter:
- TF1 = 1;
- TimeFrame2b = wahr;
- TF2 = 5;
- TimeFrame3b = wahr;
- TF3 = 15;
- TimeFrame4b = wahr;
- TF4 = 60;
- InpPeriod = 14;
Sie können TF1-TF4 in den nächsten Grenzen ändern:
- TF1 von M1 (1) bis H4 (240)
- TF2 von M5 (5) nach D1 (1440)
- TF3 von M15 (15) nach W1 (10080)
- TF4 von M30 (30) bis MN1 (43200)
Alle gewählten TFs sollten nicht kleiner als der aktuelle Zeitrahmen sein.
Sie können Daten von 4 oder weniger TFs verwenden, indem Sie bool-Parameter verwenden: TimeFrame1b - TimeFrame4b.