High Low Exponential
- Indikatoren
- Version: 2.5
- Aktualisiert: 24 April 2020
- Aktivierungen: 5

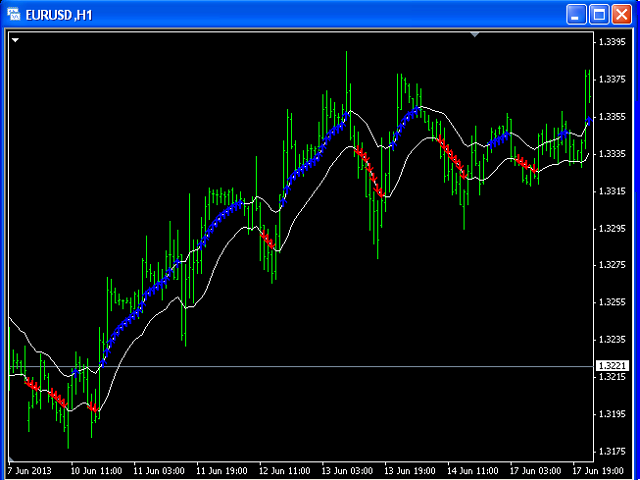
Dieser Indikator erstellt 2 weiße Linien, die auf dem Exponentiellen Gleitenden Durchschnitt der Höchst- und Tiefstkurse basieren.
Sie können mit dem Eingabeparameter HL_Period festlegen, wie viele Balken in die Berechnung einbezogen werden.
Rote und blaue Pfeile zeigen den Moment an, in dem Sie entsprechend Short- und Long-Trades eingehen können.