Fibonacci Average Stepper
- Indikatoren
- Version: 4.4
- Aktualisiert: 25 April 2020
- Aktivierungen: 5

Die Fibonacci-Folge ist durch eine ganzzahlige Folge definiert: 0, 1, 1, 2, 3, 5, 8, 13, 34, 55, 89, 144, ...
Per Definition beginnt sie bei 0 und 1, die nächste Zahl wird als Summe der beiden vorherigen Zahlen berechnet.
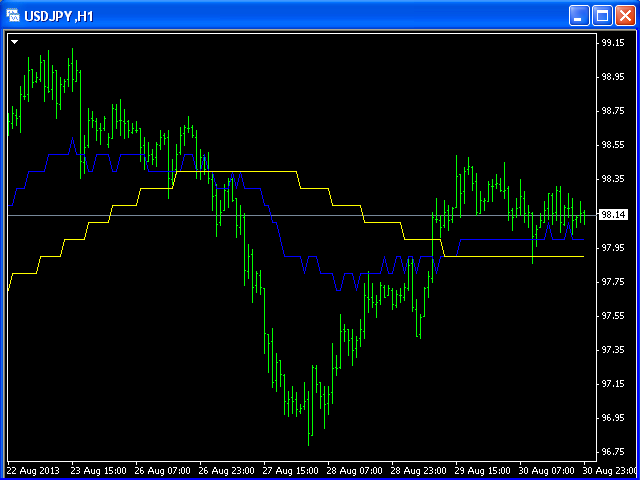
Anstelle des standardmäßigen gleitenden Durchschnitts verwendet der Indikator die Berechnung des Durchschnittspreises in der Form:
Bar0 + Bar1 + Bar2 + Bar3 + Bar5 + Bar8 + Bar13 +...
Eingabe-Parameter:
- FiboNumPeriod (15) - Fibonacci-Periode;
- nAppliedPrice (0) - angewandter Preis (PRICE_CLOSE=0; PRICE_OPEN=1; PRICE_HIGH=2; PRICE_LOW=3; PRICE_MEDIAN=4; PRICE_TYPICAL=5; PRICE_WEIGHTED=6);
- maPeriod (55) - Zeitraum des MA;
- maMethod (0) - MA-Modus (MODE_SMA=0; MODE_EMA=1; MODE_SMMA=2; MODE_LWMA=3).