MTF CCI withTrigger
- Indikatoren
- Version: 3.5
- Aktualisiert: 20 April 2020
- Aktivierungen: 5

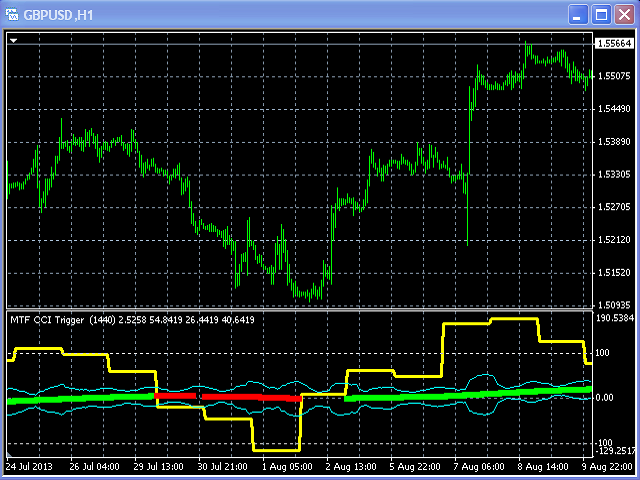
Multi TimeFrame Indikator "MTF CCI Trigger" basierend auf dem Commodity Channel Index aus dem oberen TF (Eingabeparameter "TimeFrame") gelbe Linie.
Die Aqua-Linie stellt die ATR-Hüllkurven des aktuellen TF dar.
Grüne und rote Pfeile werden durch den CCI ausgelöst und repräsentieren dementsprechend Auf- und Abwärtstrends.