Five CCIs Main Pairs
- Indikatoren
- Version: 5.42
- Aktualisiert: 23 März 2020
- Aktivierungen: 5

Dieser Indikator basiert auf zwei Ideen:
- Korrelationen zwischen 5 Hauptwährungspaaren: EURUSD, GBPUSD, USDCHF, USDJPY, USDCAD;
- US-Dollar-Index = der Wert des US-Dollars im Verhältnis zu einem Korb von Fremdwährungen.
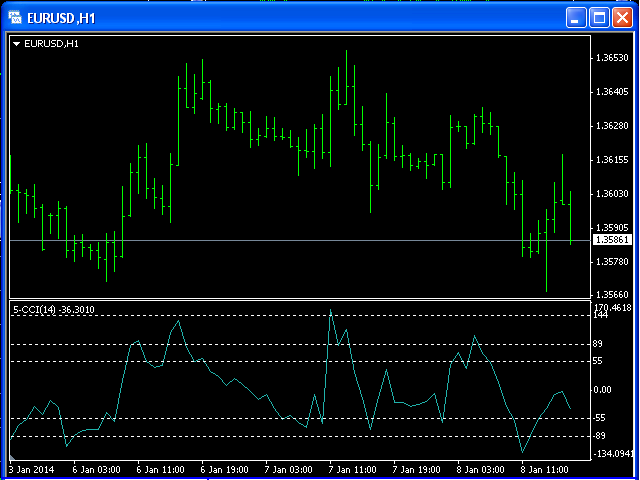
Die Verwendung des Indikators ist die gleiche wie die des klassischen Commodity Channel Index (CCI) Indikators.
Der CCI wird mit der folgenden Formel berechnet:(Typischer Kurs - Einfacher Gleitender Durchschnitt) / (0,015 x Mittlere Abweichung)
(Typischer Preis - Einfacher Gleitender Durchschnitt) / (0,015 x Mittlere Abweichung)