Flat Market
- Indikatoren
- Version: 2.8
- Aktualisiert: 24 April 2020
- Aktivierungen: 5

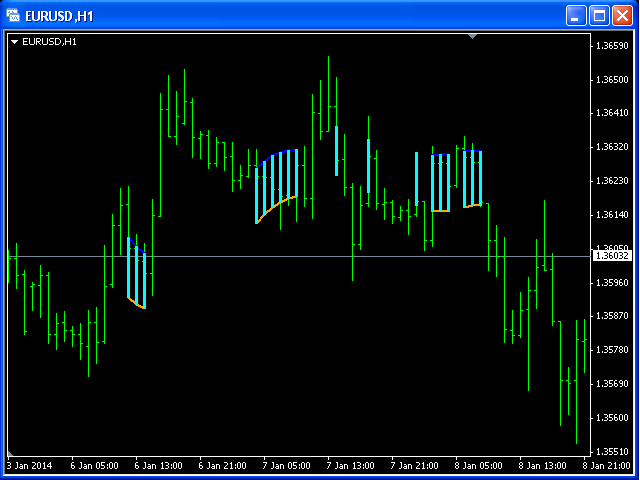
Dies ist ein selbsterklärender Indikator - nichts tun, wenn der aktuelle Preis in der "Zaun" (flach) Modus.
Definition eines flachen Marktes: Ein Marktpreis, der sich weder nach oben noch nach unten bewegt.
Der Eingabeparameter counted_bars bestimmt, bei wie vielen Balken die Linien des Indikators ab dem aktuellen Balken rückwärts sichtbar sind.
Der Eingabeparameter barsNum wird als Periode für die Berechnung des Aqua "fence" verwendet.